Impact Factor ISSN: 1837-9664

 Global reach, higher impact
J Cancer 2019; 10(1):178-185. doi:10.7150/jca.26391 This issue Cite
Research Paper
High expression of MiR-98 is a good prognostic factor in acute myeloid leukemia patients treated with chemotherapy alone
Ning Hu1, Zhiheng Cheng2, Yifan Pang3,4, Hongmian Zhao1, Li Chen1, Chao Wang1, Tong Qin1, Qianyu Li1, Yu Han1, Jinlong Shi2,5,6 ![]() , Lin Fu1,3
, Lin Fu1,3 ![]()
1. Department of Hematology, Huaihe Hospital of Henan University, Kaifeng, 475000, China
2. Translational Medicine Center, Huaihe Hospital of Henan University, Kaifeng, 475000, China
3. Department of Hematology and Lymphoma Research Center, Peking University, Third Hospital, Beijing, 100191, China
4. Department of Medicine, William Beaumont Hospital, Royal Oak, MI 48073, USA
5. Department of Biomedical Engineering, Chinese PLA General Hospital, Beijing, 100853, China
6. Department of Medical Big Data, Chinese PLA General Hospital, Beijing, 100853, China
Received 2018-9-10; Accepted 2018-11-9; Published 2019-1-1
Abstract
It has been demonstrated that microRNA-98 (miR-98) is dysregulated in multiple types of solid tumors, but its expression and impact in acute myeloid leukemia (AML) is unclear. To explore the prognostic role of miR-98 in AML, 164 AML patients with the miR-98 expression data were extracted from The Cancer Genome Atlas (TCGA) database and enrolled in this study. First, patients were divided into chemotherapy-only (chemotherapy) group and allogeneic hematopoietic stem cell transplant (allo-HSCT) group. Each group was then divided in two groups by the median expression level of miR-98. In chemotherapy group, high miR-98 expression was associated with longer event-free survival (EFS, P = 0.003) and overall survival (OS, P = 0.004), but in allo-HSCT group, EFS and OS were not significantly different between high and low miR-98 expressers. Second, All patients were divided in two groups by the median expression level of miR-98. In low miR-98 expressers, those treated with allo-HSCT had longer EFS (P = 0.001) and OS (P < 0.001) than chemotherapy, but in high miR-98 expressers, survival was independent from treatment modalities. Gene ontology enrichment analysis indicated that the genes associated with miR-98 expression were mainly concentrated in “definitive hemopoiesis”, “negative regulation of myeloid cell differentiation” and “signaling pathways regulating pluripotency of stem cells” pathways. In conclusion, our results indicated that high miR-98 expression confers good prognosis in AML patients treated with chemotherapy alone. Patients with low miR-98 expression may benefit from allo-HSCT.
Keywords: Acute myeloid leukemia, MiR-98, Allogeneic hematopoietic stem cell transplantation, Chemotherapy, Prognosis
Introduction
The vast genetic heterogeneity is not only characteristic of acute myeloid leukemia (AML) [1] but also has important prognostic implications. For example, NPM1 mutation without positive FLT3-ITD is a good prognostic factor in cytogenetically normal AML (CN-AML) [2,3], while the latter is a poor prognostic factor [4]. DNMT3A and TP53 mutations are both negative prognostic factors in AML [5,6]. Double CEBPA mutation is associated with favorable prognosis in CN-AML patients [7].
MicroRNAs (miRNAs) are short noncoding RNAs that regulate genes post-transcriptionally and play an important role in various physiological and developmental processes such as cell proliferation and differentiation, development, and apoptosis, all of which are frequently affected in cancer [8,9]. Growing number of studies are demonstrating that the dysregulation of miRNAs is associated with the development and progression of many cancers including leukemia, and may provide useful prognostic information [10-13]. For instance, higher levels of miR-155 and lower levels of miR-181a are independently associated with shorter survival in CN-AML patients [14]. MiR-29a and miR-29b can induce apoptosis in AML by targeting apoptosis gene MCL-1 [15]. MiR-9 and miR-196b play essential oncogenic roles in mixed lineage leukemia-rearranged AML [16]. High miR-99a expression and low miR-215 expression are associated with worse clinical outcome in AML [17,18].
MiR-98 belongs to the let-7 families that have been shown to be down-regulated in high-risk ovarian cancer, lung cancer, melanoma and other solid tumors [19-22]. Previous study found that let-7b and let-7c were tumor suppressors and would be down-regulated in AML with t(8;21) or inv(16) [23]. Here, we retrospectively studied the association between miR-98 expression and survival in AML patients to help elucidating its clinical and prognostic implications.
Materials and Methods
Patients
A total of 164 AML patients with miR-98 expression data were identified in The Cancer Genome Atlas (TCGA) database (https://cancergenome.nih.gov/) and enrolled in this study [24]. Ninety patients were treated with chemotherapy alone, and other 74 also received allogeneic hematopoietic stem cell transplant (allo-HSCT). All clinical and molecular information including miR-98 expression levels were publicly accessible from the TCGA website. All patients provided written informed consent; the research was approved by the Human Research Ethics Committee of Washington University. Primary endpoints were event-free survival (EFS) and overall survival (OS). EFS was defined as the time from diagnosis to removal from the study due to the absence of complete remission, relapse or death or was censored at the last follow-up. OS was defined as the time from diagnosis to death or was censored at the last follow-up.
Statistical Analysis
All statistical analyses were performed by SPSS software 20.0 and GraphPad Prism software 5.0. The clinical and molecular characteristics of patients were summarized using descriptive statistics. The Mann-Whitney U test and the chi-square test were used to compare continuous and categorical data between the two groups, respectively. The EFS and OS rates were estimated using the Kaplan-Meier method and compared using the log-rank test. Cox proportional hazard models were constructed for uni- and multivariate analyses to identify the association between each clinical and molecular variable and survival. For all statistical analyses, P values were two-sided and P < 0.05 was considered significant.
Results
Associations between miR-98 expression and clinical and molecular characteristics of patients
Patients were divided into two groups based on the treatment they received chemotherapy group and allo-HSCT group. Each group was then divided into two groups by the median expression level of miR-98. The clinical and molecular characteristics of each group were detailed in Table 1.
Clinical and molecular characteristics of patients in different treatment groups
| Characteristics | Chemotherapy group | Allo-HSCT group | |||||
|---|---|---|---|---|---|---|---|
| High miR-98 (n = 45) | Low miR-98 (n = 45) | P | High miR-98 (n = 37) | Low miR-98 (n = 37) | P | ||
| Age/years, median (range) | 66 (22-88) | 67 (31-83) | 0.781* | 45 (18-72) | 56 (21-69) | 0.043* | |
| Age group/n (%) | 0.822§ | 0.116§ | |||||
| < 60 years | 14 (31.1) | 15 (33.3) | 30 (81.1) | 24 (64.9) | |||
| ≥ 60 years | 31 (68.9) | 30 (66.7) | 7 (18.9) | 13 (35.1) | |||
| Gender/n (%) | 0.396§ | 0.159§ | |||||
| Male | 27 (60.0) | 23 (51.1) | 24 (64.9) | 18 (48.6) | |||
| Female | 18 (40.0) | 22 (48.9) | 13 (35.1) | 19 (51.4) | |||
| WBC/×109/L, median (range) | 14 (1.0-131.5) | 36 (0.7-298.4) | 0.062* | 29.4(1.2-223.8) | 29.4(0.6-202.7) | 0.510* | |
| BM blast/%, median (range) | 69 (30-91) | 76 (32-99) | 0.048* | 71 (30-99) | 75 (35-100) | 0.210* | |
| PB blast/%, median (range) | 25 (0-97) | 46 (0-98) | 0.508* | 48.5 (0-94) | 45 (0-96) | 0.699* | |
| FAB subtypes/n (%) | |||||||
| M0 | 2 (4.4) | 6 (13.3) | 0.266§ | 3 (8.1) | 6 (16.2) | 0.479§ | |
| M1 | 11 (24.4) | 9 (20.0) | 0.612§ | 11 (29.7) | 12 (32.4) | 0.802§ | |
| M2 | 14 (31.1) | 7 (15.6) | 0.081§ | 10 (27.0) | 9 (24.3) | 0.790§ | |
| M3 | 0 (0.0) | 0 (0.0) | 1 (2.7) | 1 (2.7) | 1.000§ | ||
| M4 | 12 (26.7) | 12 (26.7) | 1.000§ | 9 (24.3) | 5 (13.5) | 0.235§ | |
| M5 | 5 (11.1) | 8 (17.6) | 0.368§ | 1 (2.7) | 3 (8.1) | 0.615§ | |
| M6 | 1 (2.2) | 1 (2.2) | 1.000§ | 1 (2.7) | 0 (0.0) | 1.000§ | |
| M7 | 0 (0.0) | 2 (4.4) | 0.494§ | 1 (2.7) | 1 (2.7) | 1.000§ | |
| Karyotype/n (%) | |||||||
| Normal | 18 (40.0) | 26 (57.8) | 0.092§ | 11 (29.7) | 23 (62.2) | 0.005§ | |
| Complex | 7 (15.6) | 5 (11.1) | 0.535§ | 7 (18.9) | 5 (13.5) | 0.528§ | |
| 8 Trisomy | 0 (0.0) | 0 (0.0) | 3 (8.1) | 3 (8.1) | 1.000§ | ||
| inv(16)/CBFβ-MYH11 | 6 (13.3) | 1 (2.2) | 0.110§ | 5 (13.5) | 0 (0.0) | 0.054§ | |
| 11q23/MLL | 3 (6.7) | 0 (0.0) | 2 (5.4) | 1 (2.7) | 1.000§ | ||
| -7/7q- | 0 (0.0) | 3 (6.7) | 0.242§ | 2 (5.4) | 1 (2.7) | 1.000§ | |
| t(15;17)/PML-RARA | 0 (0.0) | 0 (0.0) | 1 (2.7) | 1 (2.7) | 1.000§ | ||
| t(9;22)/BCR-ABL1 | 1 (2.2) | 0 (0.0) | 1.000§ | 2 (5.4) | 0 (0.0) | 0.493§ | |
| t(8;21)/RUNX1-RUNX1T1 | 6 (13.3) | 0 (0.0) | 0.026§ | 0 (0.0) | 1 (2.7) | 1.000§ | |
| Others | 4 (8.9) | 10 (22.2) | 0.144§ | 4 (10.8) | 2 (5.4) | 0.674§ | |
| Risk/n (%) | |||||||
| Good | 12 (26.7) | 1 (2.3) | 0.002§ | 6 (16.7) | 2 (5.4) | 0.261§ | |
| Intermediate | 19 (42.2) | 31 (72.1) | 0.011§ | 14 (38.9) | 27 (73.0) | 0.002§ | |
| Poor | 14 (31.1) | 11 (25.6) | 0.480§ | 16 (44.4) | 8 (21.6) | 0.047§ | |
| FLT3-ITD/n (%) | 0.270§ | 0.782§ | |||||
| Positive | 6 (13.3) | 10 (22.2) | 8 (21.6) | 9 (24.3) | |||
| Negative | 39 (86.7) | 35 (77.8) | 29 (78.4) | 28 (75.7) | |||
| NPM1/n (%) | 0.001§ | 0.000§ | |||||
| Mutation | 7 (15.6) | 22 (48.9) | 1 (2.7) | 19 (51.4) | |||
| Wildtype | 38 (84.4) | 23 (51.1) | 36 (97.3) | 18 (48.6) | |||
| CEBPA/n (%) | 0.557§ | 0.305§ | |||||
| Single mutation | 2 (4.4) | 1 (2.2) | 4 (10.8) | 1 (2.7) | |||
| Double mutation | 0 (0.0) | 0 (0.0) | 2 (5.4) | 1 (2.7) | |||
| Wild type | 43 (95.6) | 44 (97.8) | 31 (83.8) | 35 (94.6) | |||
| DNMT3A/n (%) | 0.002§ | 0.007§ | |||||
| Mutation | 6 (13.3) | 19 (42.2) | 4 (10.8) | 14 (37.8) | |||
| Wildtype | 39 (86.7) | 26 (57.8) | 33 (89.2) | 23 (62.2) | |||
| IDH1/IDH2/n (%) | 0.098§ | 0.104§ | |||||
| Mutation | 11 (24.4) | 5 (11.1) | 6 (16.2) | 12 (32.4) | |||
| Wildtype | 34 (75.6) | 40 (88.9) | 31 (83.8) | 25 (67.6) | |||
| RUNX1/n (%) | 1.000§ | 1.000§ | |||||
| Mutation | 4 (8.9) | 4 (8.9) | 4 (10.8) | 4 (10.8) | |||
| Wildtype | 41 (91.1) | 41 (91.1) | 33 (89.2) | 33 (89.2) | |||
| MLL-PTD/n (%) | 1.000§ | 0.615§ | |||||
| Presence | 3 (6.7) | 2 (4.4) | 3 (8.1) | 1 (2.7) | |||
| Absence | 42 (93.3) | 43 (95.6) | 34 (91.9) | 36 (97.3) | |||
| NRAS/KRAS/n (%) | 0.345§ | 0.430§ | |||||
| Mutation | 8 (18.2) | 5 (11.1) | 2 (5.4) | 5 (13.5) | |||
| Wildtype | 36 (81.8) | 40 (88.9) | 35 (94.6) | 32 (86.5) | |||
| TET2/n (%) | 1.000§ | 1.000§ | |||||
| Mutation | 6 (13.3) | 6 (13.3) | 2 (5.4) | 2 (5.4) | |||
| Wildtype | 39 (86.7) | 39 (86.7) | 35 (94.6) | 35 (94.6) | |||
| TP53/n (%) | 0.748§ | 1.000§ | |||||
| Mutation | 6 (13.3) | 5 (11.1) | 2 (5.4) | 2 (5.4) | |||
| Wildtype | 39 (86.7) | 40 (88.9) | 35 (94.6) | 35 (94.6) | |||
| Relapse/n (%) | 0.078§ | 1.000§ | |||||
| Yes | 12 (26.7) | 20 (44.4) | 12 (32.4) | 12 (32.4) | |||
| No | 33 (73.3) | 25 (55.6) | 25 (67.6) | 25 (67.6) | |||
Abbreviations: WBC, white blood cell; BM, bone marrow; PB, peripheral blood; FAB, French American British. '*' denotes Mann-Whitney U test; '§' denotes chi-square test.
In the chemotherapy group, high miR-98 expressers had lower percentages of bone marrow (BM) blasts (P = 0.048), more good-risk patients (P = 0.002) and fewer intermediate-risk patients (P = 0.011) than low expressers. Six patients among the high expressers harbored RUNX1-RUNX1T, whereas it was not found in low expressers (P = 0.026). High expressers had less in NPM1 (P = 0.001) and DNMT3A (P = 0.002) mutations. No significant differences were found in age, gender distribution, WBC counts, peripheral blood (PB) blasts, French-American-British (FAB) classification, frequency of other recurrent genetic mutations (FLT3-ITD, CEBPA, IDH1/IDH2, RUNX1, MLL-PTD, TP53, NRAS/KRAS and TET2) and relapse rate between high and low miR-98 expression groups.
In the allo-HSCT group, high miR-98 expressers had younger (P = 0.043), more poor-risk (P = 0.047), and fewer intermediate-risk patients (P = 0.002) than low expressers. High expressers had less NPM1 (P < 0.001) and DNMT3A mutations (P = 0.007). No significant differences were found in gender distribution, BM blasts, FAB classification, karyotypes, frequency of other recurrent genetic mutations (FLT3-ITD, CEBPA, IDH1/IDH2, RUNX1, MLL-PTD, NRAS/KRAS, TET2 and TP53) and relapse rate between high and low miR-98 expression groups.
Survival analysis of chemotherapy and allo-HSCT groups
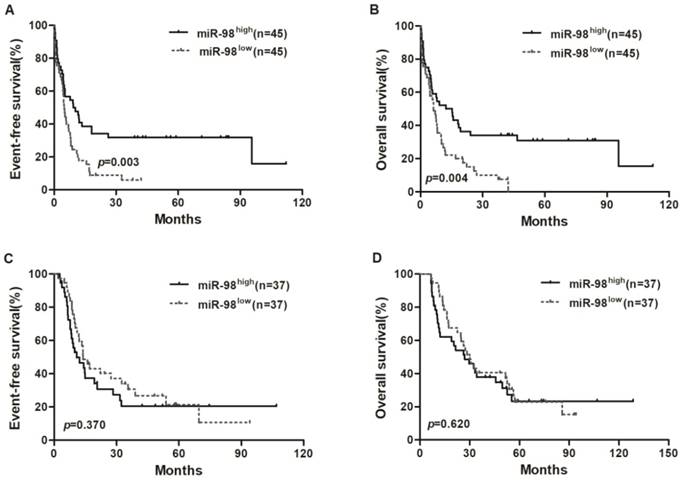
Survival analyses were estimated using the Kaplan-Meier method. In chemotherapy group, high miR-98 expressers had a longer EFS (P = 0.003) and OS (P = 0.004; Figure 1A and 1B) compared with low expressers, but EFS and OS were not significantly different between high miR-98 expression group and low expression group in allo-HSCT group (Figure 1C and 1D).
Kaplan-Meier curves of EFS and OS in chemotherapy group and allo-HSCT group. (A, B) In chemotherapy group, high miR-98 expressers had longer EFS and OS than low expressers. (C, D) EFS and OS were not significantly different between high miR-98 expression group and low expression group in allo-HSCT group.
Prognostic value of miR-98 expression
To assess the prognostic significance of clinical and molecular characteristics, we chose miR-98 expression levels (low vs. high), age (< 60 vs. ≥ 60 years), WBC counts (< 20×109/L vs. ≥ 20×109/L), FLT3-ITD (positive vs. negative) and NPM1 (mutated vs. wild), DNMT3A (mutated vs. wild) to do survival analysis.
In the chemotherapy group, univariate analysis indicated that low miR-98 expression and age ≥ 60 years were unfavorable for both EFS and OS (all P < 0.01). Multivariate analysis showed that low miR-98 expression and age ≥ 60 years were independent risk factors for both EFS and OS (all P < 0.05). WBC counts and other genetic abnormalities (FLT3-ITD, NPM1, DNMT3A) had no significant effect on EFS and OS (Table 2).
Uni- and multivariate analyses for EFS and OS in chemotherapy-only group
| Variables | EFS | OS | |||
|---|---|---|---|---|---|
| HR (95%CI) | P-value | HR (95%CI) | P-value | ||
| Univariate analyses | |||||
| MiR-98 (high vs. low) | 0.516 (0.321-0.829) | 0.006 | 0.522 (0.324-0.841) | 0.008 | |
| Age (< 60 vs. ≥ 60 years) | 3.588 (2.005-6.421) | 0.000 | 3.423 (1.919-6.106) | 0.000 | |
| WBC (< 20 vs. ≥ 20×109/L) | 1.037 (0.655-1.644) | 0.876 | 1.068 (0.674-1.693) | 0.779 | |
| FLT3-ITD (positive vs. negative) | 1.261 (0.703-2.260) | 0.436 | 1.192 (0.665-2.136) | 0.555 | |
| NPM1 (mutated vs. wild type) | 1.120 (0.687-1.827) | 0.649 | 1.044 (0.640-1.704) | 0.862 | |
| DNMT3A (mutated vs. wild type) | 1.407 (0.852-2.322) | 0.182 | 1.432 (0.868-2.362) | 0.160 | |
| Multivariate analyses | |||||
| MiR-98 (high vs. low) | 1.796 (1.041-3.100) | 0.035 | 1.739 (1.005-3.009) | 0.048 | |
| Age (< 60 vs. ≥ 60 years) | 3.681 (2.036-6.657) | 0.000 | 3.411 (1.889-6.158) | 0.000 | |
| WBC (< 20 vs. ≥ 20×109/L) | 1.190 (0.721-1.965) | 0.496 | 1.160 (0.703-1.913) | 0.562 | |
| FLT3-ITD (positive vs. negative) | 0.893 (0.491-1.626) | 0.712 | 1.035 (0.565-1.895) | 0.913 | |
| NPM1 (mutated vs. wild type) | 1.175 (0.647-2.133) | 0.596 | 1.326 (0.726-2.420) | 0.359 | |
| DNMT3A (mutated vs. wild type) | 0.747 (0.423-1.320) | 0.316 | 0.692 (0.399-1.201) | 0.191 | |
Abbreviations: EFS, event-free survival; OS, overall survival; HR, hazard ratio; CI, confidence interval; WBC, white blood cell.
In the allo-HSCT group, univariate and multivariate analyses all indicated that miR-98 had no association with EFS and OS. Other clinical and molecular parameters also had no impact on EFS and OS in this group (Table 3).
Uni- and multivariate analyses for EFS and OS in allo-HSCT group
| Variables | EFS | OS | |||
|---|---|---|---|---|---|
| HR (95%CI) | P-value | HR (95%CI) | P-value | ||
| Univariate analyses | |||||
| MiR-98 (high vs. low) | 1.273 (0.749-2.163) | 0.372 | 1.143 (0.673-1.941) | 0.620 | |
| Age (< 60 vs. ≥ 60 years) | 1.042 (0.581-1.868) | 0.890 | 1.448 (0.807-2.599) | 0.215 | |
| WBC (< 20 vs. ≥ 20×109/L) | 0.754 (0.442-1.285) | 0.299 | 0.985 (0.578-1.680) | 0.956 | |
| FLT3-ITD (positive vs. negative) | 1.719 (0.915-3.229) | 0.092 | 1.588 (0.848-2.972) | 0.148 | |
| NPM1 (mutated vs. wild type) | 0.907 (0.494-1.666) | 0.753 | 0.910 (0.495-1.671) | 0.761 | |
| DNMT3A (mutated vs. wild type) | 1.184 (0.643-2.178) | 0.588 | 1.320 (0.715-2.438) | 0.374 | |
| Multivariate analyses | |||||
| MiR-98 (high vs. low) | 0.818 (0.437-1.533) | 0.531 | 0.740 (0.392-1.400) | 0.355 | |
| Age (< 60 vs. ≥ 60 years) | 1.193 (0.637-2.232) | 0.581 | 1.531 (0.820-2.860) | 0.181 | |
| WBC (< 20 vs. ≥ 20×109/L) | 1.372 (0.767-2.454) | 0.286 | 1.075 (0.605-1.907) | 0.806 | |
| FLT3-ITD (positive vs. negative) | 0.529 (0.260-1.075) | 0.078 | 0.559 (0.274-1.139) | 0.109 | |
| NPM1 (mutated vs. wild type) | 1.351 (0.630-2.896) | 0.439 | 1.240 (0.579-2.654) | 0.580 | |
| DNMT3A (mutated vs. wild type) | 0.785 (0.410-1.506) | 0.467 | 0.646 (0.333-1.255) | 0.197 | |
Abbreviations: EFS, event-free survival; OS, overall survival; Allo-HSCT, allogeneic hematopoietic stem cell transplantation; HR, hazard ratio; CI, confidence interval; WBC, white blood cell.
In all patients, multivariate analysis indicated that allo-HSCT and age < 60 years were independent favorable factors for both EFS and OS (all P < 0.05) (Table 4).
Multivariate analyses for EFS and OS based on all patients
| Variables | EFS | OS | |||
|---|---|---|---|---|---|
| HR (95%CI) | P-value | HR (95%CI) | P-value | ||
| MiR-98 (high vs. low) | 1.405 (0.945-2.089) | 0.093 | 1.465 (0.979-2.192) | 0.064 | |
| Age (< 60 vs. ≥ 60 years) | 2.254 (1.543-3.293) | 0.000 | 2.358 (0.820-2.860) | 0.000 | |
| WBC (< 20 vs. ≥ 20×109/L) | 1.349 (0.927-1.963) | 0.118 | 1.177 (0.811-1.709) | 0.391 | |
| FLT3-ITD (positive vs. negative) | 0.781 (0.502-1.215) | 0.273 | 0.886 (0.565-1.389) | 0.597 | |
| NPM1 (mutated v wild type) | 1.240 (0.788-1.952) | 0.352 | 1.327 (0.840-2.098) | 0.226 | |
| DNMT3A (mutated v wild type) | 0.731 (0.484-1.103) | 0.136 | 0.685 (0.455-1.031) | 0.070 | |
| Chemotherapy vs. allo-HSCT | 1.459 (1.015-2.097) | 0.041 | 1.765 (1.219-2.556) | 0.003 | |
Abbreviations: EFS, event-free survival; OS, overall survival; HR, hazard ratio; CI, confidence interval; WBC, white blood cell; Allo-HSCT, allogeneic hematopoietic stem cell transplantation.
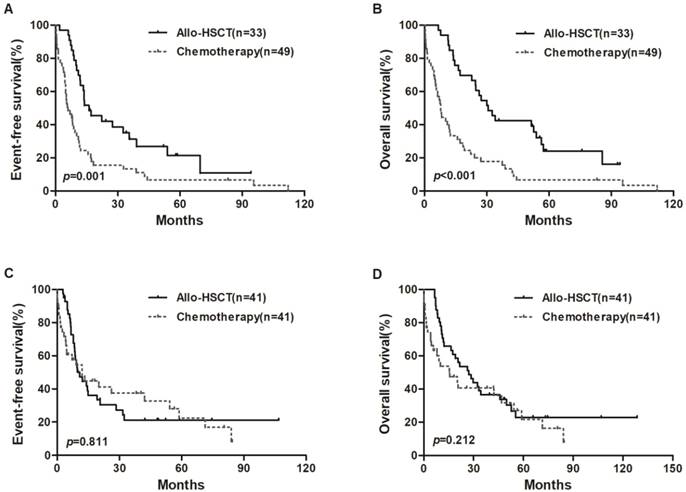
We also divided all patients into two groups based on median expression level of miR-98. In the low miR-98 expressers, allo-HSCT treatment were associated with longer EFS and OS than chemotherapy-alone (P = 0.001, P < 0.001, respectively; Figure 2A and 2B), but EFS and OS were not significantly different in high miR-98 expressers (Figure 2C and 2D).
Kaplan-Meier curves of EFS and OS in high and low miR-98 expression groups. (A, B) In low expression group, patients treated with allo-HSCT had longer EFS and OS than those treated with chemotherapy-only. (C, D) No significant survival differences were found between chemotherapy group and allo-HSCT group in high miR-98 expressors.
Associations between genome-wide miRNA and gene-expression profiles and miR-98 expression
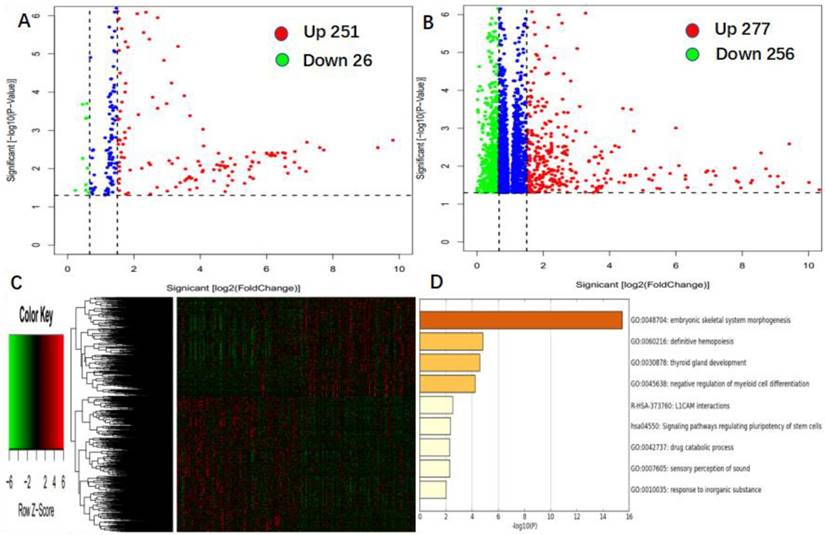
To further assess the role of miR-98 in AML, we derived miR-98-associated miRNA and gene expression profiles by high throughput sequencing from TCGA data. First, we found 251 up-regulated and 26 down-regulated miRNAs that were significantly associated with miR-98 expression (P < 0.05, fold change = 1.5, Figure 3A). Second, we identified 277 genes were positively correlated with miR-98 expression, and 256 genes were negatively correlated with miR-98 expression (P < 0.05, fold change = 1.5, Figure 3B). These genes were presented in the aberrant expression heat map (Figure 3C). Further gene ontology (GO) enrichment analysis indicated that the genes associated with miR-98 expression were mainly involved in "embryonic skeletal system morphogenesis", "definitive hemopoiesis", "thyroid gland development", "negative regulation of myeloid cell differentiation", "L1CAM interactions", "signaling pathways regulating pluripotency of stem cells", "drug catabolic process", "sensory perception of sound", and "response to inorganic substance" pathways. (Figure 3D).
Genome-wide gene/microRNA expression profile and cell signaling pathways associated with miR-98 expression. (A) Volcano plot of differential microRNA expression. miR-98high and miR-98low were marked by red and green circles, respectively. (B) Volcano plot of differential gene expression. miR-98high and miR-98low were marked by red and green circles, respectively. (C) Expression heatmap of associated with miR-98 expression. (D) Gene ontology (GO) enrichment analysis of genes related to miR-98 expression.
Discussion
Our study found that high miR-98 expression was more likely to occur in younger and good-risk patients, and more RUNX1-RUNX1T fusion was seen in high miR-98 expression group, suggesting that high miR-98 expression tend to coincide with good-risk AML and may have similar prognostic value as RUNX1-RUNX1T.
In the chemotherapy group, multivariate analysis had proved that low miR-98 expression and age ≥ 60 were independent adverse factors. But in the allo-HSCT group, univariate and multivariate analysis all showed no effect of miR-98 expression on EFS and OS, and in the entire cohort, the low miR-98 expressors who underwent allo-HSCT had longer EFS and OS. In all patients, multivariate analysis indicated that allo-HSCT was independent favorable factor for both EFS and OS. Thus, we speculated that the unfavorable influence of low miR-98 expression might be overcome by allo-HSCT.
The mechanisms of miR-98 in anti-tumorigenesis have been investigated. MiR-98 could suppress breast cancer angiogenesis and invasion by repressing the expression of ALK4 and MMP11 [25]. MiR-98 could also suppress the growth and metastasis of salivary adenoid cystic carcinomas by inhibiting the oncogene NRAS via the regulation of the RAS/MAPK/ERK and PI3K/AKT pathways [26] and suppress cell invasion and migration in glioma by directly targeting Pre-B Cell Leukemia Homeobox 3 [27]. It targeted SALL4 to inhibit proliferation, migration, and invasion of hepatocellular carcinoma [28]. It inhibited melanoma metastasis via inhibiting IL-6 signaling pathway [22]. Mir-98 could negative regulate the expression of tumor suppressor gene FUS1b in lung cancers [29]. In leukemia, it was found that miR-98 upregulation could improve chemotherapy-sensitivity and decrease leukemia cell proliferation by inhibiting E2F1 expression [30]. In the present study, miR-98 is associated with "definitive hemopoiesis", "negative regulation of myeloid cell differentiation", "signaling pathways regulating pluripotency of stem cells", and they play an important role in hematopoiesis, which suggests that miR-98 may play a prognostic role in leukemia by interacting with genes involved in these functional pathways. The detailed mechanism of miR-98 in AML leukemogenesis, however, should require further study.
In summary, we found that high miR-98 expression was a good prognostic factor in AML patients who only received chemotherapy. Patients with low miR-98 expression may benefit from allo-HSCT.
Acknowledgements
This work was supported by grants from the National Natural Science Foundation of China (81500118, 61501519), the China Postdoctoral Science Foundation funded project (project No.2016M600443).
Competing Interests
The authors have declared that no competing interest exists.
References
1. Prada-Arismendy J, Arroyave JC, Röthlisberger S. Molecular Biomarkers in Acute Myeloid Leukemia. Blood. 2017;31(1):63-76
2. Döhner K, Schlenk RF, Habdank M, Scholl C, Rücker FG, Corbacioglu A. et al. Mutant nucleophosmin (NPM1) predicts favorable prognosis in younger adults with acute myeloid leukemia and normal cytogenetics: interaction with other gene mutations. Blood. 2005;106(12):3740-3746
3. Thiede C, Koch S, Creutzig E, Steudel C, Illmer T, Schaich M. et al. Prevalence and prognostic impact of NPM1 mutations in 1485 adult patients with acute myeloid leukemia (AML). Blood. 2006;107(10):4011-4020
4. Santos FP, Jones D, Qiao W. et al. Prognostic value of FLT3 mutations among different cytogenetic subgroups in acute myeloid leukemia. Cancer. 2011;117:2145-2155
5. Lin N, Fu W, Zhao C, Li B, Yan X, Li Y. Biologico-clinical significance of DNMT3A variants expression in acute myeloid leukemia. Biochem Biophys Res Commun. 2017;494:270-277
6. Stengel A, Kern W, Haferlach T, Meggendorfer M, Fasan A, Haferlach C. The impact of TP53 mutations and TP53 deletions on survival varies between AML, ALL, MDS and CLL: an analysis of 3307 cases. Leukemia. 2017;31(3):705-711
7. Dufour A, Schneider F, Metzeler K. et al. Acute myeloid leukemia with biallelic CEBPA gene mutations and normal karyotype represents a distinct genetic entity associated with a favorable clinical outcome. J Clin Oncol. 2010;28(4):570-577
8. Law P T, Wong N. Emerging roles of microRNA in the intracellular signaling networks of hepatocellular carcinoma[J]. J Gastroenterol Hepatol. 2011;26(3):437-449
9. Kawaguchi T, Komatsu S, Ichikawa D. et al. Circulating MicroRNAs: A Next-Generation Clinical Biomarker for Digestive System Cancers. International Journal of Molecular Sciences. 2016;17(9):1459-1474
10. Marcucci G, Mro´zek K, Radmacher MD. et al. The prognostic and functional role of microRNAs in acute myeloid leukemia. Blood. 2011;117:1121-1129
11. Marcucci G, Radmacher MD, Maharry K, Mrózek K, Ruppert AS, Paschka P. et al. MicroRNA expression in cytogenetically normal acute myeloid leukemia. N Engl J Med. 2008;358:1919-28
12. Garzon R, Croce CM. MicroRNAs in normal and malignant hematopoiesis. Curr Opin Hematol. 2008;15(4):352-358
13. Garzon R, Volinia S, Liu CG, Fernandez-Cymering C, Palumbo T. et al. MicroRNA signatures associated with cytogenetics and prognosis in acute myeloid leukemia. Blood. 2008;111(6):3183-3189
14. Marcucci G, Maharry KS, Metzeler KH, Volinia S. et al. Clinical Role of microRNAs in Cytogenetically Normal Acute Myeloid Leukemia: miR-155 Upregulation Independently Identifies High-Risk Patients. Journal of Clinical Oncology. 2013;31(17):2086-2093
15. Garzon R, Heaphy CE, Havelange V, Fabbri M, Volinia S. et al. MicroRNA 29b functions in acute myeloid leukemia. Blood. 2009;114(26):5331-5341
16. Chen P, Price C, Li Z, Li Y, Cao D. et al. miR-9 is an essential oncogenic microRNA specifically overexpressed in mixed lineage leukemia-rearranged leukemia. Proceedings of the National Academy of Sciences. 2013;110(28):11511-11516
17. Cheng Z, Zhou L, Hu K. et al. Prognostic significance of microRNA-99a in acute myeloid leukemia patients undergoing allogeneic hematopoietic stem cell transplantation. Bone Marrow Transplant. 2018;53(9):1089-1095
18. Wang YX, Zhang TJ, Yang DQ. et al. Reduced miR-215 expression predicts poor prognosis in patients with acute myeloid leukemia. Japanese Journal of Clinical Oncology. 2016;46(4):350-356
19. Wendler A, Keller D, Albrecht C, Peluso JJ, Wehling M. et al. Involvement of let-7/miR-98 microRNAs in the regulation of progesterone receptor membrane component 1 expression in ovarian cancer cells. Oncol Rep. 2011;25(1):273-279
20. Xiang Q, Tang H, Yu J, Yin J, Yang X. et al. MicroRNA-98 sensitizes cisplatin-resistant human lung adenocarcinoma cells by up-regulation of HMGA2. Pharmazie. 2013;68(4):274-281
21. Yanaihara N, Caplen N, Bowman E. et al. Unique microRNA molecular profiles in lung cancer diagnosis and prognosis. Cancer Cell. 2006;9:189-198
22. Li F, Li XJ, Qiao L, Shi F, Liu W, Li Y, Dang YP, Gu WJ. et al. miR-98 suppresses melanoma metastasis through a negative feedback loop with its target gene IL-6. Experimental & Molecular Medicine. 2014;46(10):116-125
23. Jongen-Lavrencic M, Sun SM, Dijkstra M. et al. MicroRNA expression profiling in relation to the genetic heterogeneity of acute myeloid leukemia. Blood. 2008;111:5078-5085
24. Ley TJ, Miller C, Ding L, Raphael BJ, Mungall AJ, Robertson A. et al. Genomic and epigenomic landscapes of adult de novo acute myeloid leukemia. N Engl J Med. 2013;368:2059-2074
25. Siragam V, Rutnam ZJ, Yang W, Fang L, Luo L, Yang X. et al. MicroRNA miR-98 inhibits tumor angiogenesis and invasion by targeting activin receptor-like kinase-4 and matrix metalloproteinase-11. Oncotarget. 2012;3(11):1370-1385
26. Liu X, Zhang W, Guo H, Yue J, Zhuo S. miR-98 functions as a tumor suppressor in salivary adenoid cystic carcinomas. Onco Targets Ther. 2016;9:1777-1786
27. Xu X, Bao Z, Liu Y, Ji J, Liu N. MicroRNA-98 Attenuates Cell Migration and Invasion in Glioma by Directly Targeting Pre-B Cell Leukemia Homeobox 3. Cell Mol Neurobiol. 2017;37(8):1359-1371
28. Zhou W, Zou B, Liu L, Cui K, Gao J. et al. MicroRNA-98 acts as a tumor suppressor in hepatocellular carcinoma viatargeting SALL4. Oncotarget. 2016;7(45):74059-74073
29. Liqin Du, Jeoffrey J. Schageman, Maria C. Subauste, et al. miR-93, miR-98 and miR-197 regulate expression of tumor suppressor gene FUS1. Mol Cancer Res. 2009;7(8):1234-1243
30. Huang Y, Hong X, Hu J, Lu Q. Targeted regulation of MiR-98 on E2F1 increases chemosensitivity of leukemia cells K562/A02. Onco Targets Ther. 2017;10:3233-3239
Author contact
![]() Corresponding author: Lin Fu, MD. PhD. Department of Hematology and Lymphoma Research Center, Peking University, Third Hospital, Beijing, 100191, China. E-mail: fulin022com, Tel: +86-10-82267650, Fax: +86-10-82267650. Jinlong Shi, PhD. Department of Biomedical Engineering, Chinese PLA General Hospital, Beijing, 100853, China. E-mail: jinlong_301com, Tel: +86-10-66936921, Fax: +86-10-66936921.
Corresponding author: Lin Fu, MD. PhD. Department of Hematology and Lymphoma Research Center, Peking University, Third Hospital, Beijing, 100191, China. E-mail: fulin022com, Tel: +86-10-82267650, Fax: +86-10-82267650. Jinlong Shi, PhD. Department of Biomedical Engineering, Chinese PLA General Hospital, Beijing, 100853, China. E-mail: jinlong_301com, Tel: +86-10-66936921, Fax: +86-10-66936921.