3.2
Impact Factor
ISSN: 1837-9664
J Cancer 2018; 9(24):4696-4705. doi:10.7150/jca.27329 This issue Cite
Research Paper
Revealing Different Lung Metastatic Potentials Induced Metabolic Alterations of Hepatocellular Carcinoma Cells via Proton Nuclear Magnetic Resonance Spectroscopy
1. Department of Laboratory Medicine, Fujian Medical University, Fuzhou, China
2. Department of Electronic Science, Fujian Provincial Key Laboratory of Plasma and Magnetic Resonance, Xiamen University, Xiamen, China
3. The United Innovation of Mengchao Hepatobiliary Technology Key Laboratory of Fujian Province, Mengchao Hepatobiliary Hospital of Fujian Medical University, Fuzhou, China
Received 2018-5-17; Accepted 2018-9-9; Published 2018-11-24
Abstract
Background: Hepatocellular carcinoma (HCC) causes death mainly by disseminated metastasis progression and major challenge of clinical management is to distinguish lethal metastatic stage from indolent stage. It is shown that metastatic progression is closely related to cellular metabolism. But detailed metabolic alterations and molecular mechanisms still kept unclear between subtypes of different lung metastatic potentials.
Methods: The current work used NMR-based metabolomics in the study of HCC cells with high malignancy but differed in lung metastatic potentials. Cell extracts and cultured media from MHCC97L and MHCC97H were utilized to reveal metabolic alterations related to metastatic potentials. Multivariate analyses were performed to identify characteristic metabolites which were used subsequently to draw the map of relative biochemical pathways by combining KEGG database.
Results: The NMR spectra of both MHCC97L and MHCC97H include various signals from necessary nutritional components and metabolic intermediates. A series of characteristic metabolites were determined from both cell extracts and media. The ability on nutrient uptake varied from cell lines. Most of amino acids decreased in high metastatic cell line, so altered amino acid metabolisms and energy metabolism were revealed in high metastatic MHCC97H cell line. The majority pathways involved six essential amino acids in which the observed branched-chain amino acids together with lysine contributed to biosynthesis or degradation. Basically MHCC97H cell line could induce more active events than that of MHCC97L to progress to high metastasis with certain molecular events. Characteristic metabolites-derived classifiers performed robustly during prediction and confirmed their critical role in supporting metastasis progression.
Conclusions: Our results provide evidence that NMR-metabolomics analyses of cells are able to understand metastatic characteristics accountable for biological properties. The proposed characteristic metabolites will help to understand HCC metastatic characterizations and may be filtered as potential biomarkers.
Keywords: hepatocellular carcinoma, metastatic potential, metabolic profiling, nuclear magnetic resonance spectroscopy, cell, pathway analysis
Introduction
Human hepatocellular carcinoma (HCC), with the third highest mortality, is one of the most common malignant tumors in the world. Even though more than half of HCC cases come from China, a dramatically increasing incidence of HCC has recently been reported in developed countries like America, England, France, and Japan [1]. As an aggressive tumor, most deaths caused by HCC are mainly disseminated metastasis progression from confined organ [2]. Clinical metastasis is a pivotal prognostic factor and will significantly shorten the survival rate and long-term prognosis of HCC patients. Major challenge of clinical management is to distinguish lethal metastatic stage from indolent stage [3, 4]. Researches have shown that metastatic progression is closely related to cellular metabolism [5], but detailed metabolic changes and molecular mechanisms still kept unclear. Consequently, there is an urgent need to seek biomarkers from cell level for possible in vivo diagnosis of HCC. Metabolomic platform allows the analysis of cell metabolome that is defined as all the low molecular weight metabolites inside cells with given set of physiological activity. Therefore metabolomic analysis will be very helpful to understand the molecular mechanisms of HCC progression and to exploit biomarkers.
Metabolomic analysis based on NMR spectroscopy has now been applied to various researches on tumor cell lines. In the last decade, NMR spectroscopy has been playing a significant role in this field because of its ability to offer rich molecular information and detect individual species in complex mixtures. For instance, this technology has been successfully used to investigate the differentiation, proliferation and resistant effects in cell models. By NMR-based metabolic profiling, cellular metabolism in a proliferation-arrested cell line is shown to increase productivity via which revealed important metabolic pathways for further detailed studies [6]. Gottschalk et al. applied metabolomic analysis to variants inside cell lines with different levels of resistance or different lung tumor origins. A general demonstration of both whole cells and extracts for the resistant variants were presented [7]. Process of cells differentiation into enterocyte has also been investigated to learn more detailed mechanisms, so that levels of certain metabolites were shown to change dramatically between undifferentiated state and late differentiated states [8]. In addition to discussing the mechanisms for cellular differentiation, proliferation or resistance, some researchers have turned their attention to specific problems arising from preparation of experiment. In NMR experiment, different preparation protocols for cell samples might exert differential metabolite profiling, bringing insights from culture media to cell extracting and harvesting methods [9]. Relative results showed that contaminants in cell extracts under different extract methods appeared in plastic ware. Besides, the metabolic profiling of epithelial ovarian cancer cell lines and multiresistant subline were performed to illustrate the metabolic responses that might result from different cell harvesting strategies [10]. It is interesting that composition of culture media may also affect the metabolic behavior of cells. Huang et al. has proved that morphology and proliferation of cells cultured in different media may be the same, but metabolic profiles were quite different in discrepant metabolites [11]. Therefore, it can be said that the cellular metabolic behaviors and patterns are complex and meanwhile they are sensitive to surrounding environment. Recently, progress in understanding the metabolic differences of cells related to oncogenic transformation and metastatic potential has also been supported by a few researches. Vered et al. demonstrated that RAS-driven physiologic alterations will affect water soluble metabolites and help to distinguish lung epithelial cells with different RAS oncogenic isoforms [12]. The most recent progress was conducted by malignancy-associated cancer cell lines from human and murine models. Metabolic heterogeneity of different degrees of astrocytoma cell lines from glioma tissues was revealed to be associated with malignancy [13]. Santana-Filho et al. applied 2D multiplicity-edited HSQC NMR techniques to obtain fingerprints murine cell lines, including high metastatic melanoma cell line, and relative amounts of altered metabolites were determined [14]. With the observation of metabolic profiling from tumor cells, it could provide a sound reference for exploring characteristic metabolites with respect to high metastatic potential. However, metabolomic profiling of cell lines from different metastatic HCC has not been reported yet, even though the molecular mechanisms of disseminated metastasis progression are crucial to clinical management.
In this work we explored metabolic characteristics of HCC cell lines associated with different lung metastatic potentials. We aimed to understand the molecular mechanisms of metastasis by NMR spectroscopy conjugated with statistical analysis. To the best of our knowledge, this is the first study to explore metabolic profiles of HCC cell lines with low and high metastatic potentials using NMR-based metabolomics analyses.
Materials and Methods
Cell lines and culture condition
Two cell lines, including MHCC97L and MHCC97H were chosen to represent low and high metastatic potential of HCC, respectively. These cell lines were almost similar in malignancy but differed in lung metastatic potentials. They were obtained from Peking Union Medical College Hospital (Beijing, China). These cells were cultured in DMEM (Hyclone, USA) media which was supplemented with 10% fetal bovine serum (Gibco, USA), 100 U/mL penicillin, and 100 μg/mL streptomycin, and then grown in an incubator humidified 5% CO2 atmosphere at 37 ºC. Fresh stock of cells was seeded in 30 identical flasks until the cells entered into logarithmic growth phase. Then cells were harvested by trypsinization with 1 mL of trypsin solution. Cell culture media from each flask was separately collected before harvesting, and every three flasks from same type of cell line were combined as a cell sample in order to enrich cell number for intracellular extraction. Every three samples from the same type of cells were combined as a NMR sample and the quantity of cells is approximately 1×10⁶/mL per NMR sample according to the result of cell count. Finally, the sample amount for each cell line was 10 and 30 from cells and cultured media (CM), respectively.
Sample preparation for NMR spectroscopy
Both media and cell extracts were used for NMR detection. The collected cells were quenched by a direct cell quenching method and intracellular metabolites were extracted using a dual phase extraction procedure [15, 16]. Briefly, mixture of methanol, chloroform and water under volume ratio of 2:2:3 was used to generate a two-phase extract. Aqueous-phase extracts were then dissolved in 500 μL of D2O- prepared phosphate-buffered saline (PBS, pH=7.4). For media samples, 400 μL of the media was mixed with 100 μL of D2O-prepared PBS (pH=7.4) containing 0.05% sodium 3-(trimethylsilyl) propionate-2,2,3,3-d4 (TSP) which was served as reference (δ0.00). Both media and cell samples were oscillated for blending and centrifuged at 10,000 rpm for 10 min at 4 °C to remove insoluble components. The supernatant (500 μL) was transferred to 5 mm NMR tubes for later measurements.
NMR experimentation
The NMR measurements were performed at 298 K on a 500 MHz Varian NMR spectrometer, operating at a 1H frequency of 499.74 MHz. One-dimensional 1H-NMR spectra were obtained using a nuclear Overhauser enhancement spectroscopy pulse sequence (NOESYPR1D) (recycle delay-90º-t1-90º-tm-90º-acquisition) with acquisition time of 2 s. And low-power water signal presaturation was also used during both the 3 s recycle delay and the 100 ms mixing time (tm). The spectral width was 12 ppm with 64 K complex data points and 64 transients.
Data preprocessing and pattern recognition
Free induction decays of all samples were multiplied by a 1.0 Hz line-broadening factor prior to Fourier transformation. All NMR spectra were manually phased and baseline-corrected via MestReNova (version 8.1.2, Mestrelab Research S.L., Spain). The spectra of media and cell extracts were referenced to signals of TSP (δ0.00) and lactate methyl (δ1.33), respectively. The region of δ4.29-6.40 ppm was excluded to remove effects of residual water variation in media and cell extracts, and the region of δ1.40-1.80 ppm was also excluded to remove effects of residual lipid signals in cell extracts. Subsequently, the spectra were divided into 0.002 ppm integral regions and integrated in the region of 0.5-8.5 ppm (for cell extracts) or 0.5-9.0 ppm (for CM). To account for variations in sampling gains used for different samples, the spectra were normalized to the total sum of the spectrum before multivariate statistical analysis.
Principal components analysis (PCA) and orthogonal projection to latent structure with discriminant analysis (OPLS-DA) were carried out using SIMCA-P+ v14.0 (Umetrics, Sweden). Data used in PCA were mean-centered scaled while in OPLS-DA were unit variance scaled. The optimal number of orthogonal components for building OPLS-DA models was selected using cross validation procedure. The goodness of fit and prediction parameters of OPLS-DA models, R2 and Q2 were calculated. Then a correlation coefficient of |r|>0.75 (for cell extracts) or |r|>0.36 (for CM) was used as the cut-off value for determination of discriminatory metabolites, in which those with significance level of P<0.05 according to Student's t-test analysis were considered as characteristic metabolites. A MATLAB-based toolbox was used to draw the map of relative biochemical pathways [17], and the custom sub-networks for HCC cells were created by using main substrate-product pairs as defined by Kyoto encyclopedia of genes and genomes (KEGG) online database. Finally, the associative characteristic metabolites were fed back to identify different cell lines by combining with support vector machines (SVMs) via LIBSVM package [18]. Since only a dozen of metabolites were involved, the SVMs algorithm proposed by Vapnik was very suitable for such small-sample problems [19]. Automatic optimization parameters together with leave-one-out cross validation were performed to predict unknown samples and evaluate the reliability.
Results
Metabolic profiling of HCC cells with different lung metastatic potentials
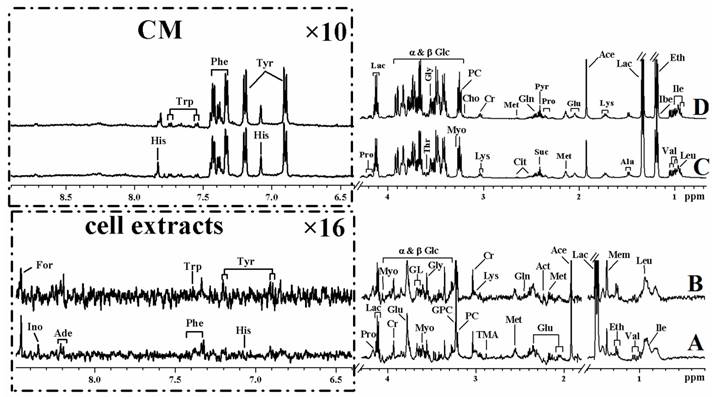
The cell lines involved in the present study provided metastasis characteristics of HCC in different metastatic stages. As shown in Figure 1, the appearances of cell extract spectra were broadly similar for MHCC97L and MHCC97H cell lines, and so were the media samples. Tentative assignments which were consistent with existing literatures and further confirmed by public HMDB database were tabulated in Table 1 [20-23]. Various signals were assigned to individual metabolites and allowed the assessment of relative averaged concentration.
Assignments and splitting patterns for metabolites identified by 1H NMR analysis of both media and cell extracts.
| Metabolite | Abbr. | 1H Shift (multiplicity) | Sample |
|---|---|---|---|
| Acetate | Ace | 1.92(sa) | Cb, D |
| Acetone | Act | 2.23(s) | C |
| Adenine | Ade | 8.20(s), 8.21(s) | C |
| Alanine | Ala | 1.48(d) | D |
| Choline | Cho | 3.19(s) | D |
| Citrate | Cit | 2.53(d), 2.65(d) | D |
| Creatine | Cr | 3.04(s), 3.93(s) | C, D |
| Ethanol | Eth | 1.18(t), 3.67(q) | C, D |
| Formate | For | 8.46(s) | C |
| α-Glucose | Glc | 3.42(t), 3.54(dd), 3.70(t), 3.74(m), 3.84(m) | C, D |
| β-Glucose | Glc | 3.25(dd), 3.41(t), 3.46(m), 3.49(t), 3.89(dd) | C, D |
| Glutamate | Glu | 2.07(m), 2.11(m), 2.35(m), 3.78(t) | C, D |
| Glutamine | Gln | 2.12(m), 2.45(m), 3.78(t) | C, D |
| Glycerol | GL | 3.54(m), 3.64(m), 3.75(m) | C |
| Glycerophosphocholine | GPC | 3.22(s) | C |
| Glycine | Gly | 3.56(s) | C, D |
| Histidine | His | 7.07(s), 7.79(s) | C, D |
| Inosine | Ino | 8.24(s), 8.35(s) | C |
| Isobutyrate | Ibe | 1.13(d) | D |
| Isoleucine | Ile | 0.93(t), 1.01(d), 1.26(m) | C, D |
| Lactate | Lac | 1.33(d), 4.12(q) | C, D |
| Leucine | Leu | 0.96(t) | C, D |
| Lysine | Lys | 1.46(m), 1.73(m), 1.91(m), 3.01(t), 3.75(m) | C, D |
| Methionine | Met | 2.14(s), 2.65(t) | C, D |
| Methylmalonate | Mem | 1.25(d) | C |
| Myo-Inositol | Myo | 3.27(t), 3.54(dd), 3.61(t), 4.07(t) | C, D |
| Phenylalanine | Phe | 7.33(d), 7.38(t), 7.42(m) | C, D |
| Phosphocholine | PC | 3.21(s) | C, D |
| Proline | Pro | 2.34(m), 3.39(m), 4.18(m) | C, D |
| Pyruvate | Pyr | 2.38(s) | D |
| Succinate | Suc | 2.41(s) | D |
| Threonine | Thr | 1.33(d), 3.59(d), 4.24(m) | D |
| Trimethylamine | TMA | 2.89(s) | C |
| Tryptophan | Trp | 7.29(t), 7.36(s), 7.54(d), 7.74(d) | C, D |
| Tyrosine | Tyr | 6.89(d), 7.19(d) | C, D |
| Valine | Val | 0.99(d), 1.04(d) | C, D |
aMultiplicity: s singlet; d doublet; t triplet; dd doublet of doublets, m multiplet; q quartet
bAbbrevations: C=cell extract; D=cultured DMEM media
In the 1H NMR spectra, the aliphatic regions are dominated by various metabolites, containing numerous resonances from amino acids like isoleucine, leucine, valine, lysine, etc, TCA intermediates such as lactate and others metabolites. The low field region represents chemical shifts of the aromatic nucleoside and ribose signals as well as shows the aromatic amino acids. Moreover, inspection the spectra of cell extract revealed some obvious metabolic differences among the cell lines, and that differences in some metabolites concentrations were linked to major alterations in metabolisms which occur in tumorigenic cells (Figure 1A & Figure 1B). Notably, the compositional changes in CM reflect not only consumption of nutrients but also the physiological function of the cells. The NMR spectra of CM were characterized by various necessary nutritional components including amino acids and glucose for the cellular growth (Figure 1C & Figure 1D). Metabolic end-products and intermediates, such as the intermediates of glycolysis were also observed. However, the spectra of CM exhibited almost similar profiles possibly because both MHCC97L and MHCC97H are high malignancy cell lines despite of different metastatic potentials. Therefore, more precise and detailed information need to be confirmed by further supervised and unsupervised analyses so as to determine differences between these cell types.
Determination of characteristic metabolites for HCC cells
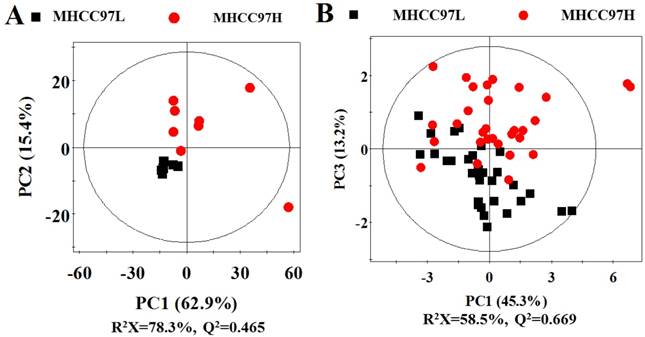
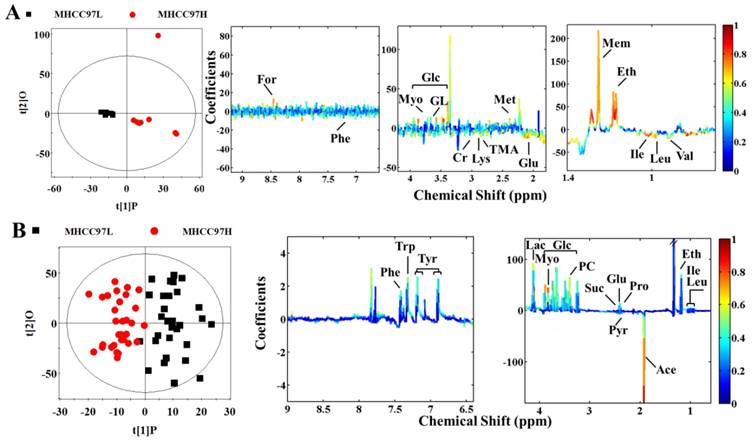
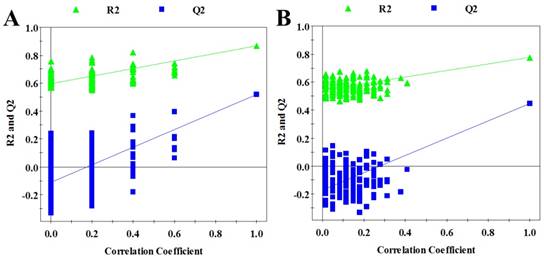
In order to seek possible outliers and determine how well these metabolites correlate with the metastatic potential of HCC cell lines, we carried out PCA on the 1H NMR spectra obtained from the cell extracts and CM. The PCA is based on unsupervised analysis and the scores plot exhibited different trends. Notably, plot (PC1 and PC2) of cell extract showed that there were significant differences between cell lines with low and high metastatic potentials (Figure 2A), while CM samples exhibited slight overlap after incubating with MHCC97L and MHCC97H cell lines (Figure 2B). Even so, some significantly discriminatory metabolites could be identified by supervised analysis from OPLS-DA models (Figure 3). Permutation tests with 200 iterations were then performed to assess the possibility of model over fitting. The obtained results (Figure 4) indicated that the models were reliable and possessed pertinent predictive capability. According to the OPLS-DA scores and corresponding loading plots, a series of discriminating metabolites were identified between MHCC97L and MHCC97H cell lines. Based on these discriminatory metabolites, relative concentrations were calculated by peak integration and then compared by Student's t-test analysis for further determination of characteristic metabolites.
Pathway analysis based on characteristic metabolites
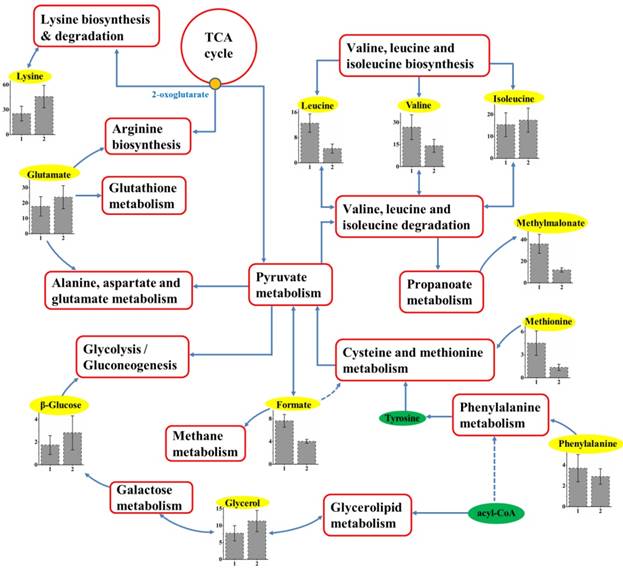
With the help of KEGG online database, the metabolic networks of HCC cell lines with different metastatic potentials could be rationally derived. As shown in Figure 5, based on characteristic metabolites from cell extracts, we summarized metabolic pathways composing the characteristic metabolomic profiles of metastatic behaviors. The majority pathways that were determined to be under-concentrated in HCC metastasis were amino acids, including six essential amino acids (EAAs). Among these EAAs, different concentrations of branched-chain amino acids (BCAAs, including isoleucine, leucine, and valine) were observed and together with lysine contributed to EAAs biosynthesis or degradation.
Classification of HCC cells with different metastatic potentials
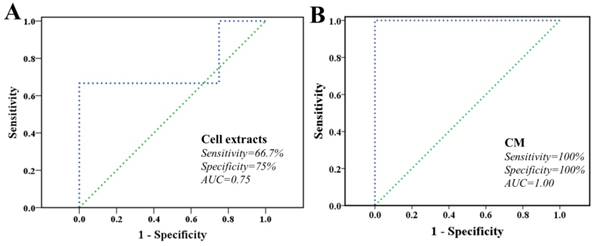
Finally, characteristic metabolites derived from both cell extracts and CM were fed back to explore the ability in classifying these two cell lines via LIBSVM package. The task and type of LIBSVM was support vector classification (SVC) and radial basis function (C_SVC), respectively. Both sides are committed to construct optimal hyper-plane in a higher dimensional space that maximal margin two classes. We randomly extracted 50% samples from each group as training sets and remainders were used as validation sets. As shown in Figure 6, the receiver operating characteristic (ROC) curve determined the overall performances during SVC-based prediction. The area under the curve (AUC) was 0.75 and 0.94 for cell extracts and CM models, respectively, whereas the AUC for a perfect model would be 1.00. The result showed that both models here performed robustly, while CM model performed with better robustness. These proposed models acquired different performance in both sensitivity and specificity.
Discussion
Although both MHCC97L and MHCC97H cells are high metastatic cell lines, MHCC97H exhibits stronger metastatic potential than MHCC97L from physiological aspect. Increased acetate and formate concentrations were observed in low metastatic MHCC97L compared to the high metastatic MHCC97H. It was reported that such observation is possibly due to enhanced lipid metabolism, as demonstrated in human HCC subjects [24]. By supervised and unsupervised analysis, some significantly discriminatory metabolites were identified and how well these metabolites correlate with the metastatic potentials of HCC cells were also determined. As a result, metabolites considered significant (P<0.05) were included in the final list of characteristic metabolites, as shown in Table 2 and Table 3 for cell extracts and CM sample, respectively. These characteristic metabolites were considered to be responsible for alterations due to different metastatic potential.
According to Table 2, most of the amino acids including leucine, methionine, phenylalanine, and valine decreased in MHCC97H cells, revealing some alterations of amino acid metabolisms related to high metastatic potential. On the other hand, it was interesting that the isoleucine level increased in MHCC97H cell line, but the reason remained unclear. We think levels of certain amino acids may infect by transport type and ability from media into cells. There is evidence that transport activity may affect cell growth and proliferation. Hepatoma cells were proved to transport specific amino acids with different velocity [25, 26]. Higher levels of glucose and glutamate revealed higher consumption of glucose through glycolysis in MHCC97H. Some additional characteristic metabolites were also identified, among which lower levels of formate, methylmalonate, and trimethylamine were observed in MHCC97H, suggesting some metabolic differences. Therefore, we assume that lower levels of amino acids may become a common feature for high metastatic potential cell line. Furthermore, metabolites in Table 3 reflected consumption of nutrients or release of products between cells and media. Cells seemed to consume unequal concentrations of glucose and several essential amino acids like leucine, tryptophan, and tyrosine. Meanwhile extensive products such as glutamate, lactate and phosphocholine were released to media. Lower level of glucose in CM of MHCC97H cells than that of MHCC97L cells indicated that more glucose was consumed by energy metabolism to support active growth of cells. It is unsurprising because high metastatic cells are supposed to consume more energy. Notably, as precursor metabolite of choline, phosphocholine has been proved to be elevated in human hepatic tumors [27], and here it was filtered as characteristic metabolites between low and high metastatic cells. Therefore it may demonstrate and further confirm some cellular metabolism alterations related to metastasis. According to earlier discussions above, the ability on nutrient uptake varied from low and high metastatic cells, especially for glucose and amino acids. Thus it is suggestive that altered amino acid metabolisms and energy metabolism would become significant in different metastatic cells and, consequently these characteristic metabolites may be filtered as potential biomarkers of HCC from cell line aspect. Besides, the corresponding biochemical pathways responsible for metastasis features will be helpful to understand the metastatic process of HCC cells.
During the pathway analysis, the BCAAs were involved in anaplerosis, protein synthesis or catabolizing into sources for glucose and lipid production during tumor cell proliferation and growth. The resulting products may infect proteolysis and cell cycle progression related to cancer development or cachexia [28]. According to our previous study, the present result further confirmed their critical role in contribution to HCC metastasis progression [29]. The exploration of phenylalanine metabolism could also be involved in anaplerosis, and together with 2-oxoglutarate from TCA cycle for further conversion to pyruvate [30]. Interestingly, decreased phenylalanine level was observed in MHCC97H compared with that of MHCC97L, indicating that abnormal aromatic amino acid metabolism occurred in MHCC97L. In contrast, others also reported a decreased level in patients with acute hepatitis and this decrease was attributed to low level of biosynthesis precursors [31]. According to these amino acid metabolism features, MHCC97H cells were typically accompanied by BCAAs and EAAs metabolisms and may progress to high metastasis with certain molecular events.
Relative concentrations of cell extract-derived characteristic metabolites.
| Metabolite | MHCC97L | MHCC97H |
|---|---|---|
| Formate | 7.64±1.13a | 4.02±0.34 |
| β-Glucose | 1.74±0.83 | 2.82±1.49 |
| Glutamate | 17.82±6.30 | 23.81±7.53 |
| Glycerol | 7.75±2.24 | 11.36±3.15 |
| Isoleucine | 15.35±5.43 | 17.41±5.50 |
| Leucine | 26.78±8.43 | 14.17±4.39 |
| Lysine | 25.35±8.85 | 45.85±13.52 |
| Methionine | 4.51±1.59 | 1.35±0.41 |
| Methylmalonate | 36.06±8.74 | 12.00±1.98 |
| Phenylalanine | 3.70±1.31 | 2.90±0.75 |
| Trimethylamine | 2.17±0.77 | 0.53±0.17 |
| Valine | 12.54±2.88 | 4.51±1.43 |
a The relative concentrations of metabolites are presented as mean±SE of the integration value of the characteristic resonance of each metabolite
Representative 1H NMR spectra of cell extracts and cultured media from MHCC97L (A and C) and MHCC97H (B and D) cell lines.
Scores plots in PCA analysis for cell extracts and cultured media from MHCC97L versus MHCC97H. A cell extracts; B cultured media.
Scores and loading plots for determination of metabolites in cell extracts and cultured media responsible for the metabolic variations between MHCC97L and MHCC97H cell lines via OPLS-DA analyses. A cell extracts (R2X=69.3%, R2Y=0.868, Q2=0.517, P<0.0001); B cultured media (R2X=42.8%, R2Y=0.777, Q2=0.460, P<0.0001).
Validation plots of the OPLS-DA models, generated from the permutation tests which were randomly permuted 200 times with the first three components. A cell extracts; B cultured media. The green triangle and blue square are R2Y and Q2 standing for explained variance and predictive ability of model, respectively.
Relative concentrations of CM-derived characteristic metabolites.
| Metabolite | MHCC97L | MHCC97H |
|---|---|---|
| α-Glucose | 36.19±0.68a | 34.33±0.41 |
| β-Glucose | 33.27±0.67 | 31.96±0.36 |
| Glutamate | 9.45±0.19 | 9.29±0.10 |
| Lactate | 59.12±1.05 | 52.46±0.47 |
| Leucine | 9.70±0.83 | 9.54±0.09 |
| Phenylalanine | 1.38±0.03 | 1.31±0.02 |
| Phosphocholine | 8.30±0.16 | 8.00±0.09 |
| Succinate | 1.97±0.05 | 1.91±0.03 |
| Tryptophan | 8.76±0.20 | 8.45±0.09 |
| Tyrosine | 1.80±0.05 | 1.73±0.03 |
a The relative concentrations of metabolites are presented as mean±SE of the integration value of the characteristic resonance of each metabolite
Notably, the β-glucose level reflects alteration of energy production. Elevated glucose suggested high consumption of glucose by MHCC97H in response to more active aerobic glycolysis or the Warburg effect [32]. The other mediate, glycerol was up-regulated and also involved in energy metabolism like glycerolipid and galactose metabolisms. In addition, elevated glutamate may suggest alternative sources of carbon and nitrogen, which was in agreement with previous report from HCC tissues [33, 34]. In general, MHCC97H cell line induced more active events than MHCC97L from energy and amino acids metabolisms. Our result confirmed this and further suggested critical role of characteristic metabolites in supporting cellular metastasis progression. Finally, the ROC analysis showed that SVC algorithm based on characteristic metabolites data sets performed robustly. The results emphasized again different biological characterization between low and high metastatic HCC cell lines accountable for metabolomics profiles. Nevertheless, the potential and extend of transforming characteristic metabolites to disease biomarkers still need to be tested in future clinical applications. Further metabolic analysis associated with different metastatic HCC subjects should be necessary for exploring disease-related biomarkers.
Schematic diagram of metabolic pathways associated with metastatic potential. The metabolites in yellow backgrounds are the characteristic metabolites, and the corresponding metabolic pathways are demonstrated in the red box. Relative levels of characteristic metabolites within these pathways are also shown. 1 and 2 stand for cell extracts taken from MHCC97L and MHCC97H, respectively.
Classification of MHCC97L and MHCC97H cells based on characteristic metabolites. A cell extracts; B cultured media. The ROC curve of SVC classifier, as well as the sensitivity, specificity, AUC, and diagnostic reference line are shown.
Conclusions
In summary, NMR-based metabolomic techniques were used to identify the characteristic metabolic profiles from cell extracts and CM of different metastatic HCC cell lines. The NMR spectra of both MHCC97L and MHCC97H exhibited almost similar spectral profiles, including various signals from necessary nutritional components and metabolic intermediates. A series of characteristic metabolites were determined from both cell extracts and CM. Notably, altered amino acid metabolisms and energy metabolism were revealed in high metastatic MHCC97H cell line. The corresponding metabolic pathways confirmed relevance for molecular mechanisms composing characteristic metabolomic profiles of metastatic progression. The BCAAs metabolisms related to amino acids biosynthesis and degradation were involved and the resulting products may infect proteolysis and cell cycle progression during cancer development or cachexia. According to the amino acid metabolism features, MHCC97H cell line was typically accompanied by BCAAs and EAAs metabolisms, so basically MHCC97H cell line could induce more active events than that of MHCC97L to progress to high metastasis. The characteristic metabolites were used to explore the ability in classifying these two cell lines via SVC algorithm. The result showed that all models performed robustly, while CM model performed with better robustness. Our results provide evidence that metabolic analysis of cell extract and media are able to understand metastatic characteristics accountable for biological properties, and will be helpful for the determination of metabolic markers for hepatocellular carcinoma. Consequently the proposed characteristic metabolites may be filtered as metastatic potential biomarkers of HCC from cell aspect.
Abbreviations
AUC, area under the curve; BCAAs, branched-chain amino acids; CM, cultured media; EAAs, essential amino acids; HCC, hepatocellular carcinoma; HMDB, human metabolome database; KEGG, Kyoto encyclopedia of genes and genomes; NMR, nuclear magnetic resonance; NOESYPR1D, nuclear Overhauser enhancement spectroscopy pulse sequence; orthogonal projection to latent structure with discriminant analysis, OPLS-DA; PBS, phosphate-buffered saline; PCA, principal component analysis; ROC, receiver operating characteristic; SVM, support vector machines; SVC, support vector classification. TCA, tricarboxylic acid; TSP, sodium 3-(trimethylsilyl) propionate-2,2,3,3-d4.
Acknowledgements
This work was supported by grants from the National Natural Science Foundation of China (U1605253 and 21327001), the Scientific Research Talent Training Project of Fujian Provincial Health and Family Planning Commission (2018-1-70), the Startup Science Research Foundation for High-level Talents of Fujian Medical University (XRCZX2017031), and the Youth Foundation from College Project of Fujian Medical University (2017XY001).
Authors' contributions
YC, ZC, and JHF conceived the experiment design. YC and NL performed the experiments and analyzed the data. YC and DHL wrote the manuscript. ZC edited the manuscript. All authors read and approved the final manuscript.
Competing Interests
The authors have declared that no competing interest exists.
References
1. El-Serag HB, Rudolph KL. Hepatocellular carcinoma: epidemiology and molecular carcinogenesis. Gastroenterology. 2007;132:2557-76
2. Dhanasekaran R, Limaye A, Cabrera R. Hepatocellular carcinoma: current trends in worldwide epidemiology, risk factors, diagnosis, and therapeutics. Hepat Med. 2012;4:19-37
3. Zhang ZJ, Yang YK, Wu WZ. Bufalin attenuates the stage and metastatic potential of hepatocellular carcinoma in nude mice. J Transl Med. 2014;12:57
4. Li T, Zhao S, Song B, Wei Z, Lu G, Zhou J, Huo T. Effects of transforming growth factor β-1 infected human bone marrow mesenchymal stem cells on high- and low-metastatic potential hepatocellular carcinoma. Eur J Med Res. 2015;20:56
5. Kailavasan M, Rehman I, Reynolds S, Bucur A, Tozer G, Paley M. NMR-based evaluation of the metabolic profile and response to dichloroacetate of human prostate cancer cells. NMR Biomed. 2014;27:610-6
6. Khoo SH, Al-Rubeai M. Metabolic characterization of a hyper-productive state in an antibody producing NS0 myeloma cell line. Metab Eng. 2009;11:199-211
7. Gottschalk M, Ivanova G, Collins DM. et al. Metabolomic studies of human lung carcinoma cell lines using in vitro 1H NMR of whole cells and cellular extracts. NMR Biomed. 2008;21:809-19
8. Lee IJ, Hom K, Bai G, Shapiro M. NMR metabolomic analysis of Caco-2 cell differentiation. J Proteome Res. 2009;8:4104-8
9. Madhu B, Dadulescu M, Griffiths J. Artefacts in 1H NMR-based metabolomic studies on cell cultures. MAGMA. 2015;28:161-71
10. Mikael E, My B, Jakob H. et al. Metabolic profiling of epithelial ovarian cancer cell lines: evaluation of harvesting protocols for profiling using NMR spectroscopy. Bioanalysis. 2015;7:157-66
11. Huang Z, Shao W, Gu J. et al. Effects of culture media on metabolic profiling of the human gastric cancer cell line SGC7901. Mol BioSyst. 2015;11:1832-40
12. Vered M, Anisleidys M, Priyamvada R, Walls JD. 1H NMR studies distinguish the water soluble metabolomic profiles of untransformed and RAS-transformed cells. PeerJ. 2016;4:e2104
13. Shao W, Gu J, Huang C. et al. Malignancy-associated metabolic profiling of human glioma cell lines using 1H NMR spectroscopy. Mol Cancer. 2014;13:197-208
14. Santana-Filho AP, Jacomasso T, Riter DS. et al. NMR metabolic fingerprints of murine melanocyte and melanoma cell lines: application to biomarker discovery. Sci Rep. 2017;7:42324
15. Teng Q, Huang W, Collette T, Ekman D, Tan C. A direct cell quenching method for cell-culture based metabolomics. Metabolomics. 2009;5:199-208
16. Viant MR. Revealing the metabolome of animal tissues using 1H nuclear magnetic resonance spectroscopy. Methods Mol Biol. 2007;358:229-46
17. Posma JM, Robinette SL, Holmes E, Nicholson JK. MetaboNetworks, an interactive Matlab-based toolbox for creating, customizing and exploring sub-networks from KEGG. Bioinformatics. 2014;30:893-5
18. Chang CC, Lin CT. LIBSVM: A library for support vector machines. ACM Trans Intell Syst Technol. 2011;2:1-27
19. Vapnik VN. The Nature of Statistical Learning Theory. 1st ed. New York: Springer-Verlag. 1995
20. Wishart DS, Jewison T, Guo AC. et al. HMDB 3.0-The human metabolome database in 2013. Nucleic Acids Res. 2013;41:D801-7
21. Bailey NJ, Oven M, Holmes E, Nicholson JK, Zenk MH. Metabolomic analysis of the consequences of cadmium exposure in Silene cucubalus cell cultures via 1H NMR spectroscopy and chemometrics. Phytochemistry. 2003;62:851-8
22. Bundy JG, Iyer NG, Gentile MS. et al. Metabolic consequences of p300 gene deletion in human colon cancer cells. Cancer Res. 2006;66:7606-14
23. Akhtar SN, Singh RK, Jadegoud Y. et al. In vitro 1H NMR studies of RD human cell infection with echovirus 11. NMR Biomed. 2007;20:422-8
24. Gao H, Lu Q, Liu X. et al. Application of 1H NMR-based metabonomics in the study of metabolic profiling of human hepatocellular carcinoma and liver cirrhosis. Cancer Sci. 2009;100:782-5
25. Christensen HN. Role of amino acid transport and countertransport in nutrition and metabolism. Physiol Rev. 1990;70:43-77
26. Miccheli AT, Miccheli A, Di Clemente R. et al. NMR-based metabolic profiling of human hepatoma cells in relation to cell growth by culture media analysis. Biochim Biophys Acta. 2006;1760:1723-31
27. Lochnit G, Dennis RD, Geyer R. Phosphorylcholine substituents in nematodes: structures, occurrence and biological implications. Biol Chem. 2000;381:839-47
28. Doering CB, Danner DJ. Amino acid deprivation induces translation of branched-chain alpha-ketoacid dehydrogenase kinase. Am J Physiol: Cell Physiol. 2000;279:C1587-94
29. Chen Y, Chen Z, Feng JH. et al. Metabolic profiling of normal hepatocyte and hepatocellular carcinoma cells via 1H nuclear magnetic resonance spectroscopy. Cell Biol Int. 2018;42:425-34
30. Somashekar BS, Kamarajan P, Danciu T. et al. Magic angle spinning NMR-based metabolic profiling of head and neck squamous cell carcinoma tissues. J Proteome Res. 2011;10:5232-41
31. Munshi SU, Taneja S, Bhavesh NS. et al. Metabonomic analysis of hepatitis E patients shows deregulated metabolic cycles and abnormalities in amino acid metabolism. J Viral Hepatitis. 2011;18:e591-602
32. Gatenby RA, Gillies RJ. Why do cancers have high aerobic glycolysis? Nat Rev Cancer. 2004;4:891-9
33. Yang Y, Li C, Nie X. et al. Metabonomic studies of human hepatocellular carcinoma using high-resolution magic-angle spinning 1H NMR spectroscopy in conjunction with multivariate data analysis. J Proteome Res. 2007;6:2605-14
34. Matsuno T, Goto I. Glutaminase and glutamine synthetase activities in human cirrhotic liver and hepatocellular carcinoma. Cancer Res. 1992;52:1192-4
Author contact
![]() Corresponding author: Yang Chen, Department of Laboratory Medicine, Fujian Medical University, 88 Jiaotong Road, Fuzhou 350004, China. Tel.: +86-591 83569149; E-mail: chzhy85edu.cn
Corresponding author: Yang Chen, Department of Laboratory Medicine, Fujian Medical University, 88 Jiaotong Road, Fuzhou 350004, China. Tel.: +86-591 83569149; E-mail: chzhy85edu.cn

 Global reach, higher impact