Impact Factor ISSN: 1837-9664

 Global reach, higher impact
J Cancer 2018; 9(21):3971-3978. doi:10.7150/jca.26649 This issue Cite
Research Paper
Multiple Machine Learnings Revealed Similar Predictive Accuracy for Prognosis of PNETs from the Surveillance, Epidemiology, and End Result Database
Yiyan Song1,2,#, Shaowei Gao2,#, Wulin Tan2, Zeting Qiu3, Huaqiang Zhou3, Yue Zhao1, ![]()
1. Department of General Surgery, Guangdong Second Provincial General Hospital, Guangzhou, China
2. Department of Anesthesia, The First Affiliated Hospital of Sun Yat-sen University, Guangzhou, China
3. Zhongshan School of Medicine, Sun Yat-sen University, Guangzhou, China
# Song and Gao contributed equally to this work and should be regarded as co-first authors.
Received 2018-4-12; Accepted 2018-8-15; Published 2018-10-10
Abstract
Background: Prognosis prediction is indispensable in clinical practice and machine learning has been proved to be helpful. We expected to predict survival of pancreatic neuroendocrine tumors (PNETs) with machine learning, and compared it with the American Joint Committee on Cancer (AJCC) staging system.
Methods: Data of PNETs cases were extracted from The Surveillance, Epidemiology, and End Result (SEER) database. Statistic description, multivariate survival analysis and preprocessing were done before machine learning. Four different algorithms (logistic regression (LR), support vector machines (SVM), random forest (RF) and deep learning (DL)) were used to train the model. We used proper imputations to manage missing data in the database and sensitive analysis was performed to evaluate the imputation. The model with the best predictive accuracy was compared with the AJCC staging system using the SEER cases.
Results: The four models had similar predictive accuracy with no significant difference existed (p = 0.664). The DL model showed a slightly better predictive accuracy than others (81.6% (± 1.9%)), thus it was used for further comparison with the AJCC staging system and revealed a better performance for PNETs cases in SEER database (Area under receiver operating characteristic curve: 0.87 vs 0.76). The validity of missing data imputation was supported by sensitivity analysis.
Conclusions: The models developed with machine learning performed well in survival prediction of PNETs, and the DL model have a better accuracy and specificity than the AJCC staging system in SEER data. The DL model has potential for clinical application but external validation is needed.
Keywords: machine learning, pancreatic neuroendocrine tumor, prognostic prediction, SEER database
Introduction
Pancreas neuroendocrine tumors (PNETs), also known as pancreatic endocrine tumors, are heterogeneous tumors arising from the endocrine tissues of the pancreas. They have a low but steadily increasing incidence of <1 per 100 000 persons per year and account for less than 2 percent of all pancreatic tumors [1].
The present curative treatment for PNETs is complete surgical resection of the primary tumor and the metastasis tumor if practicable [2]. With the growing emphasis on less invasive personalized treatment, an accurate prognostication system is important for treatment decision, frequency of postoperative surveillance. Various prognostication system have been developed for PNETs, among which the most commonly used are those developed by the World Health Organization (WHO), the American Joint Committee on Cancer (AJCC) and the European Neuroendocrine Tumor Society (ENETS). Though differences exist, these systems contain common elements such as cell differentiation, which can be measure by mitotic count and Ki-67 labelling index according to the WHO 2010 grading [3]. The AJCC and ENETS tumor-node-metastasis (TNM) staging system also incorporate tumor size, organ invasion as diagnostic factors [4,5]. Hormone profiling had also been reported to be relevant to the prognosis of PNETs [6]. Many studies have been carried out for comparison and validation of these prognostic systems, however, the superiority between these prognostication systems remain unclear [6,7,8].
Machine learning, a concept originate from artificial intelligence, may provide another choice for researchers. By learning from a large amount of data, machine learning aims to produce a robust model that can predict outcomes of another dataset. The quickly accumulated genomic data and clinical database also contribute to the various application of machine learning in medical research, especially in the study of oncology [9]. Machine learning has helped to predict cancer susceptibility, recurrence and survival by learning from various sources including mammogram, genomic and clinical features [10]. The Surveillance, Epidemiology, and End Result (SEER) database collects incidence and survival information that cover approximately 28% of the US population. Combined with machine learning, this comprehensive population-based proved to be valuable in predicting survival of many cancer such as breast cancer and lung cancer [11,12,13,14,15]. In this study, we aim to produce and compare models by exploring the PNETs populations extracted from the SEER database with classic machine learning algorithms.
Patients and Methods
DATA extraction
Binary format file of the SEER database (1973-2014) was downloaded from the official website after access to database was permitted by signing an agreement by the co-author Song, whose SEER ID was 14917-Nov2016 [16]. We established the database with binary format file downloaded above and an R package named 'SEERaBomb', which is maintained on github by Tomas Radivoyevitch [17]. This study used a public de-identified database and informed consent and approval of the Institutional Review Board were waived.
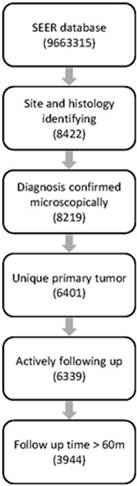
PNETs cases diagnosed between 1973 and 2014 were identified with a combination of topographical codes (International Classification of Diseases for Oncology, 3rd Edition, ICD-O-3: C250-259) and histology codes (8150, 8151, 8152, 8153, 8155, 8156, 8157, 8240, 8241, 8242, 8246 and 8249). Only cases with unique primary tumor that have been microscopically confirmed and actively follow up (excluding “Autopsy Only” or “Death Certificate Only” cases) was included in our study. Cases either with two or more primary tumors or only confirmed by laboratory test, radiology or other imaging techniques were excluded. Cases with follow up time equal to 0, which might indicate death in-hospital, were also excluded. Additionally, since class labels were necessary for supervised classification, we chose five-year tumor-specific survival status for training the model. As a result, living patients with a follow up time less than 60 months were excluded because their survival was more likely consequence to the short follow-up rather than the features used to train the models.
All objective features of patients (including marital status, race, gender, age of diagnosis, histology type, death status, tumor specific death status, survival time, tumor size, tumor extension, lymph metastasis, distant metastasis, surgery type and tumor grade) in the SEER database were selected for further analyses and machine learning. AJCC stages were also extracted for contrasting the models fitted by machine learning. The outcome for survival analysis was tumor-specific survival. As mentioned above, the class labels were set according to five-year tumor-specific survival status (the follow up point at 60 months) in machine learning, which meant patients would be assigned to the survival category even though they died after more than 5 years.
DATA preprocessing
We had explored the structure of features extracted from the database and made some modification for analysis. Two coding standards exist for tumor size, extension, lymph node invasion and distant metastasis in the SEER database. The SEER Extent of Disease (EOD) coding was used for cases diagnosed before 2004 [18]. Another standard, the Collaborative Stage (CS) coding was used for data after 2004 [5]. We merged identical variables coding by the two standards for different period with a uniform coding.
We also recoded marital status binarily to married and unmarried, the later included those never married, separated, widowed, et al. Tumor grade were also divided binarily to well-differentiated (well and moderate) and poor-differentiated (poor and undifferentiated) because the different editions of WHO grading standard (2004 and 2010) varied between well and moderate differentiated tumors but kept for poor-differentiated tumors [19].
Missing data was detected and processed with different method of imputation according to the variable type of features [20]. Predictive mean matching, logistic regression, polynomial regression was used for continuous, binary and categorical variables respectively. After imputation, unordered categorical variables with three or more levels (race, surgery type and histology type) were recoded with a binary value in which all bits are '0' except a single '1' for each level. This method is call one-hot encoding, which help to handle categorical variables in machine learning.
The complete datasets produced by imputation was compared to the original dataset with missing value to evaluate the validity of imputation. Continuous variables were expressed as median [interquartile range], while categorical variables were expressed as count (percentage). Then COX regression was applied to discover variables that probably have an influence on the outcomes. Variables for machine learning were selected according to the multivariate analysis and former literature evidence.
DATA analysis
We used four popular algorithms to fit the dataset prepared by the preprocessing mentioned above, including logistic regression (LR), support vector machines (SVM), random forest (RF) and deep learning (DL) [21,22,23]. All these algorithms aimed to express the outcomes as a combination of the features with a mathematical function with several parameters, which need to be learned from the data. LR is an easy-to-operate method for binary classification with independent features. SVM, another popular method for cancer diagnosis or prognosis, handles the classification problems by mapping the input vectors into a higher dimensional space, and the hyperplane that best separate the two categories was considered classifiers. As its name implied, RF was a group of many decision trees and the yield the classification which was supported by most trees. Multiple hidden layers of nonlinear processing was used to extract the feature of input data in DL, which is considered an uninterpretable black-box and make DL different from the other three methods. There are also hyperparameters which can not be learned from data, including regularization coefficient in LR, penalty strength and the kernel parameter gamma in SVM, depth and number of trees in RF, number of hidden layers in DL. To make a balance between overfitting and underfitting, the best hyperparameters were achieved with grid searching for LR, SVM and RF. In DL, the number of hidden layer was decided by manually traversing and the Adam algorithm was used for optimization with all its parameters kept to default [24]. Ten-folds cross validation was used to evaluate and compare predictive accuracy of models produced by the four methods. Features in each training set were normalized before model training with formula (refers to normalized value for certain feature, refers to each sample, refers to the minimal value for certain feature, refers to the maximal value for certain feature, refers to the real value for certain feature).
Then we checked the sensitivity of missing data imputation by applying the model to a series of subsets created by deleting missing data of one unique feature for a subset and re-imputing the missing data of the other features. These subsets were name according to their feature with missing data as metastasis-na-omit (MNO) subset, extend-na-omit (ENO) subset, lymph-na-omit (LNO) subset, size-na-omit (SNO) subset and grade-na-omit (GNO). In addition, a subset named overall-na-omit (ONO) was also created by deleting missing data of all features. Predictive accuracy of the model was compared between these subsets, and little difference will confirm the validity of missing data imputation.
Finally, we assessed the overall value of our model by making a comparison with the AJCC stage system [5]. The Kaplan-Meier survival curve and receiver operating characteristic (ROC) curve were plotted and area under curve (AUC) was calculated to evaluate the accuracy and specificity of the two prognostication methods.
All computation and analyses in our research was completed with R language (version 3.3.2) and Python (version 2.7.14). R package 'mice' was use for missing data imputation, while 'tableone', 'survival' were imported for displaying tables and COX regression respectively. Python module 'Scikit learn' was responsible for all methods of machine learning except DL, which was done with the Application Program Interface (API) provided by 'Keras' and 'Tensorflow' [25,26]. Python module 'matplotlib' was responsible for all data visualizations. Statistical tests for continuous variables used One-way ANOVA. For categorical variables, Chi-square test or Fisher's exact test (if necessary) was used. Cox regression model was applied for multivariate survival analysis. Differences were considered statistically significant for p < 0.05.
Results
The SEER database (1973-2014) consists of 9,663,315 records, among which 8422 cases were diagnosed with PNETs identified with ICD topographical and histological codes. Finally, 3944 cases were retained for further analysis after filtration with our inclusion and exclusion criteria. Workflow of data selecting was illustrated in Fig.1.
Workflow of data selection from the SEER database
There were missing data in several features including marital status, race, tumor size, regional extension, lymph invasion, distant metastasis, surgery and tumor grade. Demographic features of dataset before and after imputation were both summarized in table 1 and no significant difference was detected between the two datasets.
Demographic features of datasets before and after imputation.
| Features | Category | Values before imputation | Values after imputation | p value |
|---|---|---|---|---|
| Gender (%) | Male | 2136 (54.2) | 2136 (54.2) | - |
| Female | 1808 (45.8) | 1808 (45.8) | ||
| Age at diagnosis (median [IQR]) | 59.00 [48.00, 69.00] | 59.00 [48.00, 69.00] | - | |
| Marital status (%) | Single | 1336 (35.1) | 1385 (35.1) | 0.991 |
| Married | 2467 (64.9) | 2559 (64.9) | ||
| NA | 141(3.6) | - | ||
| Race (%) | White | 3201 (81.5) | 3216 (81.5) | 0.998 |
| Black | 444 (11.3) | 444 (11.3) | ||
| Others | 283 ( 7.2) | 284 ( 7.2) | ||
| NA | 16(0.4) | - | ||
| Histology type (%) | Islet-cell adenocarcinoma | 1043 (26.4) | 1043 (26.4) | - |
| Malignant beta-cell tumor | 64 (1.6) | 64 (1.6) | ||
| Malignant alpha-cell tumor | 31 (0.8) | 31 (0.8) | ||
| G-cell tumor | 76 (1.9) | 76 (1.9) | ||
| VIPoma | 15 (0.4) | 15 (0.4) | ||
| Malignant somatostatinoma | 1 (0.0) | 1 (0.0) | ||
| Carcinoid tumor | 264 (6.7) | 264 (6.7) | ||
| Argentaffin carcinoid tumor | 2 (0.1) | 2 (0.1) | ||
| Mucocarcinoid tumor | 4 (0.1) | 4 (0.1) | ||
| Neuroendocrine carcinoid tumor | 2432 (61.7) | 2432 (61.7) | ||
| Atypical carcinoid tumor | 12 ( 0.3) | 12 (0.3) | ||
| Tumor size (median [IQR]) | 43.00 [30.00, 65.00] | 45.00 [30.00, 69.00] | 0.083 | |
| NA | 1339 (34.0) | - | ||
| Regional extension (%) | Extended | 1915 (63.8) | 2607 (66.1) | 0.05 |
| Local | 1086 (36.2) | 1337 (33.9) | ||
| NA | 943(23.9) | - | ||
| Lymph invasion (%) | Negative | 1422 (56.0) | 2159 (54.7) | 0.321 |
| Positive | 1116 (44.0) | 1785 (45.3) | ||
| NA | 1406(35.6) | - | ||
| Distant metastasis (%) | Negative | 1294 (34.4) | 1352 (34.3) | 0.967 |
| Positive | 2473 (65.6) | 2592 (65.7) | ||
| NA | 177(4.5) | - | ||
| surgery (%) | No surgery | 2283 (61.6) | 2430 (61.6) | 0.856 |
| Tumor destruction | 26 (0.7) | 30 (0.8) | ||
| Surgery, unknown type | 186 ( 5.0) | 213 ( 5.4) | ||
| Tumor resection | 1213 (32.7) | 1271 (32.2) | ||
| NA | 236(6.0) | - | ||
| Grade (%) | Poor differentiated | 445 (32.2) | 1358 (34.4) | 0.144 |
| well-moderate differentiated | 936 (67.8) | 2586 (65.6) | ||
| NA | 2563(65.0) | - | ||
| Survival time (median [IQR]) | 27.00 [6.00, 79.00] | 27.00 [6.00, 79.00] | - | |
| Total | 3944 | 3944 |
NA refers to count of missing value; '-' refers to not applicable. Abbreviations: IQR, interquartile range;
The result of multivariate survival analysis was summarized on table 2. Most of the features were recognized as independent prognostic factors for tumor-specific survival time, except for race and tumor size. However, the prognostication power of these two features were supported by literatures [27,28]. Considering our relatively large sample size, we decided to train our model with all features.
Results of multivariate survival analysis
| Features | HR (95%CIs) | p values |
|---|---|---|
| Marital(single) | 1.19(1.10-1.29) | <0.001 |
| White Race | 1 | |
| Race(black) | 1.12(1.00-1.26) | 0.057 |
| Race(other) | 1.10(0.95,1.27) | 0.193 |
| Gender(male) | 1.11(1.03-1.19) | 0.008 |
| Age | 1.02(1.02-1.03) | <0.001 |
| Islet-cell adenocarcinoma | 1 | |
| Malignant beta-cell tumor | 0.94(0.67-1.31) | 0.702 |
| Malignant alpha-cell tumor | 0.62(0.40-0.96) | 0.036 |
| G-cell tumor | 0.59(0.43-0.80) | <0.001 |
| VIPoma | 0.61(0.34-1.08) | 0.089 |
| Malignant somatostatinoma | - | 0.981 |
| Carcinoid tumor | 1.01(0.86-1.18) | 0.939 |
| Argentaffin carcinoid tumor | 1.47(0.36-5.94) | 0.59 |
| Mucocarcinoid tumor | 0.51(0.16-1.58) | 0.242 |
| Neuroendocrine carcinoid tumor | 1.14(1.04-1.25) | 0.003 |
| Atypical carcinoid tumor | 2.01(1.11-3.65) | 0.022 |
| Tumor size | 1.00(1.00-1.00) | 0.431 |
| Regional extension | 1.25(1.14-1.37) | <0.001 |
| Lymph positive | 1.09(1.01-1.17) | 0.02 |
| Distant metastasis | 2.08(1.86-2.31) | <0.001 |
| No surgery | 1 | |
| Tumor destruction | 0.51(0.35-0.75) | <0.001 |
| Surgery, unknown type | 0.62(0.52-0.74) | <0.001 |
| Tumor resection | 0.42(0.37-0.46) | <0.001 |
| Poor tumor grade | 2.13(1.97-2.31) | <0.001 |
'-' exists if only one case in that category. Abbreviation: CIs, confidence intervals
In the LR model, the best parameter C representing the inverse of regularization coefficient was found to be 0.1 by grid searching (SFig.1), which yielded a mean accuracy score of 81.5% (± 1.7%) for test sets. Similar for SMV, the parameter C = 100 representing penalty strength and the kernel parameter gamma = 0.01 gave a best-performing model with an mean accuracy of 80.7% (± 1.6%) (SFig.2). The RF method had a best performance with a mean accuracy of 81.5% (± 1.8%) when the number of decision tree is 600 and a max depth is 9 per tree (SFig.3).
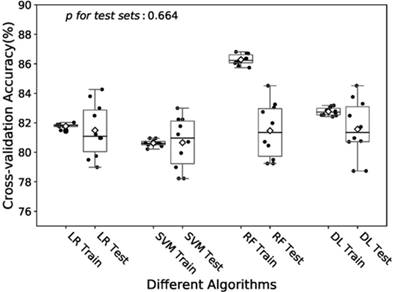
In the training of DL model, we manually increased the number of hidden layers starting with 2 layers. The predictive accuracy culminated with 3 layers and adding more layer did not improve the performance but increase time of computation. Therefore, we decided to train the model with 3 hidden layers as well as 3 dropout layers to avoid overfitting. Finally the DL model was produced by over 60 epoches training with a batch size of 32, and showed a predictive accuracy of 81.6% (± 1.9%) for test sets. The accuracies of the models fitted by four algorithms for training and test sets were visualized in Fig.2. The RF model revealed a little overfitting, while the DL model got the best mean of accuracies for test sets though there was no significant difference.
Boxplot of the predictive accuracies of the LR, SVM, RF and DL models for training and test sets. The point refers to the certain accuracy of each algorithm for each cross-validation. The horizontal line in the box refers to the median and the rhombus refers to the mean. Abbreviations: LR, logistic regression; SVM, support vector machines; RF random forest; DL, deep learning.
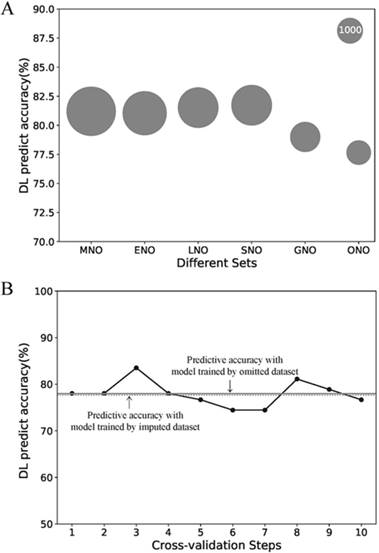
Due to its better predictive accuracy, the DL model was applied to the further sensitive analysis of imputation and comparison with the AJCC stage system. The predict accuracy of the DL model for the MNO, ENO, LNO, SNO, GNO and ONO subset as well as data size of each subsets were visualized in Fig.3 A. The predictive accuracy for the ONO subset dropped to 77.7%. To find the cause of drop, we re-trained the DL model with 10-fold cross-validation on ONO itself (Fig.3 B). The mean accuracy of the re-trained DL model was 78.0% (± 2.6%) and no significant difference exists compared with the original DL model (p = 0.90). Thus we concluded that the drop of predictive accuracy did not result from the imputation of missing data.
Sensitive analysis of the missing data imputation. (A) Predictive accuracies of the DL model for different subsets. The area of the bubble represents the sample size of the subset. (B) Predictive accuracies of the DL model for ONO dataset with the 10-fold cross-validation. Each point refers to the certain accuracy of each step of cross-validation. The horizontal solid line refers the mean accuracy of these ten steps. While the horizontal dotted line refers to the accuracy of the DL model trained by imputed dataset but validated on ONO dataset. Abbreviations: MNO, metastasis-na-omit subset; ENO, extend-na-omit subset; LNO, lymph-na-omit subset; SNO, size-na-omit subset; GNO, grade-na-omit subset. ONO, overall-na-omit, DL, deep learning.
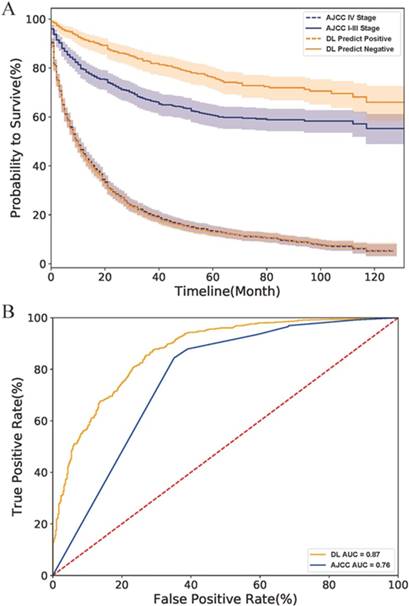
Finally, we compared the DL model with the AJCC stage system. As the survival curves in Fig.4 A showed, the DL predicted negative cases had lower hazard rates than those classified as stage I-III by the AJCC system, indicating that the DL model have a better performance than the AJCC system in survival prediction of early-stage cases. However, DL might be as good as (but no better than) AJCC for predicting survival rate in more advanced PNETs since the curve of the DL predicted positive cases perfectly overlapped with that of AJCC IV Stage cases. The ROC curve of the AJCC system located right lower to the DL curve and had a smaller AUC value than the DL model (0.88 to 0.76) as shown in Fig.4 B. All above evidence implied that the DL model had a better accuracy and specificity than traditional AJCC staging system for PNETs cases in SEER database.
Comparison of DL model and AJCC stage system on the SEER dataset. (A) The survival curves of two system. The fillings surrounding the lines refers to the 95% confidence intervals. (B) The ROC curves of two systems. Abbreviation: AJCC, American Joint Committee on Cancer; ROC, receiver operating characteristic; AUC, area under curve; DL, deep learning.
Discussion
Our study analyzed the public database SEER with four machine learning algorithms in order to establish a prognostication model for PNETs. Models produced by these four algorithm got similar predictive accuracies of more than 80% for test sets. As an evaluation, the DL model performed better than traditional AJCC staging system for the SEER cases. Missing data did not affect the model performance.
As data are produced at an incredibly rapid speed and databases for various data types have been developed, the big-data era is coming. Compared with traditional researches, databases have the advantage of collecting data with a wide range of time and space rather than several research centers. Moreover, the web-based storage also makes it convenient to get access to the data for researchers. At the same time, managing the redundancy and quality control of data also become a challenge.
Data themselves is useless and must be analyzed and interpreted, and machine learning have provided a powerful tool for cancer prognostic research. Park K and his fellows established a model using graph-based semi-supervised learning algorithm with 162,500 breast cancer cases in the SEER database, which showed a predictive accuracy of 71% [29]. Another machine learning method, artificial neural network (shallow learning) had been used by Chen Y-C and his collaborators to train a model with heterogeneous data type of clinical data and gene expression data, which also had a good performance of 83.5% accuracy [30]. In fact, as the review written by Kourou K, et al indicated, there was an increasing tendency of applying machine learning in the field of cancer study 10.
One of the challenges in machine learning is overfitting, which also presented in our study. As shown in Fig.2, the RF model performed well with a 86.3% (± 0.4%) accuracy for the training, while the accuracy dropped to 81.5% (± 1.8%) for the test set. The overfitting may be caused by the small size of training set and the large depth of decision trees. It can be seen in the supplement Fig.3B that the learning curves of training and test sets got closer as the size of training set increased. And the predictive accuracy for test set was 81.2% (± 1.7%) and 83.6% (± 0.2%) for the training set when we reduced the max depth per tree to 7. However, in the grid search process, only test set was taken into consideration. As well as the overfitting of the RF model, the predictive accuracies of models training by four algorithms were also affected by sample size (Fig S1-4). However, the relatively low accuracy for the ONO subset can not be explained only by sample size. Our imputation was based on logistic regression, polynomial regression and predictive mean matching, all of which neglected random effects. However, the really close predictive accuracy between the model trained by the ONO subset and that by imputed dataset support the validity of imputation. Thus the imputed dataset was not deviated from the real-word dataset and the model trained with it was also valid.
Various prognostication systems had been proposed by other researchers. For instance, the Memorial Sloan Kettering Cancer Center (MSKCC) prognostication system for PNETs takes grade, tumor size as well as presence of metastasis into account [31]. And the scoring system proposed by Bilimoria et al indicates that age, grade, and distant metastasis are powerful prognostic factors for PNETs [32]. Currently the simplest prognostic system is that developed by Ellison et al in 2014, which used a cutoff age of 63, gender, and a continuous Ki-67 index to calculate the 5-year overall survival rate and median overall survival time [33]. The superiority of these systems had not been confirmed and they are not so widely accepted compared with the traditional AJCC system.
We had established prognostication models for PNETs with different algorithms, which had good performance for the SEER cases and possessed the potential for clinical application. However, there are many steps toward the widely application. Firstly, our research lacked external validation, while the widely accepted AJCC staging system has been validated by patients all over the world. Secondly, the SEER dataset has a number of missing data. Though we had managed it with reasonable methods, some hidden regulars could not be dug out. Finally, as PNETs are relatively rare disease, the size of data is still small for machine learning. The accumulating data collected by institution over the word and the development of the public database are expected to provide a perfect solution for study of these rare diseases.
Conclusion
We compared four machine learning algorithms for PNETS survival prediction and little difference had been observed. All models had an accuracy of more than 80% in predicting five-year survival rate, and the DL performed better than the AJCC stage system for PNETs cases in the SEER database. The models have potential for clinical application, but more validations are needed.
Abbreviations
PNETs: Pancreas neuroendocrine tumors; AJCC: American Joint Committee on Cancer; SEER: The Surveillance, Epidemiology, and End Result database; LR: logistic regression; SVM: support vector machines; RF: random forest; DL: deep learning; WHO: World Health Organization; ENETS: European Neuroendocrine Tumor Society; TNM: tumor-node-metastasis; EOD: Extend of Disease; CS: Collaborative Stage MNO: metastasis-na-omit; ENO: extend-na-omit; LNO: lymph-na-omit; SNO: size-na-omit; GNO: grade-na-omit; ONO: overall-na-omit; ROC: receiver operating characteristic; AUC: area under curve; API: Application Program Interface.
Supplementary Material
Supplementary figures.
Acknowledgements
We appreciate the public database provider and maintenance staffs. We thank the analysis tools or packages producer. They really give powers to reveal secrets from the frosty data.
Competing Interests
The authors have declared that no competing interest exists.
References
1. Vinik A, Perry RR, Casellini C. et al. Pathophysiology and Treatment of Pancreatic Neuroendocrine Tumors (PNETs): New Developments. In: (ed.) De Groot LJ, Chrousos G, Dungan K. et al. Endotext. South Dartmouth (MA): MDText.com, Inc. 2000 -. Available from: https://www.ncbi.nlm.nih.gov/books/NBK279074/
2. Metz DC, Jensen RT. Gastrointestinal neuroendocrine tumors: pancreatic endocrine tumors. Gastroenterology. 2008;135(5):1469-1492
3. Kulke MH, Anthony LB, Bushnell DL. et al. NANETS treatment guidelines: well-differentiated neuroendocrine tumors of the stomach and pancreas. Pancreas. 2010;39(6):735-752
4. Rindi G, Kloppel G, Couvelard A. et al. TNM staging of midgut and hindgut (neuro) endocrine tumors: a consensus proposal including a grading system. Virchows Arch. 2007;451(4):757-762
5. Edge SB, Compton CC. The American Joint Committee on Cancer: the 7th edition of the AJCC cancer staging manual and the future of TNM. Ann Surg Oncol. 2010;17(6):1471-1474
6. Morin E, Cheng S, Mete O. et al. Hormone profiling, WHO 2010 grading, and AJCC/UICC staging in pancreatic neuroendocrine tumor behavior. Cancer Med. 2013;2(5):701-711
7. Teo R, Goh BKP, Tai DWM. et al. Validation and comparison between current prognostication systems for pancreatic neuroendocrine neoplasms: A single-institution experience with 176 patients. Surgery. 2017;161(5):1235-1245
8. Goh BK, Chow PK, Tan YM. et al. Validation of five contemporary prognostication systems for primary pancreatic endocrine neoplasms: results from a single institution experience with 61 surgically treated cases. ANZ J Surg. 2011;81(1-2):79-85
9. Obermeyer Z, Emanuel EJ. Predicting the Future - Big Data, Machine Learning, and Clinical Medicine. N Engl J Med. 2016;375(13):1216-1219
10. Kourou K, Exarchos TP, Exarchos KP, Karamouzis MV, Fotiadis DI. Machine learning applications in cancer prognosis and prediction. Comput Struct Biotechnol J. 2015;13:8-17
11. Kim J, Shin H. Breast cancer survivability prediction using labeled, unlabeled, and pseudo-labeled patient data. J Am Med Inform Assoc. 2013;20(4):613-618
12. Delen D, Walker G, Kadam A. Predicting breast cancer survivability: a comparison of three data mining methods. Artif Intell Med. 2005;34(2):113-127
13. Lynch CM, Abdollahi B, Fuqua JD. et al. Prediction of lung cancer patient survival via supervised machine learning classification techniques. Int J Med Inform. 2017;108:1-8
14. Lynch CM, van Berkel VH, Frieboes HB. Application of unsupervised analysis techniques to lung cancer patient data. PLoS One. 2017;12(9):e0184370
15. Ayer T, Alagoz O, Chhatwal J, Shavlik JW, Kahn CE Jr, Burnside ES. Breast cancer risk estimation with artificial neural networks revisited: discrimination and calibration. Cancer. 2010;116(14):3310-3321
16. Surveillance Epidemiology and End Results program National Cancer Institute. http://www.seer.cancer.gov. Accessed 23 November. 2017
17. Radivoyevitch T, Sachs RK, Gale RP. et al. Defining AML and MDS second cancer risk dynamics after diagnoses of first cancers treated or not with radiation. Leukemia. 2016;30(2):285-294
18. National Cancer Institute. SEER extent of disease 1988 codes and coding instructions. https://seer.cancer.gov/archive/manuals/EOD10Dig.3rd.pdf
19. Bosman FT, Carneiro F, Hruban RH, Theise ND. WHO classification of tumours of the digestive system. World Health Organization. 2010
20. Sterne JA, White IR, Carlin JB. et al. Multiple imputation for missing data in epidemiological and clinical research: potential and pitfalls. BMJ. 2009;338:b2393
21. LeCun Y, Bengio Y, Hinton G. Deep learning. Nature. 2015;521(7553):436-444
22. Segal MR. Machine learning benchmarks and random forest regression. 2004.
23. Dreiseitl S, Ohno-Machado L. Logistic regression and artificial neural network classification models: a methodology review. J Biomed Inform. 2002;35(5-6):352-359
24. Kingma DP, Ba J. Adam: A method for stochastic optimization. arXiv preprint arXiv: 14126980. 2014
25. Abadi M, Barham P, Chen J. et al. TensorFlow: A System for Large-Scale Machine Learning. Paper presented at: OSDI2016.
26. Pedregosa F, Varoquaux G, Gramfort A. et al. Scikit-learn: Machine learning in Python. J Mach Learn Res. 2011;12(Oct):2825-2830
27. Zhou H, Zhang Y, Wei X. et al. Racial disparities in pancreatic neuroendocrine tumors survival: a SEER study. Cancer Med. 2017;6(11):2745-2756
28. Ekeblad S, Skogseid B, Dunder K, Öberg K, Eriksson B. Prognostic factors and survival in 324 patients with pancreatic endocrine tumor treated at a single institution. Clin Cancer Res. 2008;14(23):7798-7803
29. Park K, Ali A, Kim D, An Y, Kim M, Shin H. Robust predictive model for evaluating breast cancer survivability. Eng Appl Artif Intell. 2013;26(9):2194-2205
30. Chen Y-C, Ke W-C, Chiu H-W. Risk classification of cancer survival using ANN with gene expression data from multiple laboratories. Comput Biol Med. 2014;48:1-7
31. Ferrone CR, Tang LH, Tomlinson J. et al. Determining prognosis in patients with pancreatic endocrine neoplasms: can the WHO classification system be simplified? J Clin Oncol. 2007;25(35):5609-5615
32. Bilimoria KY, Talamonti MS, Tomlinson JS. et al. Prognostic score predicting survival after resection of pancreatic neuroendocrine tumors: analysis of 3851 patients. Ann Surg. 2008;247(3):490-500
33. Ellison TA, Wolfgang CL, Shi C. et al. A single institution's 26-year experience with nonfunctional pancreatic neuroendocrine tumors: a validation of current staging systems and a new prognostic nomogram. Ann Surg. 2014;259(2):204
Author contact
![]() Corresponding author: Yue Zhao. Department of General Surgery, Guangdong Second Provincial General Hospital, No.466 Middle Xingang Road Haizhu District, Guangzhou City, Guangdong, China, 510310. Phone number: (+86) 134 1616 8793; Email address: zhaoyue_tjmucom
Corresponding author: Yue Zhao. Department of General Surgery, Guangdong Second Provincial General Hospital, No.466 Middle Xingang Road Haizhu District, Guangzhou City, Guangdong, China, 510310. Phone number: (+86) 134 1616 8793; Email address: zhaoyue_tjmucom