Impact Factor ISSN: 1837-9664

 Global reach, higher impact
J Cancer 2018; 9(15):2702-2712. doi:10.7150/jca.25646 This issue Cite
Research Paper
Analysis of the expression of cancer-associated fibroblast- and EMT-related proteins in submucosal invasive colorectal cancer
Tamotsu Sugai1, Noriyuki Uesugi1, Yuriko Kitada1, Noriyuki Yamada1, Mitsumasa Osakabe1, Makoto Eizuka1, Ryo Sugimoto1, Yasuko Fujita1, Keisuke Kawasaki2, Eiichiro Yamamoto3, Hiroo Yamano3, Hiromu Suzuki4, Takayuki Matsumoto2 ![]()
1. Department of Molecular Diagnostic Pathology, School of Medicine, Iwate Medical University, 19-1, Morioka 020-8505, Japan
2. Division of Gastroenterology, Department of Internal Medicine, 19-1, Morioka 020-8505, Japan
3. Department of Gastroenterology, Sapporo Medical University, School of Medicine, Cyuuouku, Sapporo 060-0061, Japan
4. Department of Molecular Biology, Sapporo Medical University, School of Medicine, Cyuuouku, Sapporo 060-0061, Japan
Received 2018-2-21; Accepted 2018-4-26; Published 2018-6-23
Abstract
Objective: Recent studies have shown that cancer-associated fibroblasts (CAFs) and the epithelial-mesenchymal transition (EMT) play important roles in the progression and metastasis of CRC. Although prediction of lymph node metastasis in submucosal invasive colorectal cancer (SiCRC) is important, the relationships of CAF and EMT with lymph node metastasis of SiCRC have not yet been examined. Here, we aimed to analyze the expression patterns of CAF- and EMT-related proteins in SiCRC.
Materials and Methods: The expression of CAF-related markers, including α-smooth muscle actin, CD10, podoplanin, fibroblast specific protein 1, and adipocyte enhancer-binding protein 1, and EMT-related proteins [zinc finger protein SNAI2 (ZEB1) and twist-related protein 1 (TWIST1) in SiCRC with (n = 29) or without (n = 80) lymph node metastasis was examined by immunohistochemistry. We examined the expression patterns of biomarkers using hierarchical cluster analysis. Consequently, four subgroups were established based on the expression patterns of CAF- and EMT-related markers, and the associations of these subgroups with clinicopathological variables.
Results: In multivariate analysis, subgroup 2, which was characterized by high expression of all markers, was correlated with lymph node metastasis (p < 0.01). Next, we examined the associations of individual biomarkers with lymph node metastasis. Multivariate analysis showed that moderately differentiated adenocarcinoma was significantly associated with lymph node metastasis (p < 0.05).
Conclusions: Our findings showed that expression patterns of CAF markers and EMT-related proteins may allow for stratification of patients into risk categories for lymph node metastasis in SiCRC.
Keywords: cancer-associated fibroblast, colorectal cancer, epithelial-mesenchymal transition, hierarchical cluster analysis, submucosal colorectal cancer
Introduction
Endoscopic resection has been used as a standard curative therapy for Tis colorectal cancer (CRC; carcinoma in situ; intraepithelial or invasion of the lamina propria), given that this method is not associated with the risk of lymph node metastasis [1-3]. However, once CRC has invaded into the submucosal layer, it can acquire metastatic ability (incidence of approximately 10-15%) [3, 4]. In order to achieve curative resection of submucosal invasive CRC (SiCRC), various predictive factors for lymph node metastasis have been evaluated [5-8], including depth of submucosal invasion, lymphatic/vascular invasion, and presence of poorly differentiated cancer components. Although a previous study showed that molecular alterations may develop into more progressive alterations following invasion of CRC cells into the submucosal layer [9], few studies have examined the association of lymph node metastasis with molecular changes occurring in the submucosal invasive area.
Although cancers are composed of cancer cells and surrounding stromal cells [10], the stromal cells are thought to be reactive in nature, not neoplastic in nature [11]. In previous studies, analysis of molecular alterations related to the progression or metastatic potential of CRC has primarily focused on cancer cells only [11-12]. However, progression of CRC has recently been shown to be closely associated with not only cancer cells but also the surrounding interstitial cells, include fibroblasts, histiocytes, endothelial cells, pericytes, and smooth muscle cells [11]. Among these cell types, fibroblasts are prominent modifiers of cancer progression; in particular, so-called cancer-associated fibroblasts (CAFs) are important promoters of tumor progression and metastasis [11-14].
One of the most important biological features of CRC is the epithelial-mesenchymal transition (EMT), which is associated with tumor progression and metastasis [15, 16]. The EMT is characterized by low or negative expression of E-cadherin and high expression of the EMT-related proteins zinc finger protein SNAI1 (Snail), zinc finger protein SNAI2 (Slug), Twist-related protein 1 (TWIST1), and zinc finger E-box binding homeobox 1 (ZEB1), which act on the promoter region of E-cadherin [15-18]. The EMT promotes the morphological change from malignant epithelial cells to mesenchymal cells [18], suggesting that mesenchymal cells transformed through the EMT may be classified as CAFs. Thus, both CAF and the EMT are thought to be closely associated with tumor progression and metastasis because fibroblasts are found surrounding the cancer nest at the invasive front.
Many researchers have investigated the clinicopathological alteration of submucosal CRC [19, 20]; however, no studies have examined the molecular alterations, in particular, expression of CAF- and EMT-related proteins occurring in cancer cells that invade into the submucosal layer. Accordingly, in this study, we evaluated the usefulness of the expression patterns of CAF- and EMT-related proteins as well as clinicopathological variables to predict lymph node metastasis in submucosal invasive CRC.
Materials and Methods
Patients
In patients who underwent curative surgery for submucosal CRC (SiCRC) at Iwate Medical University, the present study was conducted on a nonconsecutive series of 109 patients whose medical records were complete and for whom the results of lymph node metastasis had been clarified. SiCRC was divided into two categories according to the absence or presence of lymph node metastasis. Depth of submucosal invasion was also subclassified into pSM1 and pSM2 based on the criteria used in Classification of the Japanese Society for Cancer of the Colon and Rectum [21]. Briefly, nonpedunculated lesions with a vertical invasion length of less than 1000 μm in the submucosal layer were classified as pSM1, and those with invasion of more than 1000 μm were classified as pSM2. In contrast, pedunculated lesions were categorized according to Haggitt's classification [4]. Tumor budding was defined as an isolated single cancer cell or a cluster composed of fewer than five cancer cells [4]. Tumor budding was scored into two subgroups: low/negative and high, according to the criteria used in the Classification of the Japanese Society for Cancer of the Colon and Rectum. Briefly, after selecting an area in which budding/sprouting was most intensive, the buds were counted in a field measuring 0.95 mm2 through a 20× objective lens (WHK 10× ocular lens; Olympus, Tokyo, Japan) [21]. Depending on the number of buds, the criteria by the Japanese Classification of Colorectal Cancer (JCCC) for estimation of tumor budding/sprouting were used as follows: low grade, 0-9 buds; and high grade, 10 or more buds [22]. Clinicopathological findings, including histological diagnosis, tumor location, and macroscopic classification, were recorded according to the Classification of the Japanese Society for Cancer of the Colon and Rectum [21]. In brief, whereas “well-differentiated adenocarcinoma” exhibited a relatively regular tubular structure, “moderately differentiated adenocarcinoma” was characterized by a cribriform or irregular tubular structure. In addition, “papillary adenocarcinoma” demonstrated papillary or villous structures. “Poorly differentiated adenocarcinoma” exhibited a solid or trabecular stricture; however, this histological type was only found in the submucosal invasion area (2 cases). Histological diagnosis of the tumor was determined by histological superiority within the same tumor. Lymphatic and vascular invasion of the examined cases was determined by D2-40 immunostaining and elastic staining, respectively. Although extensive desmoplasia, defined as a proliferation of active fibroblasts with expression of α-smooth muscle actin and loss of desmin expression, was frequently observed, lymphocytic infiltration in the submucosal area was not often detected. Therefore, extensive desmoplasia and scanty lymphocyte infiltration were common findings in the present cases we examined. The slides were independently evaluated by two experienced pathologists (S. T. and N. U.); in some cases in which the evaluation provided different results, a consensus interpretation was reached after re-examination.
Patient survival was confirmed through telephone interviews. There were no deaths from SiCRC. Patients did not undergo pre-operative chemoradiotherapy or radiotherapy. In addition, patients who showed evidence of hereditary nonpolyposis CRC or familial adenomatous polyposis were excluded from the study. The various clinicopathological parameters of the patients were confirmed by reviewing the patient medical records and pathology files and were evaluated according to the Classification of the Japanese Society for Cancer of the Colon and Rectum. The detailed clinicopathological findings are listed in Table 1.
Clinicopathological findings of submucosal invasive colorectal cancer
| Findings | Cases (%) | |
|---|---|---|
| Total | 109 | |
| Sex | Men : Women | 57 : 52 |
| Age (year) | Range (median) | 40-93 (67) |
| Size (mm) | Range (median) | 5-80 (22.5) |
| Site | Right | 36 (33.0) |
| Left | 73 (67.0) | |
| Macroscopic type | 0-I type | 37 (33.9) |
| 0-IIa type | 24 (22.0) | |
| 0-IIc type | 16 (14.7) | |
| 0-IIa+IIc type | 28 (25.7) | |
| LST type | 5 (4.6) | |
| Histological type | WDA | 36 (33.0) |
| MDA | 69 (63.3) | |
| PAP | 2 (1.8) | |
| POR | 2 (1.8) | |
| pSM depth | pSM1 | 8 (7.3) |
| pSM2 | 101 (92.7) | |
| Lymphatic invasion | Low | 104 (95.4) |
| High | 5 (4.6) | |
| Venous invasion | Low | 102 (93.6) |
| High | 7 (6.4) | |
| pN | pN0 | 80 (73.4) |
| pN1 | 29 (26.6) | |
| pM | pM0 | 109 |
| pM1 | 0 | |
| Tumor budding | Grade 1 | 99 (90.8) |
| Grade 2 | 10 (9.2) |
Macroscopic type: I, protruded type; IIa, flat elevated type; IIc, flat depressed type; LST, laterally spreading tumor; WDA, well-differentiated adenocarcinoma; MDA, moderately differentiated adenocarcinoma; PAP, papillary adenocarcinoma; POR, poorly differentiated adenocarcinoma.
This study was approved by the Ethical Research Committee of Iwate Medical University.
Construction of tissue microarrays (TMAs)
The construction of tissue microarrays (TMAs) has been described previously [22]. Briefly, formalin-fixed, paraffin-embedded tissue blocks containing CRC samples were retrieved from the archives of the Iwate Medical University Department of Diagnostic Molecular Pathology. Areas of submucosal invasive cancer were identified on corresponding H&E-stained slides, and the tissue blocks were cored and transferred to a recipient “master” block using a TMA.
Immunohistochemistry
Immunostaining was carried out as follows. First, 3-μm-thick tissue sections were cut from paraffin-embedded blocks. After deparaffinization and rehydration, the sections were heated in EnvisionTM FLEX target retrieval solution (pH 6.0 or 9.0; Dako) for 20 min and washed twice for 5 min in phosphate-buffered saline (PBS). Three percent hydrogen peroxide was used to block endogenous peroxidase for 5 min. Nonspecific binding was blocked with 1.5% normal serum in PBS for 35 min at room temperature. Immunohistochemical staining was performed as described previously [23, 24].
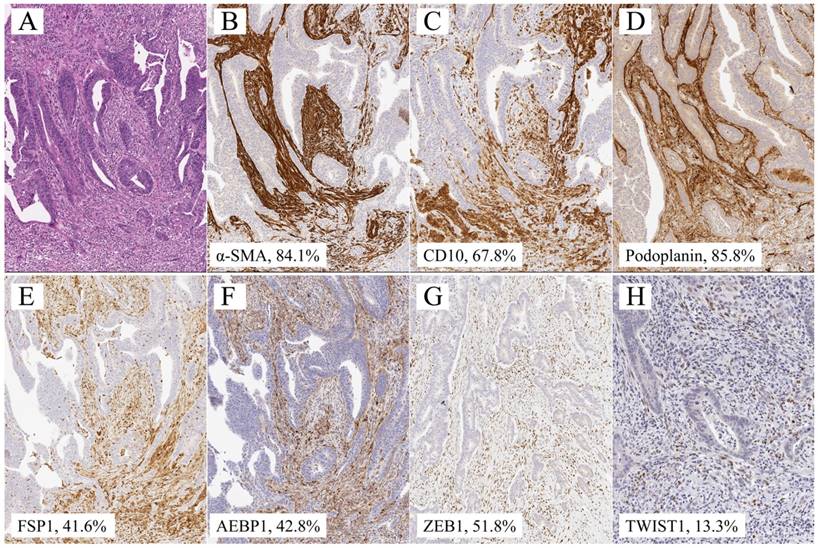
Antibodies targeting α-smooth muscle actin (α-SMA), CD10, podoplanin, fibroblast specific protein 1 (FSP1; S100A4), and adipocyte enhancer-binding protein 1 (AEBP1) for CAFs and Zinc finger E-box binding homeobox 1 (ZEB1) and Twist-related protein 1 (TWIST1) for the EMT were used in this study (Table 2). CAFs were recognized as “spindle-shaped cells” by experienced pathologists (T.S. and N.U.). Cytoplasmic staining of tumor cells stained with α-SMA, CD10, podoplanin, FSP1, and AEBP1 was considered positive, and nuclear staining of fibroblasts with ZEB1 and TWIST1 was regarded as positive.
Antibodies used in this study
| Antibody | Source | Clone | Dilution | Treatment |
|---|---|---|---|---|
| α SMA | Dako | 1A4 | Ready to use | Heating (pH9) |
| CD10 | Dako | 56C6 | Ready to use | Heating (pH9) |
| Podoplanin | Dako | D2-40 | Ready to use | Heating (pH9) |
| FSP1 | Dako | Polyclonal | 1:400 | Heating (pH6) |
| AEBP1 | Abcam | ab54820 | 1:100 | Heating (pH6) |
| ZEB1 | Sigma-Aldrich | Polyclonal | 1:200 | Heating (pH9) |
| TWIST | Abcam | Twist2C1a | 1:500 | Heating (pH9) |
Quantitative analysis of α-SMA, CD10, podoplanin, FSP1, AEBP1, ZEB1, and TWIST1 expression was performed using digital pathology with Aperio software (Leica Biosystems). Tissue sections were scanned on an Aperio AT2 scanner with an average scan time of 120 s (compression quality: 70). Images were analyzed using color deconvolution and colocalization. The Aperio Pixel Count v9 Algorithm in Aperio Image Analysis software (for cytoplasmic analysis) was used, and the Nuclear v9 algorithm was applied to detect the nuclear staining of individual tumor cells in the selected regions for nuclear analysis. The intensity of staining was measured on a continuous scale from 0 (black) to 255 (bright white) and was automatically calculated by the software as the ratio of positively stained nuclei to all nuclei (negative, well, moderate, strong, and very strong). Greater than “moderate intensity” (moderate, strong, and very strong) was considered to be positive. Stained areas were color separated from hematoxylin-counterstained sections and measured by the software. Then, the score for the area of the positively stained cells (percentage of positive cells) was based on the average score observed in 10 hot spots at 400×. Based on the cell staining proportion, all cases were individually classified as 0 (less than 1%), 1+ (1% ≤ positive tumor cells < 25%), 2+ (25% ≤ positive tumor cells < 50%), 3+ (50% ≤ positive tumor cells < 75%), and 4+ (≥ 75%) based on the cytoplasm/nuclear staining intensity and completeness. Representative images are shown in Figure 1.
Representative illustration of submucosal invasive colorectal cancer with lymph node metastasis. a. HE section. b. α-SMA staining, showing 84.1% expression. c. CD10 staining, showing 67.8% expression. d. Podoplanin staining, showing 85.8% level. e. FSP1 staining, showing 41.6% expression. f. AEBP1 staining, showing 42.8% expression. g. Zeb1 staining, showing 51.8% expression. h. Twist staining, showing 13.3% expression.
Hierarchical analysis of the expression of CAF and EMT markers
Hierarchical cluster analysis was performed for clustering of the samples according to the above scoring (0-4+) in order to achieve maximal homogeneity for each group and the greatest difference between the groups using open-access clustering software (Cluster 3.0 software; bonsai.hgc.jp/~mdehoon/software/cluster/software.htm). The clustering algorithm was set to centroid linkage clustering, which is the standard hierarchical clustering method used in biological studies.
Statistical analysis
Data were analyzed using Stat Mate-III software (Atom, Tokyo, Japan). Data obtained for clinicopathological features (sex, macroscopic type, location, histological type, classification of submucosal invasion, and lymph node metastasis) and immunohistochemical patterns of CAFs (i.e., α-SMA, CD10, podoplanin, FSP1, AEBP1) and EMT-related proteins (TWIST1 and ZEB1) based on each subgroup were analyzed using chi-squared tests.
For statistical analysis of the expression of α-SMA, CD10, podoplanin, FSP1 (S100A4), and AEBP1 for CAFs and ZEB1 and TWIST1 in SiCRC and their associations with various clinicopathological factors and lymph node metastasis, we used χ2 tests, Fisher's exact tests, and Mann-Whitney U-tests with a 2 × 2 table to compare the categorical data. Univariate and multivariate analyses were conducted with logistic regression tests to identify statistical differences for prediction of lymph node metastasis. The level of significance was P < 0.05, and the confidence interval (CI) was determined at the 95% level. Statistical analyses were performed with the JMP 10.0 software package (SAS Institute, Inc., Cary, NC, USA) for Mac.
Results
The expression of α-SMA, AEBP1, and ZEB1 was diffusely observed in the invasive area, whereas that of CD10, podoplanin, FSP1, and TWIST1 was heterogeneously observed in the same area. In the present study, in such cases, the primary “hot spot” of immunostaining was selected.
1. Hierarchical clustering based on marker scores
First, we performed hierarchical clustering based on marker scores to evaluate differences in expression patterns of CAFs- and EMT-related markers in patients with SiCRC. Four distinct subgroups emerged, as shown in Figure 2. The vertical line shows the expression of each marker in fibroblasts, and the horizontal lines denote “relatedness” between samples.
Hierarchical cluster analysis of submucosal invasive colorectal cancer (SiCRC) based on the expression patterns of cancer-associated fibroblast (CAF)- and EMT-related proteins. The examined SiCRCs were subclassified into 4 subgroups.
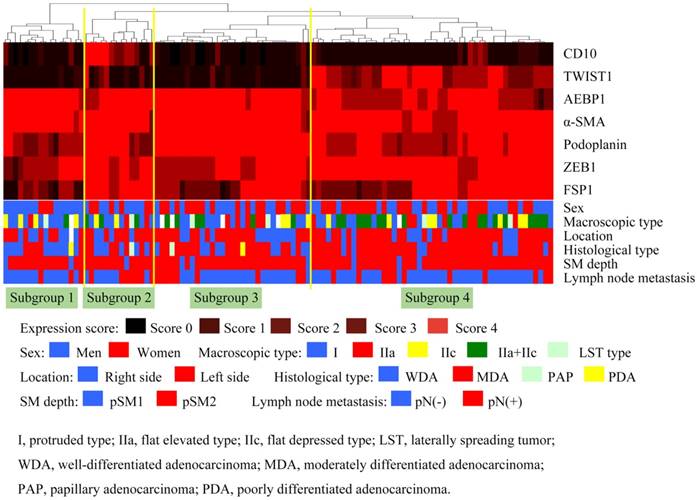
Subgroup 1 was characterized by high expression of α-SMA, AEBP1, and ZEB1 and low expression of CD10, podoplanin, and TWIST1 (Figure 3), whereas subgroup 2 was closely associated with high expression of α-SMA, CD10, podoplanin, FSP1, AEBP1, ZEB1, and TWIST1 (Figure 3). In addition, significantly high expression of α-SMA, podoplanin, AEBP1, and ZEB1 was observed in subgroup 3 (Figure 3), and high expression of α-SMA, podoplanin, FSP1, AEBP1, ZEB1, and TWIST1 and low expression of CD10 were distinctive features in subgroup 4 (Figure 3).
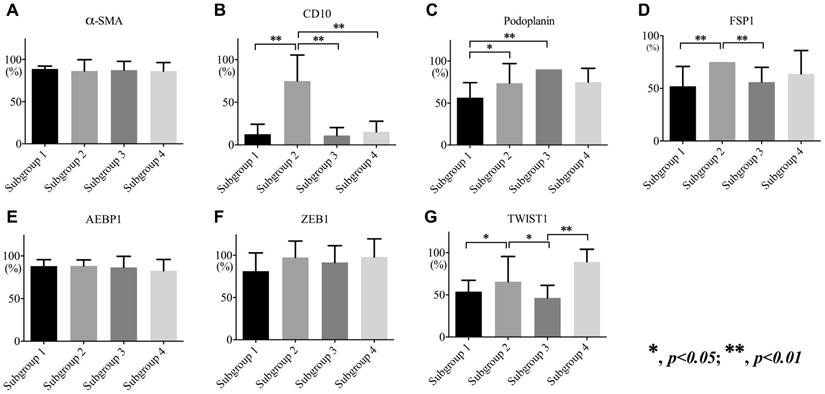
Expression levels of α-SMA (a), CD10 (b), podoplanin (c), FSP1 (d), AEBP1 (e), ZEB1 (f), and TWIST1 (g) in each subgroup.
1-a. Association of the expression of CAF- and EMT-related markers with each subgroup
The frequency in CD10 expression of fibroblasts in subgroup 2 was significantly higher than that in subgroups 1, 3, and 4 (p < 0.01). There were significant differences in the frequencies of podoplanin expression between subgroups 2, 3, and 1 (subgroup 1 < subgroups 2 and 3; p < 0.01 and 0.05). Furthermore, FSP1 expression was significantly higher in subgroup 2 than in subgroups 1 and 3 (p < 0.01). Although there were significant differences in the expression of TWIST1 between subgroup 2 and subgroups 1, 3, and 4 (p < 0.05 and p < 0.01), no differences were observed in the expression of ZEB1 among subgroups. The associations are shown in Figure 3.
1-b. Association of clinicopathological variables and expression patterns of CAF- and EMT-related markers with lymph node metastasis in SiCRC using univariate and multivariate analyses
To determine whether the clinicopathological variables and expression patterns of CAF- and EMT-related markers were independent predictors of lymph node metastasis among patients with SiCRC, we used univariate analysis for preliminary screening of the variables, followed by a stepwise logistic regression of the risk of mortality with the significant univariate predictors. The univariate analysis (Table 3a) identified 5 factors, including age, tumor location, histological type, subgroup 1 versus 2, subgroup 2 versus 3, and subgroup 4 versus 2, as associated with increased lymph node metastasis in patients with SiCRC.
Univariate and multivariate regression analysis of relationships between lymph node metastasis and clinicopathological factors, subgroup classification
| a. | b. | |||||||
|---|---|---|---|---|---|---|---|---|
| Variables | Univariate regression | Multivariate regression | ||||||
| OR | 95% CI | P value | OR | 95% CI | P value | |||
| Sex | Men vs Women | 1.341 | 0.5657-3.1784 | 0.5052 | 2.9363 | 0.8322-10.3605 | 0.094 | |
| Age (year) | 1.0547 | 1.0095-1.1019 | 0.0136 | 1.042 | 0.9807-1.1072 | 0.0857 | ||
| Size (mm) | 1.0147 | 0.9827-1.0564 | 0.3954 | 1.0082 | 1.0654-0.9918 | 0.1769 | ||
| Site | Right vs Left | 3.7959 | 1.3130-13.8392 | 0.0123 | 4.4896 | 0.7479-26.9502 | 0.1005 | |
| Microscopic type | I vs IIc | 0.1041 | 0.01239-0.8743 | 0.0372 | 0.2629 | 0.01839-3.7578 | 0.3249 | |
| IIc vs IIa+IIc | 8.5000 | 0.9708-72.4243 | 0.0532 | 3.3592 | 0.2519-44.7973 | 0.3593 | ||
| Histologic type | WDA vs MDA | 3.000 | 0.9357-9.6181 | 0.0016 | 5.3146 | 0.8776-32.1840 | 0.0691 | |
| pSM depth | pSM1 vs pSM2 | 2.589 | 0.4318-49.5508 | 0.3342 | 1.9859 | 0.1449-27.2242 | 0.6075 | |
| Lymph vessel invasion | Low vs High | 4.680 | 0.73954-29.6163 | 0.1011 | 2.2791 | 0.1327-39.1316 | 0.5701 | |
| Venous invasion | Low vs High | 2.280 | 0.47736-10.8900 | 0.3016 | 1.779 | 0.0233-13.5495 | 0.7227 | |
| Tumor budding | Grade 1 vs 2 | 1.4444 | 0.3348-9,9812 | 0.6453 | 7.4263 | 0.4455-123.7920 | 0.1625 | |
| Subgroup | Subgroup 1 vs 2 | 6.000 | 1.1717-30.7246 | 0.0315 | 4.7729 | 0.4148-54.9239 | 0.2099 | |
| Subgroup 3 vs 2 | 4.3125 | 1.1644-15.9717 | 0.0287 | 5.9167 | 0.8423-41.5633 | 0.0739 | ||
| Subgroup 4 vs 2 | 7.3125 | 2.0273-26.3760 | 0.0024 | 15.2232 | 2.2060-105.0544 | 0.0057 | ||
Macroscopic type: I, protruded type; IIa, flat elevated type; IIc, flat depressed type; LST, laterally spreading tumor; WDA, well-differentiated adenocarcinoma; MDA, moderately differentiated adenocarcinoma; PAP, papillary adenocarcinoma; POR, poorly differentiated adenocarcinoma.
Table 3b shows the single factor that was retained in the multivariate logistic regression analysis. We found that subgroup 4 versus 2 (odds ratio, 15.2332; 95% CI, 2.2060-105.0544; p < 0.0057) remained significant predictors of lymph node metastasis, even after controlling for the other variables. These results are summarized in Table 3.
1-c. Association of clinicopathological variables with the different subgroups
There was a significant difference in the frequency of tumor location (left versus right) between subgroups 2 and 4 (subgroup 4 > subgroup 2; p < 0.05; Table 4). The frequency of moderately differentiated type adenocarcinoma was significantly higher in subgroup 4 than in subgroup 1 (p < 0.01; Table 4). In addition, a significant difference in the frequency of lymph node metastasis between subgroups 2 and 4 was found (subgroup 2 > subgroup 4; Table 4). However, there was no significant difference in the frequency of submucosal depth and tumor budding among subgroups (Table 4).
Comparison of clinicopathological findings in each subgroup
| Total | Subgroup 1 (%) | Subgroup 2 (%) | Subgroup 3 (%) | Subgroup 4 (%) | p value | ||
|---|---|---|---|---|---|---|---|
| Total | 109 | 15 (13.8) | 15 (13.8) | 32 (43.0) | 47 (43.1) | ||
| Sex | Men : Women | 57 : 52 | 13 : 2 | 8 : 7 | 15 : 17 | 21 : 26 | N. S. |
| Age (year) | Range (median) | 40-93 (67.0) | 55-85 (71.5) | 46-79 (70.4) | 44-79 (64.5) | 40-78 (67.9) | N. S. |
| Site | Right | 40 (36.7) | 7 (46.7) | 10 (66.7) | 12 (37.5) | 11 (23.4) | < 0.05 |
| Left | 69 (63.3) | 8 (53.3) | 5 (33.3)** | 20 (62.5) | 36 (76.6)** | ||
| Macroscopic type | 0-I type | 37 (33.9) | 8 (53.3) | 6 (40.0) | 11 (34.3) | 12 (29.8) | N. S. |
| 0-IIa type | 24 (22.0) | 1 (6.7) | 2 (13.3) | 11 (34.3) | 10 (21.3) | ||
| 0-IIc type | 16 (14.7) | 4 (26.7) | 2 (13.3) | 3 (9.4) | 7 (14.9) | ||
| 0-IIa+IIc type | 28 (25.7) | 1 (6.7) | 4 (26.6) | 5 (15.7) | 17 (36.2) | ||
| LST type | 5 (4.6) | 1 (6.7) | 1 (6.7) | 2 (6.3) | 1 (2.1) | ||
| Histological type | WDA | 36 (33.0) | 9 (60.0) | 7 (46.7) | 11 (34.3) | 9 (19.1) | < 0.01 |
| MDA | 69 (63.3) | 5 (33.3)* | 7 (46.7) | 19 (59.4) | 38 (80.9)* | ||
| PAP | 2 (1.8) | 0 | 1 (6.7) | 1 (3.1) | 0 | ||
| POR | 2 (1.8) | 1 (6.7) | 0 | 1 (3.1) | 0 | ||
| pSM depth | pSM1 | 8 (7.3) | 1 (6.7) | 1 (6.7) | 4 (12.5) | 2 (4.3) | N. S. |
| pSM2 | 101 (92.7) | 14 (93.3) | 14 (93.3) | 28 (87.5) | 45 (95.7) | ||
| Lymphatic invasion | Low | 104 (95.4) | 14 (93.3) | 15 | 29 (90.6) | 46 | N. S. |
| High | 5 (4.6) | 1 (6.7) | 0 | 3 (9.4) | 1 | ||
| Venous invasion | Low | 102 (93.6) | 14 (93.3) | 15 | 28 (87.5) | 45 (95.7) | N. S. |
| High | 7 (6.4) | 1 (6.7) | 0 | 4 (12.5) | 2 (4.3) | ||
| pN | pN0 | 80 (73.4) | 12 (80.0) | 6 (40.0) | 24 (75.0) | 38 (80.9) | < 0.05 |
| pN1 | 29 (26.6) | 3 (20.0) | 9 (60.0)*, ** | 8 (25.0)* | 9 (19.1)** | ||
| Tumor budding | Low | 99 (90.8) | 14 (93.3) | 13 (86.7) | 29 (90.6) | 43 (91.5) | N. S. |
| High | 10 (9.2) | 1 (6.7) | 2 (13.3) | 3 (9.4) | 4 (8.5) |
*: p < 0.05, **: p < 0.01
Macroscopic type: I, protruded type; IIa, flat elevated type; IIc, flat depressed type; LST, laterally spreading tumor; WDA, well-differentiated adenocarcinoma; MDA, moderately differentiated adenocarcinoma; PAP, papillary adenocarcinoma; POR, poorly differentiated adenocarcinoma.
2. Association of clinicopathological variables and expressions of individual CAF- and EMT-related marker with lymph node metastasis in SiCRC using univariate and multivariate analyses
We analyzed the associations of expression of individual markers with lymph node metastasis in SiCRC. Although univariate analysis revealed that several clinicopathological factors, including age, tumor location, histological type, and CD10 and podoplanin expression, were significantly associated with lymph node metastasis (Table 5a; p < 0.05), these factors, with the exception of histological type, were not retained in multivariate analysis (Table 5b). A significant difference was observed in histological type (well differentiated versus moderately differentiated) between SiCRCs with and without lymph node metastasis (p < 0.05). These relationships are depicted in Table 5.
Univariate and multivariate regression analysis of the relationships between lymph node metastasis and clinicopathological factors, expression of CAFs and EMT markers
| a. | b. | |||||||
|---|---|---|---|---|---|---|---|---|
| Variables | Univariate regression | Multivariate regression | ||||||
| OR | 95% CI | P value | OR | 95% CI | P value | |||
| Sex | Men vs Women | 1.341 | 0.5657-3.1784 | 0.5052 | 3.9628 | 0.6684-23.4957 | 0.1060 | |
| Age (year) | 1.0547 | 1.0095-1.1019 | 0.0136 | 1.0830 | 0.8333-1.0085 | 0.0774 | ||
| Size (mm) | 1.0147 | 0.9827-1.0564 | 0.3954 | 1.0223 | 0.9078-1.0566 | 0.5433 | ||
| Site | Right vs Left | 3.7959 | 1.3130-13.8392 | 0.0123 | 4.4896 | 0.7479-26.9502 | 0.1005 | |
| Microscopic type | I vs IIc | 0.1041 | 0.01239-0.8743 | 0.0372 | 0.1035 | 0.2066-452.02 | 0.2476 | |
| IIc vs IIa+IIc | 8.5000 | 0.9708-74.4243 | 0.0532 | 0.09135 | 0.0018-4.6766 | 0.2334 | ||
| Histologic type | WDA vs MDA | 3.000 | 0.9357-9.6181 | 0.0016 | 50.9464 | 1.7405-1491.2263 | 0.0225 | |
| pSM depth | pSM1 vs pSM2 | 2.589 | 0.4318-49.5508 | 0.3342 | 22.8022 | 0.4064-1279.43 | 0.1281 | |
| Lymph vessel invasion | Low vs High | 4.680 | 0.73954-29.6163 | 0.1011 | 6.9505 | 0.0023-8.8773 | 0.3566 | |
| Venous invasion | Low vs High | 2.280 | 0.47736-10.8900 | 0.3016 | 2.6893 | 0.0062-22.3959 | 0.6361 | |
| Tumor budding | Grade 1 vs 2 | 1.4444 | 0.3348-9.9812 | 0.6453 | 31.7338 | 0.0011-0.9364 | 0.0457 (CI: -7.5030 - -0.4963)* | |
| αSMA | 0.6895 | 0.16282-12.9186 | 0.7334 | 1.2396 | 0.3130-2.0184 | 0.6432 | ||
| CD10 | 1.2747 | 1.05536-1.5607 | 0.0120 | 1.4922 | 1.10196-2.3862 | 0.0604 | ||
| Podoplanin | 0.1077 | 1.2364-69.7862 | 0.0181 | 1.4169 | 0.8990-2.4065 | 0.1563 | ||
| FSP1 | 1.0127 | 0.8635-1.1934 | 0.8773 | 1.2247 | 0.8635-1.7818 | 0.2635 | ||
| AEBP1 | 0.9467 | 0.76339-1.1961 | 0.6301 | 0.7447 | 0.4821-1.0967 | 0.1467 | ||
| TWIST1t | 1.4703 | 0.4556-5.1679 | 0.5255 | 1.0073 | 0.7413-1.3684 | 0.962 | ||
| ZEB1 | 0.0809 | 0.6266-1.043821 | 0.1051 | 5.8386 | 0.0455-0.4342 | 0.0016 (CI: -3.0910 - -0.8342)* | ||
Macroscopic type: I, protruded type; IIa, flat elevated type; IIc, flat depressed type; OR, odds ratio; WDA, well-differentiated adenocarcinoma; MDA, moderately differentiated adenocarcinoma; CI, confidence interval; *, not significant.
Discussion
The risk of lymph node metastasis in SiCRC is estimated to be 10-15%. [1, 2, 3] Although several attempts have been made to predict the risk of lymph node metastasis in SiCRCs [1-3], it is still unclear which method is the best for predicting lymph node metastasis [3, 4]. Previous studies have shown that submucosal invasion depth, lymphatic/vascular invasion, tumor differentiation (poorly differentiated versus differentiated), and tumor budding were significantly associated with lymph node metastasis [25]. However, there are some problems with determining the risk of lymph node metastasis in SiCRCs [25]. For example, measurement of the depth of submucosal invasion when the muscularis mucosa is completely disrupted by tumor invasion may be inconsistent between pathologists [2, 3]. In addition, although desmoplasia is defined as active fibroblastic (myofibroblastic) proliferation at the invasive area, desmoplasia may not be a reliable marker to predict lymph node metastasis. In this study, we aimed to predict lymph node metastasis in patients with SiCRC using a new biological approach (expression patterns of CAF- and EMT-related markers in fibroblasts surrounding cancer nests at the invasive area).
CAFs are defined as proliferative fibroblasts in the invasive area [26, 27]. This definition is similar to that of desmoplasia, which is proliferation of active fibroblasts that express α-SMA and exhibit loss of desmin [26, 27]. In the present study, the CAFs we examined were similar to desmoplastic fibroblasts, showing extensive expression of α-SMA, which characterizes desmoplastic fibroblasts. Although desmplasia is closely associated with tumor invasion, the presence of desmoplasia alone cannot predict lymph node metastasis in SiCRC given that desmoplasia was a common finding in the submucosal area in the present study. Therefore, our current findings revealed an important alternative for predicting lymph node metastasis in SiCRC.
To examine CAFs in tumors, a specific marker for CAFs is needed [10-13]. The most widely used marker for CAFs is α-SMA, a specific marker of myofibroblasts [11-13]. Additional markers for CAFs include CD10 [28, 29], podoplanin [30], FSP1 [24, 31], and AEBP1; these markers are also thought to be associated with tumor invasion and metastasis [32, 33]. In addition, EMT-related markers, including TWIST1 [34] and ZEB1 [35], were also used in the present study because EMT-related proteins may also be markers of CAFs (e.g., co-expression of CAF- and EMT-related proteins is observed in the same fibroblasts). The antibodies we used in this study are widely available and are reliably and reproducibly used in studies of CRC [24, 28, 31, 32]. Thus, these markers, i.e., α-SMA, CD10, podoplanin, FSP1, AEBP1, TWIST1, and ZEB1, are thought to be suitable for identifying the roles of CAFs and the EMT in SiCRC.
We attempted to identify differences in the expression patterns of CAF- and EMT-related proteins in patients with SiCRC based on hierarchical clustering. As a result, each subgroup was stratified according to the expression patterns of CAF- and EMT-related markers. In the present study, tumors in subgroup 2 were closely associated with lymph node metastasis compared with those in subgroup 4, as supported by the finding that subgroup 2 was retained in the multivariate logistic regression analysis. Thus, high expression of all of the examined markers (pattern of subgroup 2) may contribute to lymph node metastasis in SiCRC.
In the present study, the expression of α-SMA, AEBP1, and ZEB1 was commonly found in all subgroups, suggesting that these proteins play a common role in the formation of the submucosal invasive area. Although α-SMA has been shown to label smooth muscle cells in the muscularis mucosae and muscularis propria as well as CAFs, [11, 12] α-SMA may confer cellular mobility as a basic function in the tumor microenvironment [34]. AEBP1 was originally reported as a novel pro-inflammatory mediator that induces nuclear factor-κB activity [32, 33, 37] and is expressed in many tissues [32, 33], with highest expression observed in pre-adipocytes and macrophages of the mammary stroma [32, 33]. AEBP1 plays a critical role in a subset of human tumors, as supporting by the finding that AEBP1 is upregulated in the tumor tissue [32, 33, 37]. However, the role of this marker in CAFs remains unknown. In fact, very few studies have focused on the expression of AEBP1 in CAFs. Our present findings suggested that this marker may be useful for labeling CAFs in the microenvironment of the invasive area. ZEB1 is also a common marker of the microenvironment of the invasive area in the submucosal region and indicates the occurrence of the EMT and cellular senescence [36, 37]. In previous studies, the expression of ZEB1 has suggested that the EMT may be associated with the formation of submucosal invasion [38, 39]. Taken together, our findings showed that several markers, including α-SMA, AEBP1, and ZEB1, contribute to the microenvironment of submucosal invasion.
The expression of CD10 in tumor cells is thought to predict poor prognosis in patients with CRC [40], although contrasting data have also been reported [41]. These findings were supported by the observation that CD10 expression in CRC cells enhances liver metastasis [42]. In addition, CD10 status is not significantly associated with lymph node metastasis and is no better than lymphovascular invasion alone when predicting lymph node status [41]. However, the role of CD10 expression in CAFs is not understood, and CD10 expression in CAFs has not been recognized as an important parameter to date [43]. In the present study, we did not find that expression of CD10, which characterizes tumors in subgroup 2 (a subgroup predicting lymph node metastasis in SiCRC), was an important marker for CAFs for prediction of lymph node metastasis in SiCRC. Thus, further studies are needed to determine the usefulness of CD10 expression as a CAF-associated marker.
Histological parameters are simple and easy to determine them in routine pathological diagnosis [1, 2, 3]. In the present study, although histological type (well differentiated versus moderately differentiated type) was useful for predicting lymph node metastasis in the analysis of individual markers, tumor budding (low versus high) was not significant. It is well accepted that tumor budding is an important additional prognostic factor for patients with CRC [40]. Although a recent study showed that a high level of tumor budding is closely associated with lymph node metastasis in SiCRC [44], the decision regarding the identification of tumor budding is known to show intra-observer variation [44]. Thus, we suggest that the differences between the previous study and our current data may have resulted from intra- and/or interobserver variations. On the other hand, it is not clear whether histological type (differentiated-type) is correlated with lymph node metastasis in SiCRC. In the present study, histological type was not correlated with lymph node metastasis in multivariate analysis of expression patterns defined by hierarchical clustering based on marker scores but was significantly associated with lymph node metastasis in multivariate analysis of the expression of individual markers. Although the reason for this difference is unclear, tumor differentiation (or tumor grade, well versus moderately differentiated) may be associated with expression patterns of CAF markers.
There were some limitations to the present study. First, if immunostaining was heterogeneous in the invasive area, interpretation of the immunostaining was limited in biopsy specimens. However, if the “hot spot” region was observed in the submucosal invasive area, expression of CAF- and EMT-related markers may help to predict lymph node metastasis in SiCRC. Second, in the present study, we used specimens collected during operation to examine CAF- and EMT-related proteins in SiCRC; specimens obtained from endoscopic materials were not used in the present study. Further studies are needed to predict lymph node metastasis in SiCRC using endoscopic specimens.
In conclusion, we studied the expression patterns of CAF- and EMT-related proteins in submucosal CRCs using hierarchical cluster analysis. Consequently, four distinct subgroups were categorized as SiCRC based on the expression patterns of CAF- and EMT-related markers. Subgroup 2 was characterized by frequent expressions of all 6 markers, with particularly high expression of CD10 and FSP1. In addition, subgroup 2 was correlated with lymph node metastasis of SiCRC compared with subgroup 4. Finally, tumor differentiation was correlated with lymph node metastasis in SiCRC in the analysis of individual markers. Thus, we showed that stratification of the expression patterns of CAF- and EMT-related markers and specific expression of the biomarkers we analyzed provided insights into the prediction of lymph node metastasis in patients with SiCRC.
Abbreviations
AEBP1: adipocyte enhancer-binding protein 1; CAF: cancer associated fibroblast; CRC: colorectal cancer; EMT: epithelial-mesenchymal transition; FSP1 (S100A4): fibroblast specific protein 1; SiCRC: submucosal invasive colorectal cancer; TMAs: tissue microarrays; Twist 1: Twist-related protein 1; ZEB: Zinc finger E-box binding homeobox 1.
Acknowledgements
We gratefully acknowledge the technical assistance of members of the Department of Molecular Diagnostic Pathology, Iwate Medical University for their support.
Human rights statement and informed consent
All procedures were performed in accordance with the ethical standards of the Iwate Medical University and with the Declaration of Helsinki. Substitute for informed consent (approval by the institutional review board of Iwate Medical University) was obtained from all patients included in the study.
Author contributions
Sugai T, who is the first and corresponding author, contributed to the preparation of the manuscript, including all aspects of data collection and analysis. Uesugi N and Kitada Y constructed the Figures and Tables and performed statistical analysis. Osakabe M supported statistical analysis. Matsumoto T and Suzuki H provided input during the preparation of the manuscript. Eizuka M, Sugimoto R, and Fujita Y provided support for experiments involving pathological technologies. Kawasaki K, Yamano H and Yamamoto E assisted with clinical data.
Competing Interests
The authors have declared that no competing interest exists.
References
1. Morson BC, Whiteway JE, Jones EA. et al. Histopathology and prognosis of malignant colorectal polyps treated by endoscopic polypectomy. Gut. 1984;25:437-444
2. Fujimori T, Kawamata H, Kashida H. Precancerous lesions of the colorectum. J Gastroenterol. 2001;36:587-594
3. Sohn DK, Chang HJ, Park JW. et al. Histopathological risk factors for lymph node metastasis in submucosal invasive colorectal carcinoma of pedunculated or semipedunculated type. J Clin Pathol. 2007;60:912-915
4. Tateishi Y, Nakanishi Y, Taniguchi H. et al. Pathological prognostic factors predicting lymph node metastasis in submucosal invasive (T1) colorectal carcinoma. Mod Pathol. 2010;23:1068-1072
5. Kikuchi R, Takano M, Takagi K. et al. Management of early invasive colorectal cancer. Risk of recurrence and clinical guidelines. Dis Colon Rectum. 1995;38:1286-1295
6. Kawamura YJ, Sakuragi M, Togashi K. et al. Distribution of lymph node metastasis in T1 sigmoid colon carcinoma: should we ligate the inferior mesenteric artery? Scand J Gastroenterol. 2005;40:858-861
7. Huh JW, Kim HR, Kim YJ. Lymphovascular or perineural invasion may predict lymph node metastasis in patients with T1 and T2 colorectal cancer. J Gastrointest Surg. 2010;14:1074-1080
8. Ribeiro MS, Wallace MB. Endoscopic treatment of early cancer of the colon. Gastroenterol Hepatol (N Y). 2015;11:445-452
9. Sugai T, Habano W, Uesugi N. et al. Molecular validation of the modified Vienna classification of colorectal tumors. J Mol Diagn. 2002;4:191-200
10. Shiga K, Hara M, Nagasaki T. et al. Cancer-associated fibroblasts: their characteristics and their roles in tumor growth. Cancers (Basel). 2015;7:2443-2458
11. Kalluri R, Zeisberg M. Fibroblasts in cancer. Nat Rev Cancer. 2006;6:392-401
12. Tommelein J, Verset L, Boterberg T. et al. Cancer-associated fibroblasts connect metastasis-promoting communication in colorectal cancer. Front Oncol. 2015;5:63
13. Isella C, Terrasi A, Bellomo SE. et al. Stromal contribution to the colorectal cancer transcriptome. Nat Genet. 2015;47:312-319
14. Calon A, Lonardo E, Berenguer-Llergo A. et al. Stromal gene expression defines poor-prognosis subtypes in colorectal cancer. Nat Genet. 2015;47:320-329
15. Herrera M, Herrera A, Domínguez G. et al. Cancer-associated fibroblast and M2 macrophage markers together predict outcome in colorectal cancer patients. Cancer Sci. 2013;104:437-444
16. Busch EL, McGraw KA, Sandler RS. The potential for markers of epithelial-mesenchymal transition to improve colorectal cancer outcomes: a systematic review. Cancer Epidemiol Biomarkers Prev. 2014;23:1164-1175
17. Gurzu S, Silveanu C, Fetyko A. et al. Systematic review of the old and new concepts in the epithelial-mesenchymal transition of colorectal cancer. World J Gastroenterol. 2016;22:6764-6775
18. Zlobec I, Lugli A. Epithelial mesenchymal transition and tumor budding in aggressive colorectal cancer: tumor budding as oncotarget. Oncotarget. 2010;1:651-661
19. Fleming M, Ravula S, Tatishchev SF. et al. Colorectal carcinoma: pathologic aspects. J Gastrointest Oncol. 2012;3:153-173
20. Marzouk O, Schofield J. Review of histopathological and molecular prognostic features in colorectal cancer. Cancers (Basel). 2011;3:2767-2810
21. Japanese Society for Cancer of the Colon and Rectum. Japanese Classification of Colorectal Carcinoma, Second English Edition. Tokyo: Kanehara Co. 2009 p. 30-63
22. Satoh K, Nimura S, Aoki M. et al. Tumor budding in colorectal carcinoma assessed by cytokeratin immunostaining and budding areas: possible involvement of c-Met. Cancer Sci. 2014;105:1487-1495
23. Yamada N, Sugai T, Eizuka M. et al. Tumor budding at the invasive front of colorectal cancer may not be associated with the epithelial-mesenchymal transition. Hum Pathol. 2017;60:151-159
24. Sugai T, Yamada N, Eizuka M. et al. Vascular invasion and stromal S100A4 expression at the invasive front of colorectal cancer are novel determinants and tumor prognostic markers. J Cancer. 2017;8:1552-1561
25. Beaton C, Twine CP, Williams GL. et al. Systematic review and meta-analysis of histopathological factors influencing the risk of lymph node metastasis in early colorectal cancer. Colorectal Dis. 2013;15:788-797
26. Sinn M, Denkert C, Striefler JK. et al. α-Smooth muscle actin expression and desmoplastic stromal reaction in pancreatic cancer: results from the CONKO-001 study. Br J Cancer. 2014;111:1917-1923
27. Conti J, Thomas G. The role of tumour stroma in colorectal cancer invasion and metastasis. Cancers (Basel). 2011;3:2160-2168
28. Nishihara Y, Aishima S, Hayashi A. et al. CD10+ fibroblasts are more involved in the progression of hilar/extrahepatic cholangiocarcinoma than of peripheral intrahepatic cholangiocarcinoma. Histopathology. 2009;55:423-431
29. Cui L, Ohuchida K, Mizumoto K. et al. Prospectively isolated cancer-associated CD10(+) fibroblasts have stronger interactions with CD133(+) colon cancer cells than with CD133(-) cancer cells. PLoS One. 2010;5:e12121
30. Shindo K, Aishima S, Ohuchida K. et al. Podoplanin expression in cancer-associated fibroblasts enhances tumor progression of invasive ductal carcinoma of the pancreas. Mol Cancer. 2013;12:168-183
31. Choi SY, Sung R, Lee SJ. et al. Podoplanin, α-smooth muscle actin or S100A4 expressing cancer-associated fibroblasts are associated with different prognosis in colorectal cancers. J Korean Med Sci. 2013;28:1293-1301
32. Holloway RW, Bogachev O, Bharadwaj AG. et al. Stromal adipocyte enhancer-binding protein (AEBP1) promotes mammary epithelial cell hyperplasia via proinflammatory and hedgehog signaling. J Biol Chem. 2012;287:39171-39181
33. Torres S, Bartolomé RA, Mendes M. et al. Proteome profiling of cancer-associated fibroblasts identifies novel proinflammatory signatures and prognostic markers for colorectal cancer. Clin Cancer Res. 2013;19:6006-6019
34. Deng JJ, Zhang W, Xu XM. et al. Twist mediates an aggressive phenotype in human colorectal cancer cells. Int J Oncol. 2016;48:1117-1124
35. Liu Y, El-Naggar S, Darling DS. et al. Zeb1 links epithelial-mesenchymal transition and cellular senescence. Development. 2008;135:579-588
36. Majdalawieh A, Zhang L, Ro HS. Adipocyte enhancer-binding protein-1 promotes macrophage inflammatory responsiveness by up-regulating NF-kappaB via IkappaBalpha negative regulation. Mol Biol Cell. 2007;18:930-942
37. Underwood TJ, Hayden AL, Derouet M. et al. Cancer-associated fibroblasts predict poor outcome and promote periostin-dependent invasion in oesophageal adenocarcinoma. J Pathol. 2015;235:466-477
38. Zhang W, Shi X, Peng Y. et al. HIF-1α promotes epithelial-mesenchymal transition and metastasis through direct regulation of ZEB1 in colorectal cancer. PLoS One. 2015;10:e0129603
39. Qin Y, Tang B, Hu CJ. et al. An hTERT/ZEB1 complex directly regulates E-cadherin to promote epithelial-to-mesenchymal transition (EMT) in colorectal cancer. Oncotarget. 2016;7:351-361
40. Fujimoto Y, Nakanishi Y, Sekine S. et al. CD10 expression in colorectal carcinoma correlates with liver metastasis. Dis Colon Rectum. 2005;48:1883-1889
41. Bernescu I, Reichstein AC, Luchtefeld M. et al. Does CD10 expression predict lymph node metastasis in colorectal cancer? Dis Colon Rectum. 2016;59:22-27
42. Kuniyasu H, Luo Y, Fujii K. et al. CD10 enhances metastasis of colorectal cancer by abrogating the anti-tumoural effect of methionine-enkephalin in the liver. Gut. 2010;59:348-356
43. Zhu Y, Zheng JJ, Yang F. et al. Expression of CD10 in cancer-associated fibroblasts and its effect on initiation and progression of colorectal carcinoma. Zhonghua Bing Li Xue Za Zhi. 2016;45:859-865
44. Mitrovic B, Schaeffer DF, Riddell RH. et al. Tumor budding in colorectal carcinoma: time to take notice. Mod Pathol. 2012;25:1315-1325
Author contact
![]() Corresponding author: Tamotsu Sugai, MD, Department of Molecular Diagnostic Pathology, Iwate Medical University, 19-1 Morioka 020-8505, Japan. TEL: +81-19-651-5111; FAX: +81-19-629-1437; E-mail: tsugaiac.jp
Corresponding author: Tamotsu Sugai, MD, Department of Molecular Diagnostic Pathology, Iwate Medical University, 19-1 Morioka 020-8505, Japan. TEL: +81-19-651-5111; FAX: +81-19-629-1437; E-mail: tsugaiac.jp