Impact Factor ISSN: 1837-9664

 Global reach, higher impact
J Cancer 2018; 9(2):400-406. doi:10.7150/jca.21381 This issue Cite
Research Paper
Identification of Biomarker for Cutaneous Squamous Cell Carcinoma Using Microarray Data Analysis
Wei Wei1*, Yan Chen2*, Jie Xu3*, Yu Zhou3, Xinping Bai4, Ming Yang4 ![]() , Ju Zhu4
, Ju Zhu4 ![]()
1. Department of Dermatology, Union Hospital, Tongji Medical College, Huazhong University of Science and Technology, Wuhan, Hubei, China;
2. Oncology Department, Huai'an Second People's Hospital, The Affiliated Huaian Hospital of Xuzhou Medical University, Huai'an, China;
3. Department of Dermatology, The Central Hospital of Wuhan, Tongji Medical College, Huazhong University of Science and Technology, Wuhan, China;
4. Department of Plastic Surgery, The Central hospital of Wuhan, Tongji Medical College, Huazhong University of Science and Technology, Wuhan, China.
* Co-first authors
Received 2017-6-8; Accepted 2017-11-24; Published 2018-1-1
Abstract
Cutaneous squamous cell carcinoma (CSCC) is one of the most malignant tumors worldwide. We aimed to explore the molecular mechanism of this CSCC and screen feature genes that can function as the biomarker of CSCC and thus provide a theoretical basis for the pathogenesis research and development of medicine. The method of microarray data analysis was used in this study to explore the differentially expressed genes between tissues of normal specimens and tissues of patients with CSCC. Besides, functional enrichment analysis and signal pathway were performed on these genes to screen the feature genes that are closely associated with CSCC can function as the potential biomarkers of CSCC.A total of 53 samples from two datasets, GSE45216 and GSE45164, were used in the differentially expressed analysis. And as a result, a total of 833 genes were screened out, including 465 up-regulated genes and 215 down-regulated genes. Candidate genes, including up-regulated genes like S100A12, MMP1, DEFB4B/DEFB4A, KRT16 and PI3, and down-regulated genes like EGR3, LRP4, C14orf132, PAMR1, CCL27, and KRT2 were screened out. All these genes were testified in the dataset of GSE66359. The result showed that only three genes, KRT16, PI3 and EGR3, were mostly differentially expressed and only EGR3 had the same expression pattern with both datasets, GSE45216 and GSE45164.Of note, EGR3 gene was found to be the most differentially expressed gene in cutaneous squamous cell carcinoma, which had the potential to function as the candidate genes and help in the diagnosis and prognostic treatments of CSCC.
Keywords: cutaneous squamous cell carcinoma, microarray data analysis, EGR3, biomarker.
Introduction
Cutaneous squamous cell carcinoma (SCC) is the second most common malignant tumor in the world, just after basal cell carcinoma [1]. Nowadays, more and more people are affected by this disease and white skin patients with immunologic suppressionor chronic skin inflammation disease are more apt to be affected. Besides, it's found that middle-aged and elderly people are relatively more susceptible to this disease compared to younger people. The occurrence of cutaneous squamous cell carcinoma is related to multiple factors. Besides, its diversity clinically and pathologically makes it easy to escape diagnosis or be misdiagnosed [2]. Currently, early diagnosis and prediction and timely treatment are still the most effective measure to improve the survival rate of patients with CSCC and prevent the disease from deteriorating. However, the research on biomarkers of squamous cell carcinoma was rare. Therefore, it is urgent to explore potential biomarker of cutaneous squamous cell carcinoma which can be quite beneficial for improving the clinical management of CSCC.
DNA microarray data is commonly used in clinical research since it can monitor expression levels of thousands of genes at the same time. And it had become a promising and prevailing method used in the identification of differentially expressed genes between normal samples and tumor specimens [3].What's more, this method provides a complete, systematic, and reliable comparison of gene expression between tissue types [4, 5]. Therefore, biological processes and signaling pathway associated with the tumor may be explored by the evidence and clue provided by the DEGs. Recently, several studies indicated that the differentially expressed genes rapid and successful identification using DNA microarray data, such as in the human gliomas [6] and prostate cancer [7], etc.
The main purpose of this study is to explore the molecular mechanism of CSCC and to screen out the feature genes that can function as the biomarker of CSCC and thus provide a theoretical basis for the pathogenesis research and development of medicine. In this study, we came to the conclusion that EGR3 was closely associated with the occurrence of cutaneous squamous cell carcinoma and had the potential to function as the biomarker of CSCC, which could be quite helpful in the diversity clarification of CSCC clinically and histopathologically, therefore helpful in the improvement of prognostic and diagnostic tools and treatment of CSCC in clinical management.
Materials and Methods
Microarray data source
Microarray data was downloaded from GEO (Gene Expression Omnibus) dataset at the website of https://www.ncbi.nlm.nih.gov/geo/. Three separate datasets with the accession number of GSE45216 [8], GSE45164 [9], and GSE66359 [10, 11] were selected for the analysis. There were 30 tumor samples in the GSE45216 dataset and we selected 10 samples with the same background and testing platform in the GSE42677 dataset as the control. GSE45164 and GSE45216 were used in the screening of critical genes. There were three normal specimens and 10 tumor samples in the GSE45164 dataset and there were five normal keratinocyte cells and 8 cutaneous squamous cell carcinoma cells. The testing platforms were Affymetrix Human Genome U133A 2.0 Array and Affymetrix Human Genome U133 Plus 2.0. GSE66359 was used in the testing of gene expression and the platform was Affymetrix Human Genome U133 Plus 2.0 Array.
Data quality control
AffyPLM package [12] was used for the data quality analysis based on the linear model at microarray level. RLE (Relative Log Expression) box figure and NUSE (Normalized Unscaled Standard Errors) figure were painted test the tendency accordance of the testing data. Besides, degradation situation of RNA was tested by AffyRNAdeg function. Finally, high-quality RNA datasets with the same tendency were selected for down-stream analysis.
Data pre-processing
Gcrma package [13] was used in the normalization and background correction of microarray data to ensure the integrity and comparability of the dataset. The error in the microarray and among was eliminated and average value was calculated for the genes that were tested for more than once and the value was used for the down-stream analysis.
Relevance analysis of gene expression level among samples was an essential indicator in the testing of experimental reliability and rationality in sample selection. Therefore, the global and principle component analysis were performed on the testing samples, and the Pearson correlation coefficient was calculated and correlation and distribution figure were painted.
Identification of differentially expressed genes
Limma packages [14] were used in the identification of the differentially expressed genes between samples in the control group and processed samples. Finally, differentially expressed genes with the log 2 value (fold change) larger than 1 and the p-value less than 0.05 were screened out. then, ggplot2, VennDiagram and heatmap in R language were used to paint the volcano, Venn figure and heatmap for the visualization of differentially expressed situation.
Functional enrichment analysis of differentially expressed genes
Pathways and functional enrichment analysis were performed on these differentially expressed genes. Functional Annotation Tool of DAVID (The Database for Annotation, Visualization, and Integrated Discovery) [15] were used in functional annotation and GO/KEGG enrichment analysis. P value before and after correction (Benjamini correction or FDR correction) was calculated by DAVID and p-value less than 0.05 was used as the threshold.
Results
Quality control of data
Regression calculation was used on the raw data by affyPLM in R language. Relative logarithm (RLE) expression box figure (Supplementary Figure 1) and standard deviation chart were painted to test the homogeneity among microarray data. The result of RLE chart showed that the gene expression value of most samples in GSE45216 and GSE45164 datasets were enriched at zero with high accordance, indicating their feasibility for the use of down-stream analysis.
Normalization of data
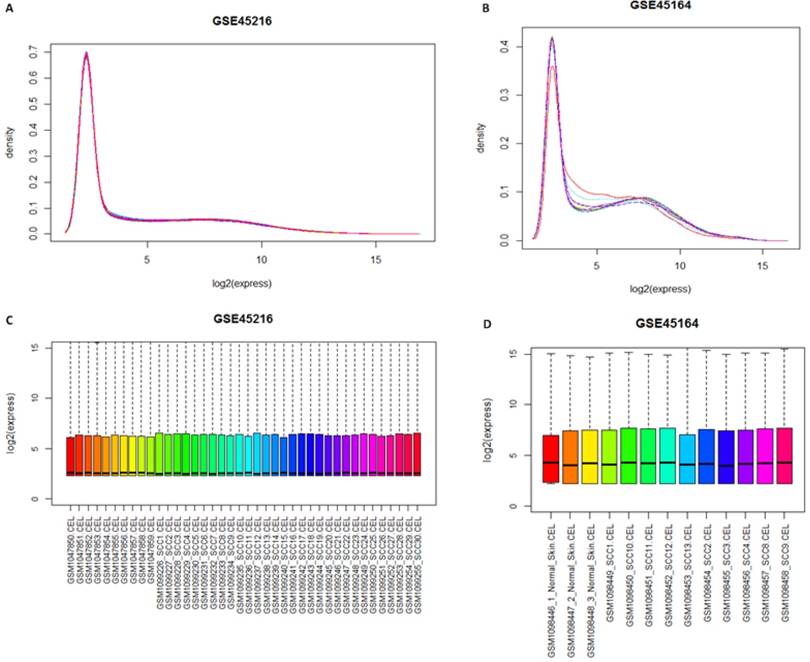
Gcrma package was used for the normalization of samples after the quality screening. Theresult was shown in Figure 1. The result of expression density curve and box plot showed that the expression value in the two groups ranged from 0 to 15, with light variation, which corresponded with reality situation. The expression value of GSE45216 and GSE45164 after normalization was focused at 3. The expression trends of the two sets of microarray datasets are similar.
Distribution figure among samples after normalization. A and B represented the gene expression density curve after microarray data GSE45216 and GSE45164 datasets was standardized, respectively while C and D represented the gene expression box chart after microarray data GSE45216 and GSE45164 datasets was normalized.
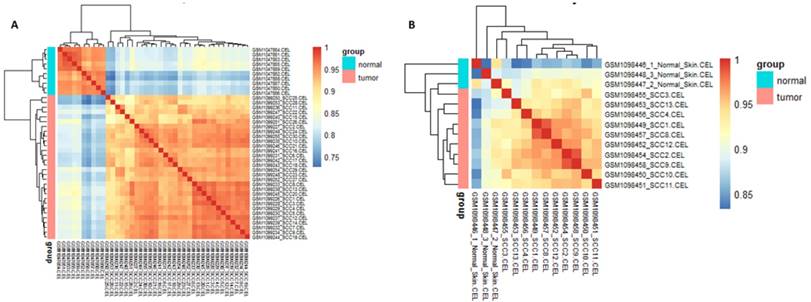
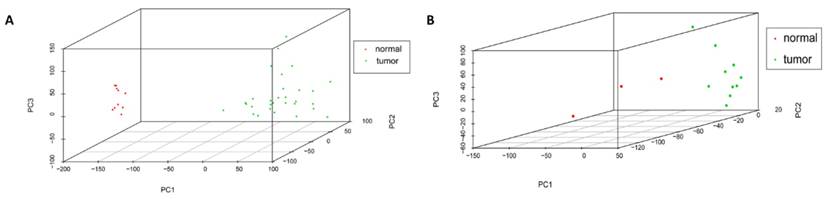
Cor function in R language was used on the expression data after normalization and logarithmic transformation to calculate the pearson correlation coefficient among samples and the correlation coefficient figure was painted subsequently (Figure 2). The minimum value of correlation coefficient in GSE45216 dataset was 0.726 and normal samples and tumor specimens were divided into a different group. The minimum value of correlation coefficient in GSE45216 was 0.832, higher than that of GSE45216 dataset. There was a significant difference in normal tissue samples but the tumor samples can be divided into the same type. Besides, the result of principal component analysis (PCA) had the consistent results (Figure 3).
relevance cluster figure among samples after normalization. A represented the cluster figure of Person correlation coefficient after microarray data in GSE45216 dataset was normalized. The deeper the red color, the higher the correlation coefficient was. The icon group on the right represented the grouping of experimental samples, among which tumor standed for tumor tissues and the icon normal represented normal tissues. B represented the cluster figure of Person correlation coefficient after microarray data in GSE45164 dataset was normalized. The deeper the red color, the higher the correlation coefficient was. The icon group on the right represented the grouping of experimental samples, among which tumor standed for tumor tissues and the icon normal represented normal tissues.
Samples distribution by PCA analysis. A represented the sample distribution in GSE45216 dataset while B represented the sample distribution in GSE45164 dataset. PC1 standed for the main principal component 1 while PC2 standed for the main principal component 2 and PC3 standed for the main principal component 3. The icon tumor represented tumor samples while the normal represented the normal tissue.
Functional enrichment analysis of differentially expressed genes
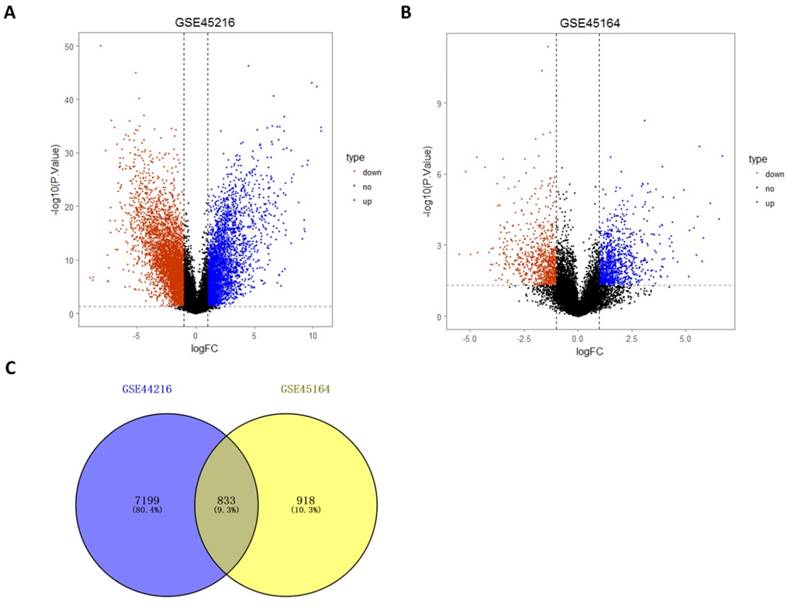
Differentially expressed genes identification of microarray data after normalization was performed by Limma package. A total of 8032 differentially expressed genes were identified by the comparing the 30 tumor tissues and 10 normal tissues in the GSE45216 dataset, including 3474 up-regulated genes and 4560 down-regulated genes. The number of genes with the annotation information was 3118 (Figure 4A). A total of 1750 differentially expressed genes were identified by the comparing the 10 tumor tissues and 3 normal tissues in the GSE45216 dataset, including 956 up-regulated genes and 794 down-regulated genes. The number of genes with the annotation information was 1678 (Figure 4B). The number of Common genes in both GSE45216 and GSE45164 was 833, and genes with the same tendency were 680, including 465 up-regulated genes and 215 down-regulated genes (Figure 4C).
Differentially expressed analysis of GSE45216 and GSE45164 datasets. A-B was the differentially expressed volcano figure. A total of 8032 differentially expressed genes in GSE45216 were identified, including 3474 up-regulated genes and 4560 down-regulated genes (A) while there was 1750 differentially expressed genes in GSE45164 were identified, including 956 up-regulated genes and 794 down-regulated genes. C was the Venn figure and a total of 833 Co-expression genes between these two datasets were identified out. The icon type represented the expression situation and up meant up-regulated, down meant down-regulated and no meant not differentially expressed.
Functional enrichment analysis
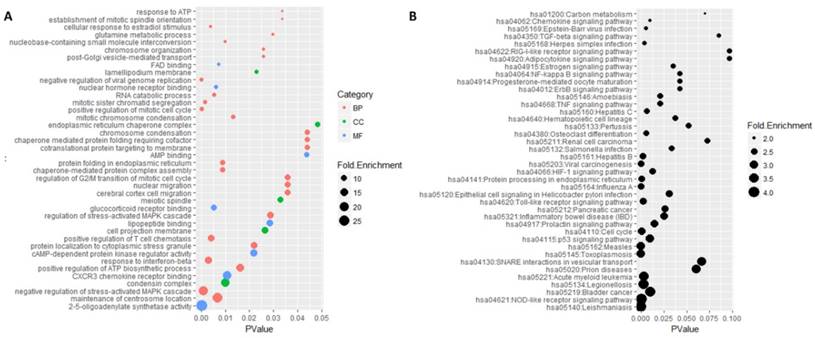
Functional enrichment analysis was performed on these common genes by DAVID software (Figure 5). There were 207 mostly enriched terms in the GO functional enrichment analysis. The maximum number of terms enriched in biological processes was 130 and the minimum number of terms enriched in molecular functions was 35. The top three functional terms enriched in molecular functions were 2'-5'-oligoadenylate synthetase activity, CXCR3 chemokine receptor binding, and cAMP-dependent protein kinase regulator activity. The mostly enriched terms enriched in biological processes were the maintenance of centrosome location, negative regulation of stress-activated MAPK cascade, positive regulation of ATP biosynthetic process and response to interferon-beta. The top three functional terms enriched in cell components were condensin complex, cell projection membrane, and meiotic spindle. A total of 38 signaling pathways were mostly enriched in the KEGG enrichment analysis, in which Leishmaniasis was the mostly enriched one.
GO and KEGG enrichment analysis of 484 genes. A represented the top 40 mostly enriched terms by Go enrichment analysis. Category represented GO type, among which BP standed for biological processes, CC standed for cell component and MF represented the molecular function. Fold enrichment represented the enriched degree and p-value represented the significant degree of statistics. B was the result of KEGG enrichment analysis. Fold enrichment represented the enriched degree and p-value represented the significant degree of statistics.
Validation analysis of independent samples
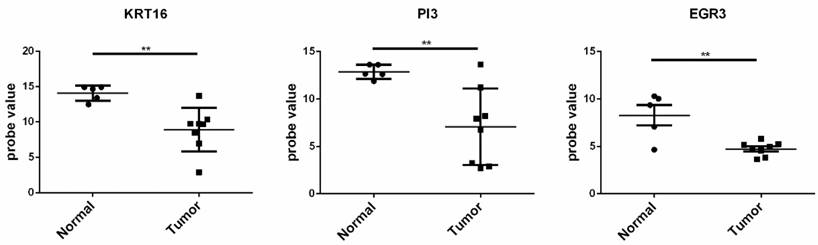
The gene sets with fold change ranging the top 20 in the up and down-regulated genes in the two datasets were selected. As a result, up-regulated genes of S100A12, MMP1, DEFB4B///DEFB4A, KRT16 and PI3, and the down-regulated genes EGR3, LRP4, C14orf132, PAMR1, CCL27, and KRT2 were obtained and selected as the candidate genes for further analysis.The GSE66359 dataset, including 13 samples (8 tumor tissues and 5 normal tissues), at the platform of Affymetrix Human Genome U133 Plus 2.0, was used as the testing sample. The result of independence testing analysis showed that genes of KRT16, PI3 and EGR3 had the significant reduction of gene expression in CSCC tumor cells, but KRT16 and PI3 genes had the contrary to expected results (Figure 6).
The expression situation of the KRT16, PI3, and EGR3 genes in GSE66359 dataset. Tumor represented the tumor tissue and normal was the corresponding normal tissues. The significance of “*”was *<0.05, **<0.01 and ***<0.001. “NS” meant not significant.
Discussion
Squamous Cell carcinoma (SCC), also known as epidermoid carcinoma, is a kind of malignant tumor that often occurs in epidermal cells or cells of appendages [16]. The cancer cells are featured by different degree of keratosis. Organs covered by squamous epithelium, such as skin, mouth, lips, esophagus, cervix, vagina, etc, are more feasible to be affected. Some other organs, like bronchus, bladder and renal pelvis, though without the cover of squamous epithelium, can also transform to SCC by squamous metaplasia phenomenon. Currently, the incidence of SCC has been increased dramatically worldwide [17]. Therefore, early diagnosis and treatment are still the most efficient measures to avoid the occurrence and development of the tumor. Nowadays, the biomarker research of SCC was rare and the identification of biomarker of this disease was urgent, which may quite helpful in the predictive and prognostic treatment of cancer in clinical research.
In this study, a total of 833 co-expression genes were identified by the differentially expressed genes analysis on the total of 53 genes from three datasets, that is, GSE45216, GSE42677, and GSE45164. As a result, a total of 680 genes with similar expression trend were figured out, including 465 up-regulated genes and 215 down-regulated genes. Furthermore, the candidate genes were verified in the GSE66359 dataset, which made the result more reliable. Finally, three genes, KRT16, PI3, and EGR3 were the most differentially expressed in cutaneous squamous cell carcinoma, but KRT16 and PI3 genes had the opposite expression pattern with those in GSE42677 and GSE45164 dataset. Unlike previous study that identify biomarker of CSCC in two contexts, in vitro and in vivo, in this study, three datasets, GSE45216, GSE42677, GSE45164, were selected for the research and the results were verified in GSE66359 dataset, precluding the overlapping of the context and made the results more reliable. A total of 53 samples, including 30 tumor samples in GSE45216 dataset, combined with 10 normal tissues in GSE42677 dataset after normalization and 10 tumor tissues and 3 normal tissues in GSE45164 dataset, were selected for the differentially expressed analysis, aiming to explore the molecular mechanism of squamous cell carcinoma. As a result, a total of 833 co-expression genes as KRT16 and PI3 etc, were screened out. The number of genes with the same tendency was 680, including 465 up-regulated genes and 215 down-regulated genes. Up-regulated genes of S100A12, MMP1, DEFB4B///DEFB4A, KRT16 and PI3, and down-regulated genes as EGR3, LRP4, C14orf132, PAMR1, CCL27, and KRT2 were identified as the potential target genes. Besides, the result was testified in GSE66359 dataset. The result showed that three genes, KRT16, PI3 and EGR were the most significant differentially expressed but the expression pattern of KRT16 and PI genes were contrary to that in GSE42677 and GSE45164 datasets.
EGR3 (Early Growth Response 3) gene belongs to EGR family and there were 4 genes in this gene family, that is EGR1~EGR4. There was a highly conserved DNA-binding domain encoding zinc finger proteins in the EGR family. This kind of gene had one reaction component that can bind to the zinc finger structure. Proteins encoded by EGR3 gene were the transcription factor of Cys2His2 zinc finger structure, which was also one type of genes responding to early growth process[18, 19]stimulated by karyomitosis. It was reported in early research that EGR2 and EGR3 genes stimulated NFκB and MAPK signaling pathway in the upstream [20] with the help of breast adipose fibroblasts TNFα. It played essential roles in fibrotic response and up-regulated in scleroderma disease [21]. Genes in EGR family were down-regulated or usually absent in oral squamous cell carcinoma tissues and some squamous cell lines. However, the expression and significance of EGR3 in cutaneous squamous cell carcinoma haven't been made clear. Liao's study showed that the expression of EGR3 gene played a critical role in the differentiation, proliferation, metastasis and progression of gastric cancer cells [22] and Inoue's study addressed the role of Egr3 as an intracellular mediator of the estrogen-signaling pathway in breast cancer. All this study demonstrated the close association between EGR3 and cancer [23]. In this study, EGR3 was found to be highly enriched and had exactly the same expression pattern with GSE45216 and GSE45164. All these results showed that EGR3 may be closely associated with the occurrence of squamous cell carcinoma and may function as the potential biomarker of this disease, suggesting a potential application in the improvement of prognostic tools and treatments of this disease.
Unlike conventional method, in this study, the candidate genes identified were further verified further in the GSE66359 dataset, which made the result more reliable. Though three candidate genes, that is, KRT16, PI3, and EGR3 were found to be mostly enriched, only EGR3 was found to have similar expression pattern with that in the GSE4267 and GSE45164 dataset. What's more, the association of EGR family genes with squamous cell carcinoma had been supported by a series of early studies. Therefore, we had reason to believe that EGR3 may be closely related to the occurrence and development of cutaneous squamous cell carcinoma and may function as the biomarkers of this disease.
Supplementary Material
Supplementary figures.
Competing Interests
The authors have declared that no competing interest exists.
References
1. Hawrot A, Alam M, Ratner D. Squamous cell carcinoma. Current Problems in Dermatology. 2003;15:91-133
2. Webb JL, Burns RE, Brown HM, LeRoy BE, Kosarek CE. Squamous cell carcinoma. Compendium (Yardley, PA). 2009;31(E):9
3. Reiner A, Yekutieli D, Benjamini Y. Identifying differentially expressed genes using false discovery rate controlling procedures. Bioinformatics. 2003;19:368-75
4. Ideker T, Thorsson V, Siegel AF, Hood LE. Testing for differentially-expressed genes by maximum-likelihood analysis of microarray data. Journal of computational biology. 2000;7:805-17
5. Welford SM, Gregg J, Chen E, Garrison D, Sorensen PH, Denny CT. et al. Detection of differentially expressed genes in primary tumor tissues using representational differences analysis coupled to microarray hybridization. Nucleic acids research. 1998;26:3059-65
6. Sallinen S-L, Sallinen PK, Haapasalo HK, Helin HJ, Helén PT, Schraml P. et al. Identification of differentially expressed genes in human gliomas by DNA microarray and tissue chip techniques. Cancer research. 2000;60:6617-22
7. Xu J, Stolk JA, Zhang X, Silva SJ, Houghton RL, Matsumura M. et al. Identification of differentially expressed genes in human prostate cancer using subtraction and microarray. Cancer research. 2000;60:1677-82
8. Lambert S, Mladkova N, Gulati A, Hamoudi R, Purdie K, Cerio R. et al. Key differences identified between actinic keratosis and cutaneous squamous cell carcinoma by transcriptome profiling. British journal of cancer. 2014;110:520-9
9. Brooks YS, Ostano P, Jo S-H, Dai J, Getsios S, Dziunycz P. et al. Multifactorial ERβ and NOTCH1 control of squamous differentiation and cancer. The Journal of clinical investigation. 2014;124:2260-76
10. Farshchian M, Nissinen L, Siljamäki E, Riihilä P, Toriseva M, Kivisaari A. et al. EphB2 Promotes Progression of Cutaneous Squamous Cell Carcinoma. Journal of Investigative Dermatology. 2015;135:1882
11. Farshchian M, Nissinen L, Siljamäki E, Riihilä P, Toriseva M, Kivisaari A. et al. EphB2 promotes progression of cutaneous squamous cell carcinoma. Journal of Investigative Dermatology. 2015;135:1882-92
12. Bolstad B, Collin F, Brettschneider J, Simpson K, Cope L, Irizarry R. et al. Quality assessment of Affymetrix GeneChip data. Bioinformatics and computational biology solutions using R and bioconductor: Springer. 2005:33-47
13. Wu J, Irizarry R, MacDonald J, Gentry J. Gcrma: background adjustment using sequence information. R package version. 2012:2200
14. Ritchie ME, Phipson B, Wu D, Hu Y, Law CW, Shi W. et al. limma powers differential expression analyses for RNA-sequencing and microarray studies. Nucleic acids research. 2015:gkv007
15. Huang DW, Sherman BT, Lempicki RA. Systematic and integrative analysis of large gene lists using DAVID bioinformatics resources. Nature protocols. 2009;4:44-57
16. Marks R. Squamous cell carcinoma. The Lancet. 1996;347:735-8
17. Nindl I, Dang C, Forschner T, Kuban RJ, Meyer T, Sterry W. et al. Identification of differentially expressed genes in cutaneous squamous cell carcinoma by microarray expression profiling. Molecular cancer. 2006;5:30
18. Patwardhan S, Gashler A, Siegel M, Chang L, Joseph L, Shows T. et al. EGR3, a novel member of the Egr family of genes encoding immediate-early transcription factors. Oncogene. 1991;6:917-28
19. Lindgren G, Ekblad L, Vallon-Christersson J, Kjellén E, Gebre-Medhin M, Wennerberg J. Erythropoietin suppresses the activation of pro-apoptotic genes in head and neck squamous cell carcinoma xenografts exposed to surgical trauma. BMC cancer. 2014;14:648
20. To SQ, Knower KC, Clyne CD. NFκB and MAPK signalling pathways mediate TNFα-induced Early Growth Response gene transcription leading to aromatase expression. Biochemical and biophysical research communications. 2013;433:96-101
21. Fang F, Shangguan AJ, Kelly K, Wei J, Gruner K, Ye B. et al. Early growth response 3 (Egr-3) is induced by transforming growth factor-β and regulates fibrogenic responses. The American journal of pathology. 2013;183:1197-208
22. Liao F, Ji M-Y, Shen L, Qiu S, Guo X-f, Dong W-g. Decreased EGR3 expression is related to poor prognosis in patients with gastric cancer. Journal of molecular histology. 2013;44:463-8
23. Inoue A, Omoto Y, Yamaguchi Y, Kiyama R, Hayashi SI. Transcription factor EGR3 is involved in the estrogen-signaling pathway in breast cancer cells. Journal of molecular endocrinology. 2004;32:649-61
Author contact
![]() Corresponding authors: Ju Zhu, 358921617com, Department of Plastic Surgery, The Central Hospital of Wuhan, Tongji Medical College, Huazhong University of Science and Technology, Wuhan, China or Ming Yang, dr_y88com, Department of Plastic Surgery, The Central hospital of Wuhan, Tongji Medical College, Huazhong University of Science and Technology, Wuhan, China.
Corresponding authors: Ju Zhu, 358921617com, Department of Plastic Surgery, The Central Hospital of Wuhan, Tongji Medical College, Huazhong University of Science and Technology, Wuhan, China or Ming Yang, dr_y88com, Department of Plastic Surgery, The Central hospital of Wuhan, Tongji Medical College, Huazhong University of Science and Technology, Wuhan, China.