Impact Factor ISSN: 1837-9664

 Global reach, higher impact
J Cancer 2017; 8(13):2614-2625. doi:10.7150/jca.17847 This issue Cite
Research Paper
Profiling chemotherapy-associated myelotoxicity among Chinese gastric cancer population receiving cytotoxic conventional regimens: epidemiological features, timing, predictors and clinical impacts
Ci Zhu1, Yan Wang1, Xicheng Wang2, Chunmei Bai3, Dan Su4, Bing Cao5, Jianming Xu1 ![]()
1. Beijing 307 People's Liberation Army Hospital Cancer Centre, Beijing, China
2. Department of Gastrointestinal Oncology, Beijing Cancer Hospital, Beijing, China
3. Department of Gastrointestinal Oncology, Peking Union Medical College Hospital, Beijing, China
4. Oncology Department, No. Chinese PLA General Hospital, Beijing, China
5. Department of Medical Oncology, Fudan University Shanghai Cancer Center, Shanghai, China
Received 2016-10-8; Accepted 2016-12-24; Published 2017-8-18
Abstract
Objectives: We aim to evaluate the epidemiological features, timing, predictors and clinical impacts of chemotherapy-associated myelotoxicity in Chinese gastric cancer population receiving six established cytotoxic conventional regimens (CF/XP, EC(O)F/EC(O)X, DC(O)F/DC(O)X, PC(O)F/PC(O)X, FOLFOX4, or mFOLFOX7/XELOX).
Patients and methods: A 4-year multicenter, prospective, observational study was conducted in multiple hospitals/institutes spanning three major regions in China. A total of 1,285 patients with gastric cancer, treated with six selected regimens between 2010 and 2014 were included. Kaplan-meier analysis was applied to estimate the time to develop myelotoxicity events for each regimen. Multivariable logistic regression model was built to identify predictors associated with chemotherapy-induced myelotoxicity, evaluating detailed specific factors of patients, disease and treatment patterns.
Results: Triplet regimens were associated with more moderate-to-severe myelotoxicity events than doublet regimens. DC(O)F/DC(O)X group presented with moderate-to-severe anaemia, thrombocytopenia, and leukopenia earlier than other regimen groups, with median time of 3.5, 4.8 and 3.3 cycles, respectively. PC(O)F/PC(O)X group had a shortest time to develop Moderate-to-Severe neutropenia (median time, 3.3 cycles). Multivariate analysis identified several independent predictors for moderate-to-severe myelotoxicity, including: baseline Hb<12.0 g/dL, male gender, KPS<80, previously treated with surgery, tumor located at gastroesophageal junction(GEJ), DC(O)F/DC(O)X regimen, palliative intent, triplet combination therapy and No. of cycles received≥4. Dose reductions≥20% occurred in 16.7% of patients and treatment delays≥7 days presented in 21.1% of patients, resulting in patients receiving an actual average Relative Dose Intensity (RDI) of 0.733.
Conclusions: Myelotoxicity events were frequently observed within the gastric cancer population undertaking multicycle polychemotherapy. Predictive models based on risk factors identified for moderate-to-severe myelotoxicity should enable the targeted use of appropriate supportive care in an effort to facilitate the delivery of full chemotherapy doses on schedule.
Keywords: gastric cancer, anaemia, thrombocytopenia, neutropenia, leukopenia
Introduction
Gastric cancer is frequently associated with chemotherapy-induced myelotoxicity due to the fact that subtotal gastrectomy or total gastrectomy might lead to poor postoperative nutrition status and conditions, making patients become poor-tolerated to hematological toxicity from chemotherapy [1,2]. Currently doublet and triplet regimens have been widely used in the treatment for gastric cancer [3,4,5]. However, evidence-based data on frequency, severity and risk factors of myelotoxicity that is associated with those commonly used regimens are scarcely available. Additionally, identification of subgroup of gastric cancer patients with high risks of developing myelotoxicity events and would benefit from early intervention is of utmost importance to improve patients' life quality.
Several population-based studies have been conducted worldwide to define the prevalence, incidence and management of chemotherapy-induced anaemia and neutropenia [6-9]. Yet, to our knowledge, no comprehensive profile is currently accessible for clinicians to better estimate the chemotherapy-associated myelotoxicity for gastric cancer. In this investigation, we evaluate epidemiological features, timing, predictors of chemotherapy-associated myelotoxicity, as well as, its clinical impacts on chemotherapy delivery and actual Average Relative Dose-Intensity (ARDI) in gastric cancer patients treated with six selected regimens [CF(5-fluorouracil)/XP(capecitabine, cisplatin (oxaliplatin)); EC(O)F(epirubicin, cisplatin (oxaliplatin)5-fluorouracil)/EC(O)X(epirubicin, cisplatin (oxaliplatin), capecitabine); DC(O)F(docetaxel, cisplatin (oxaliplatin), 5-fluorouracil)/DC(O)X(docetaxel, cisplatin (oxaliplatin), capecitabine); PC(O)F(paclitaxel, cisplatin (oxaliplatin), 5-fluorouracil)/PC(O)X(paclitaxel, cisplatin (oxaliplatin), capecitabine); FOLFOX4(oxaliplatin, 5-fluorouracil, calcium folinate)/mFOLFOX7(oxaliplatin, 5-fluorouracil, calcium folinate)/XELOX(oxaliplatin, capecitabine)] between 2010 and 2014 in three major regions of China.
Patients and methods
Study design and patients
A multicenter, prospective, observational study in multiple hospitals/institutes spanning three major regions (Northeast, Central and Southeast regions) in China was undertaken between October 2010 and January 2014, aiming to profile chemotherapy-associated myelotoxicity among Chinese gastric cancer population. Patients who were administrated with six selected regimens (i.e. CF/XP; EC(O)F/EC(O)X; DC(O)F/DC(O)X; PC(O)F/PC(O)X; FOLFOX4; mFOLFOX7/XELOX) for gastric cancer between 2010 and 2014 were included. Investigators from participating Oncology centers were asked to report data using paper-based case record form (CRF) extracted from the medical charts.
Patients eligible for assessment were those of aged ≥18, pathologically confirmed as gastric cancer and being treated with at least 3 cycles for regimen CF/XP; EC(O)F/EC(O)X; DC(O)F/DC(O)X; PC(O)F/PC(O)X; 4 cycles for FOLFOX4 and more than 6 cycles for mFOLFOX7/XELOX, regardless of stage and prior treatment history.
Data definitions and collection
Data on patients' baseline demographics and clinical characteristics including age at treatment, gender, weight, height, body mass index (BMI), body-surface area (BSA), Karnofsky Performance Status, subsite of tumor, differentiation category, pathology type, disease status, TNM staging, metastatic sites, and physical history were collected. Information regarding previous treatment history and comorbidities was also registered. Chemotherapy regimens, planned dose and schedule, cycle-specific details (actual delivered dosage of each therapeutic agent, start/stop dates of chemotherapy, baseline haematological laboratory values, number of cycles patients received, reasons for chemotherapy delays, discontinuation and dose reduction) were also recorded.
Follow up data of haematological laboratory values were obtained with a minimum of 3 times per week or more if indicated during one chemotherapy cycle, with relative blood test dates being registered.
The definition of anaemia in our study was haemoglobin (Hb) less than 12.0 g/dL, and was further categorized as mild:11.9-10.0 g/dL; moderate: 9.9-8.0 g/dL; and severe: Hb<8.0g/dL. Thrombocytopenia was distinguished as platelet (PLT) count<125×109/L, and was labeled as mild: 125-75×109/L; moderate: 75-50×109/L; severe: PLT<50×109/L. Neutropenia was specified as Absolute neutrophils count (ANC)<1.5×10⁹/L, and was defined as mild: 2.0-1.5×10⁹/L; moderate: 1.5-1.0×10⁹/L; severe: ANC<1.0×10⁹/L. Leukopenia was defined as white blood cell (WBC) count<4.0×10⁹/L, and was further classified as mild: 3.9-3.0×10⁹/L; moderate: 2.9-2.0×10⁹/L; or severe: <2.0×10⁹/L, in accordance with toxicity grading criteria from the National Cancer Institute (NCI).
Myelotoxicity was defined as the presence of anaemia (Hb<12.0g/dL) and/or thrombocytopenia (PLT<125×109/L) and/or neutropenia (Absolute neutrophils count<1.5×10⁹/L) and/or leukopenia (WBC<4.0×10⁹/L). Moderate-to-severe myelotoxicity was defined as the presence of moderate-to-severe anaemia (Hb<10.0g/dL) and/or moderate-to-severe thrombocytopenia (PLT<75×109/L) and/or moderate-to-severe neutropenia (Absolute neutrophils count<1.0×10⁹/L) and/or moderate-to-severe (WBC<3.0×10⁹/L).
Clinical impacts mainly included chemotherapy delay and dose reduction≥20%. Chemotherapy delay was considered as the interval between cycles increased ≥ 7 days or cycles being discontinued. Chemotherapy regimens were categorized as “standard” if therapeutic agents were delivered at the planned doses and schedules, or “reduced” when the doses reduction exceeded≥ 20%.
The relative dose intensity (RDI) was defined as the ratio of actual dose intensity administered per time unit (DI mg/m2/week) and the reference dose intensity (DI), according to the equation, RDI (%)=actual DI/ reference DI ×100%. The RDI was first calculated separately for each chemotherapy component, and then an average RDI of each regimen was derived according to the equation: (RDI for component No.1+RDI for component No.2+…..RDI for component No.n)/n; Actual RDI for regimen was calculated according to the equation, Actual RDI= dose intensity for each regimen actually delivered /actual cycle duration.
Statistical analysis
All of the statistical analyses were performed using SPSS version 22.0 (Chicago, IL, USA) and SASR package version 9.1.2 (SAS Institute Inc., Cary, North Carolina). Differences were assumed to be statistically significant when P value was less than 0.05. The collected data were summarized using descriptive statistics and presented as means (SDs), medians (range) for continuous variables, and as percentages for categorical variables. Patient's data were stratified by chemotherapy regimens. Group comparisons were based on Chi-square test for categorical variables, and those for continuous variables were based on Student's t test for normally distributed variables and the Mann-Whitney U statistic for all other variables. Time to develop moderate-to-severe myelotoxicity for six regimen strata was compared by log-rank test, and results were expressed by using Kaplan-Meier curve. Multivariate logistic regression analysis was assessed to estimate the odds ratios and identify the predictive factors independently associated with frequency of each myelotoxicity indices among various regimen groups.
Results
Patient demographics and baseline characteristics
Since 87 patients whose data was ineligible or uncompleted for evaluation, the analysis population consisted of 1,285 patients. The disposition of the patient population was summarized in Supplementary Fig.1.
Of the 1,285 eligible patients, the mean age of the study population was 57 years (range, 19 to 88 years), with 79.7% of patients <65 years of age at treatment. 43.7% of patients were reported to have low KPS scores less than 80 before chemotherapy. The most frequent subsite of the tumor was non-GEJ (Gastric Esophageal Junction) (1260, 90.3%) while GEJ tumor counted for 9.7% (125) of the patients. More patients (704, 55.2%) showed metastatic disease or locally advanced or recurrent than disease free (581, 44.8%). As far as the treatment-specific factors are concerned, 741 patients (57.7%) were receiving chemotherapy with curative intention, and 861 patients (67.0%) received triplet regimen (Table 1).
Baseline demographics and clinical characteristics for analysis population by regimens
CF/XP | EC(O)F /EC(O)X | DC(O)F /DC(O)X | PC(O)F /PC(O)X | FOLFOX4 | mFOLFOX7 /XELOX | Total | |
|---|---|---|---|---|---|---|---|
| Variable | (n=182)) | (n=172) | (n=235) | (n=147) | (n=242) | (n=307) | (n=1,285) |
| Patient related factors | |||||||
| Age(years) | |||||||
| Adult (<65) (%) | 78.6 | 86.6 | 88.5 | 83 | 74 | 72.6 | 79.7 |
| Elderly (≥65) (%) | 21.4 | 13.4 | 11.5 | 17 | 26 | 27.4 | 20.3 |
| Gender (%) | |||||||
| Male | 75.3 | 58.1 | 60.9 | 66.7 | 70.7 | 72 | 67.7 |
| Female | 24.7 | 41.9 | 39.1 | 33.3 | 29.3 | 28 | 32.3 |
| BMI (%) | |||||||
| BMI<23.0 Kg/m2 | 68.1 | 69.8 | 68.1 | 74.1 | 71.1 | 72 | 70.5 |
| BMI≥23.0 Kg/m2 | 31.9 | 30.2 | 31.9 | 25.9 | 28.9 | 28 | 29.5 |
| BSA (%) | |||||||
| BSA<2.0 m2 | 98.4 | 98.8 | 93.6 | 98 | 96.3 | 97.1 | 96.8 |
| BSA≥2.0 m2 | 1.6 | 1.2 | 6.4 | 2 | 3.7 | 2.9 | 3.2 |
| KPS (%) | |||||||
| ≥80 | 65.9 | 64 | 51.9 | 54.4 | 48.8 | 56.7 | 56.3 |
| <80 | 34.1 | 36 | 48.1 | 45.6 | 51.2 | 43.3 | 43.7 |
| Treatment Status (%) | |||||||
| Previously treated | 50 | 70.3 | 75.7 | 72.1 | 83.1 | 82.1 | 73.9 |
| Previously untreated | 50 | 29.7 | 24.3 | 27.9 | 16.9 | 17.9 | 26.1 |
| Previously received Platinum based CT | |||||||
| Yes | 14.3 | 12.2 | 18.3 | 42.2 | 16.9 | 16.3 | 19.1 |
| No | 85.7 | 87.8 | 81.7 | 57.8 | 83.1 | 83.7 | 80.9 |
| Previously received RT | |||||||
| Yes | 4.4 | 11 | 24.3 | 4.8 | 12.4 | 11.1 | 12.1 |
| No | 95.6 | 89 | 75.7 | 95.2 | 87.6 | 88.9 | 87.9 |
| Previously treated with surgery | |||||||
| Yes | 45.6 | 67.4 | 64.3 | 51.7 | 78.1 | 79.8 | 66.9 |
| No | 54.4 | 32.6 | 35.7 | 48.3 | 21.9 | 20.2 | 33.1 |
| Comorbidities with HTN/DM/LD/COPD | |||||||
| Yes | 13.2 | 15.1 | 14 | 17.7 | 22.7 | 17.6 | 17 |
| No | 86.8 | 84.9 | 86 | 82.3 | 77.3 | 82.4 | 83 |
| Ascite/Hydrothorax | |||||||
| Yes | 8.2 | 9.3 | 12.8 | 15.6 | 6.6 | 3.9 | 8.7 |
| No | 91.8 | 90.7 | 87.2 | 84.4 | 93.4 | 96.1 | 91.3 |
| History of GI tract hemorrhage | |||||||
| Yes | 3.8 | 1.7 | 3.8 | 6.1 | 1.7 | 2.9 | 3.2 |
| No | 96.2 | 98.3 | 96.2 | 93.9 | 98.3 | 97.1 | 96.8 |
| Baseline Hb count (g/dL) | |||||||
| Hb≥12.0 | 54.4 | 54.1 | 46.4 | 45.6 | 47.5 | 57.7 | 51.4 |
| Hb<12.0 | 45.6 | 45.9 | 53.6 | 54.4 | 52.5 | 42.3 | 48.6 |
| Baseline PLT count(×109/L) | |||||||
| PLT≥125 | 95.1 | 97.1 | 96.6 | 93.2 | 93 | 93.2 | 94.6 |
| PLT<125 | 4.9 | 2.9 | 3.4 | 6.8 | 7 | 6.8 | 5.4 |
| Baseline ANC count(×109/L) | |||||||
| ANC≥1.5 | 98.4 | 98.9 | 100 | 99.3 | 99.2 | 99.4 | 99.2 |
| ANC<1.5 | 1.6 | 1.1 | 0 | 0.7 | 0.8 | 0.6 | 0.8 |
| Baseline WBC count(×109/L) | |||||||
| WBC≥4.0 | 97.3 | 96.5 | 98.7 | 99.3 | 98.8 | 98.7 | 98.3 |
| WBC<4.0 | 2.7 | 3.5 | 1.3 | 0.7 | 1.2 | 1.3 | 1.7 |
| Cancer-related factors | |||||||
| Subsite of Tumor | |||||||
| Non-GEJ | 86.8 | 97.1 | 89.8 | 90.3 | 89.6 | 94.1 | 90.3 |
| GEJ | 13.2 | 2.9 | 10.2 | 19.7 | 10.3 | 5.9 | 9.7 |
| Differentiation | |||||||
| Well/Moderately differentiated | 72 | 64 | 84.7 | 81.6 | 77.7 | 75.9 | 76.3 |
| Poorly differentiated/ Undifferentiated/Anaplastic | 28 | 36 | 15.3 | 18.4 | 22.3 | 24.1 | 23.7 |
| Pathology Type | |||||||
| Adenocarcinoma | 84.1 | 82.6 | 75.3 | 78.2 | 81.8 | 80.8 | 80.4 |
| SRC/MCC | 10.4 | 10.5 | 22.6 | 17 | 16.1 | 17.6 | 16.2 |
| Adenocarcinoma mixed | 4.4 | 6.4 | 1.7 | 3.4 | 1.7 | 1.3 | 2.8 |
| Others | 1.1 | 0.6 | 0.4 | 1.4 | 0.4 | 0.3 | 0.6 |
| Disease Status | |||||||
| Tumor Free | 32.4 | 63.4 | 31.5 | 20.4 | 48.8 | 60.6 | 44.8 |
| Locally Advanced/recurrent/ Metastatic | |||||||
| 67.6 | 36.6 | 68.5 | 79.6 | 51.2 | 39.4 | 55.2 | |
| TNM Staging | |||||||
| I/II | 22.5 | 41.9 | 20.9 | 15.6 | 34.3 | 38.4 | 30 |
| III | 17.6 | 28.5 | 22.1 | 34.7 | 33.9 | 33.9 | 28.8 |
| IV | 59.9 | 29.7 | 57 | 49.7 | 31.8 | 27.7 | 41.2 |
| No. of metastatic sites | |||||||
| 0 | 39.6 | 70.4 | 43 | 46.9 | 68.2 | 72.3 | 58.4 |
| 1 | 37.9 | 15.1 | 31.5 | 23.1 | 17.8 | 15.6 | 22.9 |
| ≥2 | 22.5 | 14.5 | 25.5 | 30 | 14 | 12.1 | 18.8 |
| Metastatic sites | |||||||
| Lung | 7.5 | 3.8 | 5.2 | 4.7 | 3.1 | 2.2 | 4.1 |
| Liver | 19.2 | 9.3 | 18.3 | 27.2 | 8.7 | 9.8 | 14.4 |
| Bone | 5.5 | 1.7 | 2.6 | 3.4 | 2.9 | 0.3 | 2.5 |
| Peritoneum | 10.4 | 9.9 | 14.9 | 17 | 7.9 | 6.2 | 10.4 |
| Adrenal | 0.5 | 0 | 0.9 | 0.7 | 0.4 | 1 | 0.6 |
| Lymph nodes | 52.7 | 28.5 | 48.1 | 53.7 | 36.8 | 26.4 | 39.5 |
| Chemotherapy pattern related factors | |||||||
| Treatment intention | |||||||
| Curative ( Neoadjuvant/adjuvant) | 42.3 | 64.5 | 49.4 | 34 | 63.2 | 76.2 | 57.7 |
| Palliative | 57.7 | 35.5 | 50.6 | 66 | 36.8 | 23.8 | 42.3 |
| No. of cycles received | |||||||
| <4 | 58.2 | 70.3 | 74 | 53.7 | 31.8 | 34.9 | 51.7 |
| ≥4 | 41.8 | 29.7 | 26 | 46.3 | 68.2 | 65.1 | 48.3 |
| Planned Regimen Relative Dose Intensity (RDI) (%) | |||||||
| Median | 89.7 | 92.1 | 89.4 | 84.3 | 95.2 | 82.7 | 88.1 |
| Range | 61.3-99.7 | 55.3-99.8 | 43.5-99.1 | 47.3-99.8 | 73.1-99.3 | 75.9-99.9 | 43.5-99.9 |
Abbreviations: GI, gastric intestinal; Hb, hemoglobin; PLT, platelet; ANC, absolute neutrophil count; WBC, white blood cell; CT, chemotherapy; RT, radiationtherapy; HTN, hypertension; DM, diabetes mellitus; LD, liver disease; COPD, chronic obstructive pulmonary disease; SRC, signet ring cell; MCC, mucous cell carcinoma; EC(O)F, epirubicin, cisplatin (oxaliplatin), 5-fluorouracil; EC(O)X, epirubicin, cisplatin (oxaliplatin), capecitabine; DC(O)F, docetaxel, cisplatin (oxaliplatin), 5-fluorouracil; DC(O)X, docetaxel, cisplatin (oxaliplatin), capecitabine; PC(O)F, paclitaxel, cisplatin (oxaliplatin), 5-fluorouracil; PC(O)X, paclitaxel, cisplatin (oxaliplatin), capecitabine; FOLFOX4, oxaliplatin, 5-fluorouracil, calcium folinate; mFOLFOX7, oxaliplatin, 5-fluorouracil, calcium folinate; XELOX, oxaliplatin, capecitabine, GEJ: gastroesophageal junctions
The mean initial regimen relative dose intensity (RDI) of the 1,285 patients were similar among all regimen groups (CF/XP; EC(O)F/EC(O)X; DC(O)F/DC(O)X; PC(O)F/PC(O)X; FOLFOX4; mFOLFOX7/XELOX, P=0.233).
Epidemiological features of chemotherapy-associated myelotoxicity
Prevalence of myelotoxicity at baseline
The prevalence of anaemia (Hb<12.0 g/dL) before chemotherapy was 46.5%. Most patients (33.1%) had mild anaemia, moderate anaemia was recorded for 12.4% and severe anaemia for 1.1% of all the patients. Patients who received surgery were associated with higher prevalence of severe anaemia than patients who never treated with surgery (2.4% vs 0.5%, P=0.004). Among those who were treated with surgery, anaemia (Hb<12.0 g/dL) and moderate-to-severe anaemia were more frequently (60.8%, 16.4%) reported in patients underwent total gastrectomy than those treated with subtotal or partial gastrectomy (43.6%, 10.5%) (P=0.000, P=0.000).
Thrombocytopenia (PLT<125×109/L) was recorded in 61 patients (4.7%) and moderate-to-severe thrombocytopenia was observed in 3 patients (0.2%). The prevalence of neutropenia (ANC<1.5×10⁹/L) was 14.9% and most neutropenia are considered as mild (9.0%). 13.4% of the patients had leukopenia (WBC<4.0×10⁹/L) before treatment and most patients with leukopenia had a WBC level of 4.0-3.0×10⁹/L.
Incidence of myelotoxicity during chemotherapy
Of the patients who were not anaemic at baseline, the incidence of anaemia (Hb<12.0 g/dL) was highest in EC(O)F/EC(O)X group (92.5%) compared with other regimen groups (CF/XP, 88.9%; DC(O)F/DC(O)X, 82.6%; PC(O)F/PC(O)X, 79.1%; FOLFOX4, 70.4%; mFOLFOX7/XELOX, 75.1%, P=0.000). mFOLFOX7/XELOX group had the lowest incidence of moderate-to-severe anaemia (13.0%). No statistical significance was observed among the severe anaemia incidence in 6 regimen groups (CF/XP, 14.1%; EC(O)F/EC(O)X, 4.3; DC(O)F/DC(O)X, 6.4%; PC(O)F/PC(O)X, 10.4%; FOLFOX4, 13.0%; mFOLFOX7/XELOX, 7.9%, P=0.107).
The incidence of thrombocytopenia, moderate-to-severe thrombocytopenia and severe thrombocytopenia was 60%, 10.5% and 7.7%, respectively. The incidence of severe thrombocytopenia was significantly higher in DC(O)F/DC(O)X group (14.1%) than others. mFOLFOX7/XELOX group had the lowest incidence of moderate-to-severe thrombocytopenia (8.7%) and the lowest severe thrombocytopenia incidence was observed in FOLFOX4 groups.
Of 1,094 patients without neutropenia at baseline, 690 patients (63.1%) developed neutropenia during chemotherapy. Severe neutropenia incidence was significantly higher in PC(O)F/PC(O)X group (27.7%) and DC(O)F/DC(O)X group (21.3%) than others. PC(O)F/PC(O)X group and DC(O)F/DC(O)X group also had a higher severe leukopenia incidence (i.e. 23.1% and 22.1%, respectively) compared with others, nearly 4 times more than that of in mFOLFOX7/XELOX group (5.6%).
Frequency of myelotoxicity
The frequency of myelotoxicity (i.e. anaemia, thrombocytopenia, neutropenia and leukopenia) was defined as patients who developed myelotoxicity either before chemotherapy or during the study period. Fig. 1 depicts myelotoxicity frequency profiles for overall and six regimen groups.
Depicts myelotoxicity frequency profiles for overall and six regimen groups. The frequency of myelotoxicity (i.e. anaemia, thrombocytopenia, neutropenia and leukopenia) was defined as patients who developed myelotoxicity either before chemotherapy or during the study period, (A) anaemia, (B) thrombocytopenia, (C) neutropenia, (D) leukopenia, for overall and six regimen groups.
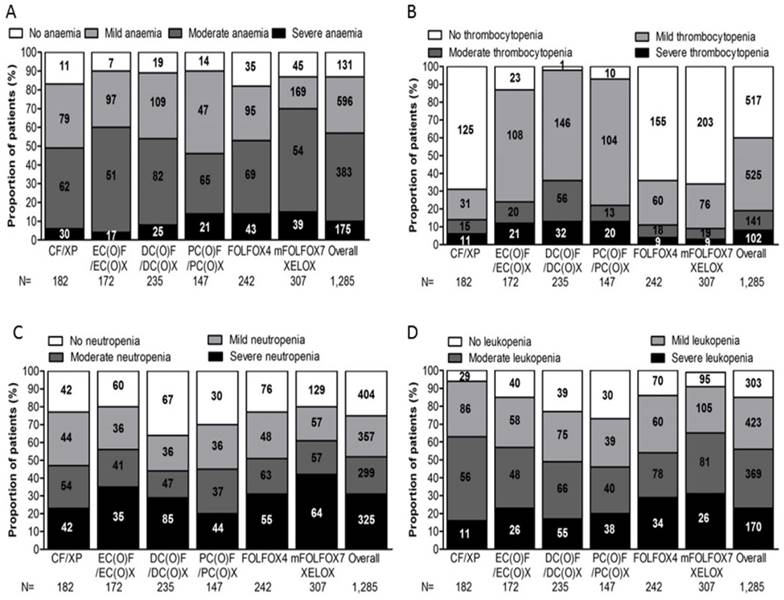
Moderate-to-Severe anaemia was observed in 558 patients (43.4%), the frequency of patients experienced Moderate-to-Severe anaemia was marginally higher than in PC(O)F/PC(O)X group (58.5%) than in others (CF/XP, 50.5%; EC(O)F/EC(O)X, 39.5%; DC(O)F/DC(O)X, 45.9%; FOLFOX4, 46.34%; mFOLFOX7/XELOX, 30.3%; P=0.000). 175 patients (13.6%) developed severe anaemia, statistically significant difference, however, was not observed in the comparisons of percentage of patients who had severe anaemia among the six regimen groups (P=0.113).
18.9% of the 1,285 patients experienced moderate-to-severe thrombocytopenia, the percentage of patients with Moderate-to-Severe thrombocytopenia was 37.4% for DC(O)F/DC(O)X group, 23.8% for EC(O)F/EC(O)X group, 22.4% for PC(O)F/PC(O)X group, 14.3% for CF/XP group and 9.1% for mFOLFOX7/XELOX group(P=0.000). For patients undertaking doublet regimens, the frequency of severe thrombocytopenia was only 2.9% for mFOLFOX7/XELOX group, 3.7% for FOLFOX4 group and 6.0% for CF/XP group. On the contrary, proportion of patients with severe thrombocytopenia were relatively higher in triplet regimen groups, being 13.6% for both DC(O)F/DC(O)X group and PC(O)F/PC(O)X group, 12.2% for EC(O)F/EC(O)X group.
DC(O)F/DC(O)X group was reported with moderate-to-severe neutropenia and severe neutropenia more frequently (56.2%; 36.2%, respectively), followed by those in PC(O)F/PC(O)X group (55.1%; 29.9%), CF/XP group (52.7%; 23.1%), FOLFOX4 group (48.8%; 22.7%), EC(O)F/EC(O)X group (44.2%; 20.3%), mFOLFOX7/XELOX group (39.4%; 20.8%), with significant difference in all study groups (P= .000, P= 0.012).
The frequency of moderate-to-severe leukopenia was higher in DC(O)F/DC(O)X group (53.1%) than those in other regimen groups (51.5%, PC(O)F/PC(O)X; 46.3%, FOLFOX4; 43.0%, EC(O)F/EC(O)X; 36.8, CF/XP; 34.9%, mFOLFOX7/XELOX, P=0.000). As for severe leukopenia, patients in PC(O)F/PC(O)X group were recorded with the highest frequency (25.9%), ahead of that with DC(O)F/DC(O)X (23.4%), EC(O)F/EC(O)X (15.1%), FOLFOX4 (14%), mFOLFOX7/XELOX (8.5%) and CF/XP (6.0%).
Myelotoxicity frequency during the first six cycles
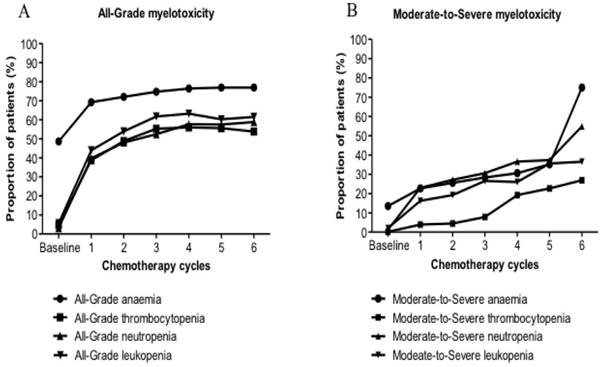
The main epidemiological feature of All-Grade myelotoxicity and Moderate-to-Severe myelotoxicity for all six regimens was increasing observed during the first 6 cycles. The increase of the anaemia population has occurred at a slower rate than that of the population with thrombocytopenia, neutropenia and leukopenia. Similar trends have been detected for each regimen. Compared with doublet regimens, the increase of patients with Moderate-to-Severe myelotoxicity who underwent triplet regimens has occurred at a slightly faster rate (Fig. 2).
Prevalence of (A) all-grade myelotoxicity; (B) moderate-to-severe myelotoxicity, before chemotherapy initiation along with frequency of (A) all-grade myelotoxicity; (B) moderate-to-severe myelotoxicity for six regimen groups during the first six cycles.
Timing of myelotoxicity occurrence
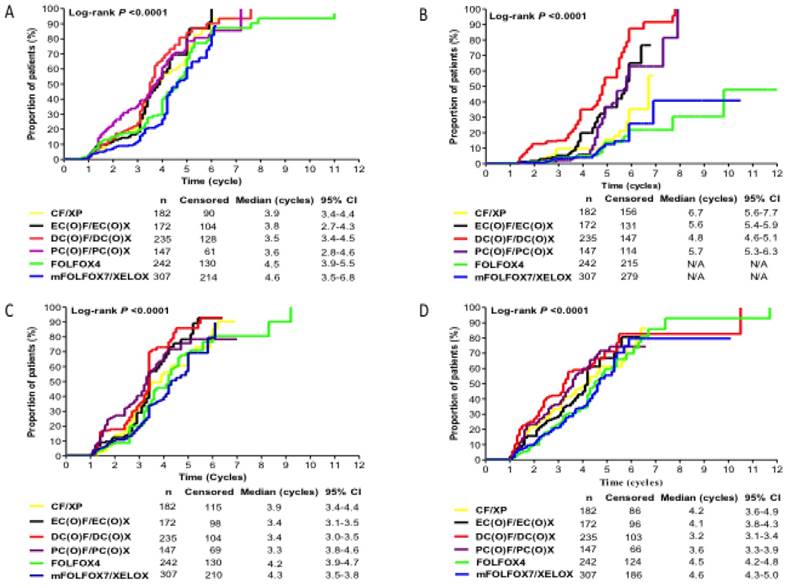
The Kaplan-Meier estimates of time (cycles) to develop moderate-to-severe myelotoxicity events for each regimen group was showed in Fig.3. The proportion of patients who experienced moderate-to-severe myelotoxicity events at any time from the first cycle onwards increased from baseline for all regimen groups. DC(O)F/DC(O)X group presented with moderate-to-severe anaemia, thrombocytopenia, and leukopenia earlier than other regimen groups, with median time of 3.5, 4.8 and 3.2 cycles, respectively. PC(O)F/PC(O)X group had a shortest time to develop Moderate-to-Severe neutropenia (median time, 3.3 cycles) compared with other counterparts (P=0.000). FOLFOX4 and mFOLFOX7/XELOX regimen groups had longer time to experience all Moderate-to-Severe myelotoxicity events.
The Kaplan-Meier estimates of time (cycles) to develop moderate-to-severe myelotoxicity events for each regimen group. Kaplan-Meier estimate of (A) Time (cycles) to develop Moderate-to-Severe anaemia; (B) Time (cycles) to develop Moderate-to-Severe thrombocytopenia; (C) Time (cycles) to develop Moderate-to-Severe neutropenia; (D) Time (cycles) to develop Moderate-to-Severe leukopenia, among patients receiving six selected regimens after initiating chemotherapy.
Identification of predictors for myelotoxicity
A multivariate logistic regression model was applied to identify risk factors influencing the development of moderate-to-severe myelotoxicity events. Variables analyzed included detailed specific factors about patient, disease, and treatment patterns. Statistically significant risk factors predicting patients to experience myelotoxicity events, their adjusted odds ratios and 95% confident interval are listed in Table 2 and Table 3.
Results of multivariate logistic regression analysis for identifying independent risk factors predicting moderate-to-severe anaemia, thrombocytopenia, neutropenia, leukopenia in Chinese Gastric Cancer population receiving chemotherapy
| Moderate-to-Severe anaemia | Moderate- to-Severe thrombocytopenia | Moderate-to-Severe neutropenia | Moderate-to-Severe leukopenia | |||||||||
|---|---|---|---|---|---|---|---|---|---|---|---|---|
| Predictors (n=1,285) | OR* | 95% CI | P | OR* | 95% CI | P | OR* | 95% CI | P | OR* | 95% CI | P |
| Gender: Female | 3.02 | 1.89-4.65 | 0.001 | 1.69 | 1.15-2.49 | 0.000 | 1.4 | 1.09-1.79 | 0.008 | 1.37 | 1.06-1.77 | 0.015 |
| KPS<80 | 1.45 | 1.11-1.90 | 0.006 | 1.95 | 1.55-2.67 | 0.012 | 2.01 | 1.57-2.59 | 0.000 | 1.82 | 1.16-1.90 | 0.006 |
| Baseline Hb<12.0 g/dL | 4.10 | 3.11-5.41 | 0.000 | 2.44 | 2.32-4.96 | 0.005 | 5.36 | 3.01-9.07 | 0.000 | 2.11 | 1.57-2.59 | 0.000 |
| Baseline WBC<4.0×10⁹/L | 1.49 | 1.01-2.18 | 0.044 | 1.45 | 1.11-1.96 | 0.004 | 1.79 | 1.34-2.38 | 0.000 | 2.77 | 1.93-3.97 | 0.000 |
| Comorbidities with COPD/LD/HTD/DT | 5.32 | 3.49-8.09 | 0.000 | 1.71 | 1.18-1.81 | 0.007 | 1.8 | 1.32-2.46 | 0.000 | 1.92 | 1.40-2.63 | 0.000 |
| Previously treated with CT | 1.35 | 0.91-1.85 | 0.147 | 1.48 | 0.78-2.80 | 0.023 | 3.41 | 2.08-5.59 | 0.000 | 1.68 | 1.50-1.89 | 0.005 |
| Triplet combination therapy | 2.01 | 1.57-2.59 | 0.000 | 5.82 | 2.51-11.11 | 0.000 | 1.93 | 1.18-3.18 | 0.009 | 1.82 | 1.41-2.36 | 0.000 |
| Previously treated with Platinum based CT | 1.18 | 1.11-1.96 | 0.005 | 1.68 | 1.50-1.89 | 0.000 | 1.46 | 1.30-1.71 | 0.001 | 2.01 | 1.47-2.59 | 0.000 |
| Previously treated with RT | 1.556 | 1.18-1.81 | 0.000 | 1.82 | 1.41-2.36 | 0.000 | 2.08 | 1.28-2.38 | 0.006 | 3.39 | 2.32-4.96 | 0.000 |
| Previously treated with surgery | 3.41 | 0.91-1.85 | 0.000 | 2.11 | 1.47-2.89 | 0.000 | 2.18 | 3.01-9.07 | 0.000 | 1.47 | 1.11-1.96 | 0.008 |
| BMI≥23.0 Kg/m2 | 1.79 | 1.34-2.38 | 0.000 | 3.39 | 2.32-4.96 | 0.008 | 1.06 | 0.73-1.54 | 0.044 | 1.38 | 1.18-1.81 | 0.013 |
| Regimen | ||||||||||||
| CF/XP | 1.38 | 1.94-4.91 | 0.000 | 1.33 | 0.87-2.05 | 0.009 | 1.82 | 1.22-2.71 | 0.004 | 3.41 | 2.08-5.59 | 0.000 |
| EC(O)F/EC(O)X | 2.08 | 1.28-3.38 | 0.003 | 1.62 | 1.28-2.38 | 0.024 | 1.44 | 0.96-2.17 | 0.007 | 1.81 | 0.75-1.64 | 0.000 |
| DC(O)F/DC(O)X | 2.18 | 1.40-3.40 | 0.001 | 3.97 | 3.01-9.07 | 0.000 | 2.45 | 1.67-3.59 | 0.007 | 1.68 | 1.34-2.38 | 0.000 |
| PC(O)F/PC(O)X | 3.41 | 2.08-5.59 | 0.000 | 1.06 | 0.73-1.54 | 0.000 | 1.71 | 1.11-2.64 | 0.015 | |||
| FOLFOX4 | 1.81 | 1.19-2.75 | 0.006 | 1.01 | 0.92-2.13 | 0.007 | 1.3 | 0.91-1.85 | 0.147 | 3.41 | 2.08-5.59 | 0.000 |
| mFOLFOX7/XELOX | (ref) | (ref) | (ref) | (ref) | ||||||||
| Treatment intention: Palliative | 2.07 | 1.57-2.74 | 0.000 | 1.68 | 1.50-1.89 | 0.005 | 1.49 | 1.16-1.90 | 0.002 | 2.03 | 1.56-2.67 | 0.000 |
| No. cycles received≥4 | 1.79 | 1.34-2.38 | 0.000 | 5.52 | 3.81-7.99 | 0.000 | 2.01 | 1.57-2.59 | 0.000 | 1.99 | 1.54-2.57 | 0.000 |
OR*, adjusted for all the variables listed in Table 1.
Results of multivariate logistic regression analysis for identifying independent risk factors predicting moderate-to-severe myelotoxicity and severe myelotoxicity in patients receiving chemotherapy for gastric cancer (n=1,285).
| Moderate-to-Severe myelotoxicity | Severe myelotoxicity | |||||
|---|---|---|---|---|---|---|
| Predictors | OR* | 95% CI | P | OR* | 95% CI | P |
| Baseline Hb<12.0 g/dL | 3.09 | 2.24-4.28 | 0.000 | 1.77 | 1.35-2.33 | 1.770 |
| Baseline ANC<2.0×10⁹/L | 2.5 | 0.93-6.28 | 0.000 | 4.38 | 3.06-6.28 | 0.000 |
| KPS<80 | 1.68 | 0.84-2.01 | 0.211 | 1.72 | 1.55-1.94 | 0.017 |
| BMI≥23.0 Kg/m2 | 1.38 | 0.17-1.81 | 0.015 | 3.02 | 1.89-4.65 | 0.001 |
| Subsite of tumor: GEJ | 1.59 | 1.36-2.15 | 0.000 | 5.71 | 4.02-8.33 | 0.023 |
| Previously treated with surgery | 4.29 | 2.48-7.42 | 0.000 | 2.13 | 1.05-4.31 | 0.000 |
| Comorbidities with HTN/DM/LD/COPD | 3.47 | 2.07-5.80 | 0.000 | 1.69 | 1.15-2.49 | 0.000 |
| Gender: Female | 2.68 | 1.59-4.53 | 0.000 | 2.34 | 1.65-3.33 | 0.000 |
| Regimen | ||||||
| CF/XP | 2.86 | 2.91-8.12 | 0.000 | 1.76 | 1.13-2.73 | 0.012 |
| EC(O)F/EC(O)X | 2.26 | 1.41-3.62 | 0.001 | 1.93 | 0.84-2.11 | 0.221 |
| DC(O)F/DC(O)X | 3.07 | 1.89-4.99 | 0.000 | 2.57 | 1.70-3.89 | 0.000 |
| PC(O)F/PC(O)X | 4.29 | 2.48-7.42 | 0.000 | 2.22 | 1.39-3.53 | 0.001 |
| FOLFOX4 | 2.07 | 1.36-3.15 | 0.001 | 1.51 | 1.03-2.34 | 0.037 |
| mFOLFOX7/XELOX | 5.51 | 4.08-8.13 | 0.013 | 2.28 | 1.40-3.65 | 0.001 |
| No. cycles received>=4 | 2.3 | 1.68-2.15 | 0.000 | 2.26 | 1.72-2.96 | 0.000 |
| Treatment intention: Palliative | 2.16 | 1.58-2.97 | 0.000 | 1.72 | 1.36-2.25 | 0.000 |
OR*, adjusted for all the variables listed in Table 1
Clinical impacts of myelotoxicity on chemotherapy delivery
As shown in Fig. 4, myelotoxicity events were recorded as the reason for treatment delay≥7 days in 21.1% of the patients and dose reduction≥20% in 16.8% of the study population. Treatment delay≥7 days were more frequently observed in triplet regimen groups than that in doublet regimen groups (63.8% vs. 37.6%, P=0.000). Likewise, triplet regimen groups were also associated with higher proportion of patients experiencing dose reduction≥20% than that of doublet regimen groups (67.1% vs. 38.3%, P=0.000). DC(O)F/DC(O)X group was significantly associated with the highest frequency of treatment delay≥7 days (37.0%) and dose reduction≥20% (31.5%) among all regimen groups. FOLFOX4 regimen was revealed to be the most tolerable regimens whose frequency of treatment delays≥7 days (11.2%) and dose reduction≥20% (7.4%).
Clinical impacts of myelotoxicity on chemotherapy delivery. Frequency of patients with at least one dose reduction during one chemotherapy cycle or experiencing treatment delays with at least one dose delay during one cycle, overall and by treatment regimen in A. Proportion of patients with treatment delays≥7 days or at least one dose reductions≥20% of at least one therapeutic agent by chemotherapy cycles along with the change of actual regimen relative dose intensity (RDI) per cycle during the first six cycles in B.
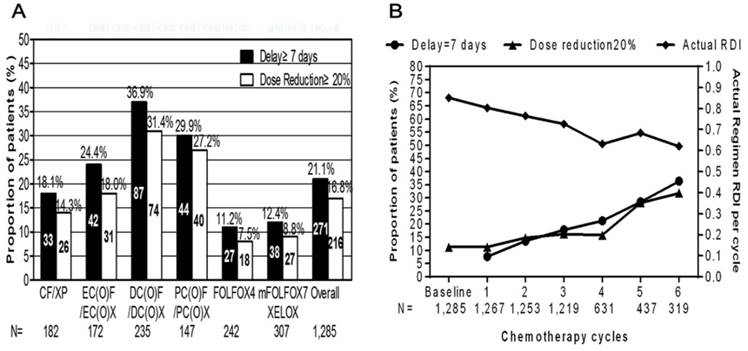
In contrast to the overall increasing trend of treatment delays and chemotherapy dose modification during the first 6 cycles, there has been a decline of actual average RDI for all regimen groups.
Reduced dose intensity had two components: planned reductions in dose intensity when the treatment was initiated and unplanned dose reductions and treatment delays that occurred during the chemotherapy. As shown in Supplementary Fig. 2, both planned and unplanned dose reductions in RDI were most common in DC(O)F/DC(O)X regimen group. Statistical significance was observed when compared actual ARDI among all regimen groups. mFOLFOX7/XELOX regimen group was more likely to receive higher ARDI than others, (P=0.000).
Discussion
Gastric cancer, being the fourth most frequent malignant disease worldwide, constitutes the second leading culprit of cancer-related mortality. Despite an increasing use of targeted agents, the mainstay of Oncology management for gastric cancer remains cytotoxic chemotherapy in both curative and palliative settings. Besides survival benefits, shrunk of the tumor size and reduction of disease-associated symptoms, multicycle polychemotherapy could also be life-threatening and dose-limited by their severe hematotoxic effects on bone marrow generation [10].
This multicenter, prospective, observational study for a population of 1,285 Chinese gastric cancer patients treated with six selected cytotoxic conventional regimens in community settings revealed a high prevalence of anaemia at baseline and increasing trend of myelotoxicity incidence over successive cycles. The prevalence, incidence and frequency of myelotoxicity among our study population were much higher than those of other relevant studies in western countries [11,12]. This is probably due to patient and regimen selection bias, the population we studied were those with gastric cancer executively received platinum-based polychemotherapy, which are known to cause myelotoxicity [13,14]. However, other studies included patients with other type of cancers besides gastric cancer patients irrelevant of treatment modes and chemotherapy regimens [15,16]. Patients with gastric cancer commonly presented with obstruction which lead to eating disorder [17]. Plus, tumor growth also exacerbated patients' lack of nutrition. Blood loss from either surgery or tumor for gastric cancer are often more severe than that for other cancer types. Gastrectomy might result in the deficiency of hematopoietic elements, such as, intrinsic factors and Vitamin B12 [18,19]. All those reasons may count for the high prevalence of anaemia among patients with gastric cancer.
Patients in our study underwent six commonly used regimens, CF/XP, EC(O)F/EC(O)X, DC(O)F/DC(O)X, PC(O)F/PC(O)X, FOLFOX4 and mFOLFOX7/XELOX. To our knowledge, few regimen-specific researches on myelotoxicity have been conducted. In our study, CF/XP regimen was more frequently associated with moderate-to-severe anaemia in patients whose Hb count was normal (36.4%) than other regimens (P=0.000). While, DC(O)F/DC(O)X regimen had the highest incidence of severe thrombocytopenia among all regimen groups. PC(O)F/PC(O)X regimen was reported with the highest incidence of neutropenia and leukopenia in patients who did not have neutropenia nor leukopenia before chemotherapy initiation. FOLFOX4 and mFOLFOX7/XELOX regimen groups were recorded with the marginally lower incidence of anaemia, thrombocytopenia, neutropenia and leukopenia.
Irrespective of patients' baseline myelotoxicity status, PC(O)F/PC(O)X regimen was related with highest frequency of anaemia (Hb<12.0g/dL). The highest frequency of severe thrombocytopenia was in DC(O)F/DC(O)X regimen group (37.4%). DC(O)F/DC(O)X regimen group also had the highest frequency of severe neutropenia (56.2%) and PC(O)F/PC(O)X regimen group had the highest severe leukopenia frequency (25.9%).
Results from several randomized clinical trials that the benefit of palliative chemotherapy was over best supportive care were already reported in the early nineties [20,21]. The growing experience with polychemotherapy in the treatment for gastric cancer contributed to a stronger increase in the administration of palliative chemotherapy [22]. However, polychemotherapy were also associated with more severe myelotoxicity. 508 patients in our study were received chemotherapy with palliative intent, nearly three in four (76.3%) experienced moderate-to-severe myelotoxicity events whose frequency was significantly higher than doublet regimen group (68.3%) (P=0.002). Severe myelotoxicity frequency with triplet regimen group was also reported higher than that in doublet counterpart (43.1% vs 36.8%, P=0.025). This might because after patients underwent multi-lines of chemotherapy, their renal tubules were severely damaged leading to a low production of endogenous hematopoietic growth factors, ultimately resulted in higher frequency of myelotoxicity that patients received curative chemotherapy.
In our study, we also attempted to define the risk factors predictive of myelotoxicity (i.e. anaemia, thrombocytopenia, neutropenia and leukopenia), thereby identifying the subgroup of patients who might benefit from active early interventions in an effort to maintain planned dose delivery. Besides baseline Hb<12.0g/dL, baseline ANC<2.0×10⁹/L, BMI≥23.0 Kg/m2, previously treated with RT, treated with palliative intention, No. cycles received≥4, female gender was found to be associated with the development of moderate-to-severe myelotoxicity events. This is consistent with some previous reports in the treatment for gastrointestinal malignancies, where females experience both greater hematologic and non-hematologic toxicities [23,24]. One possible reason for more myelotoxicity events observed in female population may have to do with influence of the BMI. Females generally have a higher baseline BMI than males due to the body fat, and this may effect drug distribution and potentially increase toxicity. Obesity and high BMI have been proved to be related with a decrease in drug clearance and resultant increase in the half-life elimination for chemotherapy agents [25].
Female gender, baseline Hb<12.0g/dL, baseline ANC<2.0×10⁹/L, chemotherapy regimens, treated with palliative intention, No. cycles received≥4 were also found to be correlated with severe myelotoxicity. In addition, patients whose primary tumor located at GEJ were at higher risk to develop severe myelotoxicity than those with non-GEJ tumor (OR, 5.71; 95% CI, 4.02-8.33; P=0.023). Patients who had comorbidities with HTN/DM/LD/COPD were more risky to experience severe myelotoxicity that patients without coexisting illness (OR, 1.69; 95% CI, 1.15-2.49; P=0.000). Patients who were previously treated with surgery exhibited more risk in developing severe myelotoxicity events than surgery-naïve counterpart (OR, 2.13; 95% CI, 1.05-4.31, P=0.000). The following possible reasons might explain the results, protein barrier function of glomerular filtration membrane of patients who had comorbidities with HTN/DM were often damaged leading to the loss of protein and insufficient synthesis of Hb [26]; patients with LD were frequently presented with low protein level as liver is major organ for protein synthesis; after patients received either partial or total gastrectomy, their physiological functions and state of the gastrointestinal tract could hardly be recovered regardless of the reconstruction methods, food intake amounts were significantly reduced leading to a poor nutrition status seriously affected patients' bone marrow generating abilities. Additionally heavy blood loss from surgery may also result in the low level of Hb and PLT.
Substantial reductions in chemotherapy dose intensity in 21.1% of the study population was observed in our study. Results has shown that both planned and unplanned chemotherapy dose modifications occur, with treatment delays being observed in 214 patients calculating to 16.7% of the study population, resulted in reduced ARDI. The frequency of treatment delays and dose reductions reported here are in consistency with those observed in a study led by an Italian group in 2009 [27,28]. Although data on long-term survival outcomes are not accessible in our study, evidence on the impact of reduced dose intensity on survival in patients have been accumulating. So future studies concerning how reduced dose intensity influence treatment outcomes and survival is highly demanded.
In conclusion, our study revealed that changing patterns of hematopoietic system of patients with gastric cancer before and after chemotherapy. Myelotoxicity events were frequently observed within the gastric cancer population undertaking multicycle polychemotherapy. Predictive models based on risk factors identified for moderate-to-severe myelotoxicity should enable the targeted use of appropriate supportive care in an effort to facilitate the delivery of full chemotherapy doses on schedule.
Supplementary Material
Supplementary figures.
Acknowledgements
The authors thank the following participating centers: Su Dan, Oncology Department, No. 301 Hospital of People's Liberation Army (PLA); Wang Xicheng, Department of Gastrointestinal Oncology, Affiliated Cancer Center of Peking University; Bai Chenmei, Department of Gastrointestinal Oncology, Affiliated Hospital of Peking Union Medical University; Bi Dapeng, Oncology Department, Anshan Hospital; Li Hui, Oncology Department, No. 81 Hospital of People's Liberation Army (PLA); Chen Yali, Oncology Department, Hosptial of Dalian Port; Zhang Yang, Oncology Department, The Second Affiliated Hospital of Dalian Medical University, Cao Bing, Oncology Department, Affiliated Cancer Center of Fudan University, Chen Shuchuan, Department of Gastroenterology, No.1 Hospital of Guangzhou; Yang Dongdong, Oncology Department, The First Affiliated Hospital of Harbin Medical University, Han Bo, Oncology Department, The Second Affiliated Hospital of Harbin Medical University; Lou Changjie, Oncology Department, The Third Affiliated Hospital of Harbin Medical University; Luo Yan, Cancer Center of Henan Province; Liu Pengfei, Department of Surgical Oncology, Cancer Center of Heilongjiang Province; Zhu Haitao, Department of Surigical Oncology, Cancer Center of Liaoning Province; Hu Yingying, Oncology Department, South Hospital; Jiang Yan, Department of Radiation Oncology, Cancer Center of Shandong Province; Zhao Chengmin, Oncology Department, General Hospital of Shenyang Military Region; Zheng Wei, Oncology Department, Shenzhen Hospital; Zhang Peng, Cancer Center of Sichuan Province; Wang Ning, Department of Oncology, Changhai Hospital; Wang Jiejun, Department of Oncology, Changezheng Hospital; Zheng Yi. Department of Oncology, The First Affiliated Hospital of Zhejiang University; Yu Pengfei, Department of Surgical Gastroenterology, Cancer Center of Zhejiang Province; Gao Ming, Department of Oncology, The First Affiliated Hospital of Zhengzhou University; Zhao Mingfang, Department of Oncology, The First Affiliated Hospital of Chinese Medical University; Xie Yongsheng, Department of Oncology, Cancer Center of Sun Yat-Sen University; Wang Ting, Department of Oncology, Cancer Center of Chongqing.
Competing Interests
The authors have declared that no competing interest exists.
References
1. Daniel D, Crawford J. Myelotoxicity from chemotherapy. Semin Oncol. 2006;33:74-85
2. Kurtin S. Myeloid toxicity of cancer treatment. J Adv Pract Oncol. 2012;3:209-24
3. Wagner AD, Grothe W, Haerting J. et al. Chemotherapy in advanced gastric cancer: a systematic review and meta-analysis based on aggregate data. J Clin Oncol. 2006;24:2903-9
4. Bittoni A, Del Prete M, Scartozzi M. et al. Three drugs vs two drugs first-line chemotherapy regimen in advanced gastric cancer patients: a retrospective analysis. Springerplus. 2015;4:743
5. Wong R, Cunningham D. Optimising treatment regimens for the management of advanced gastric cancer. Ann Oncol. 2009;20:605-8
6. Repetto L, investigators C. Incidence and clinical impact of chemotherapy induced myelotoxicity in cancer patients: an observational retrospective survey. Crit Rev Oncol Hematol. 2009;72:170-9
7. Tas F, Yildiz I, Kilic L. et al. Same Chemotherapy Regimen Leads to Different Myelotoxicity in Different Malignancies: A Comparison of Chemotherapy-Associated Myelotoxicity in Patients With Advanced Ovarian and Non-Small-Cell Lung Cancer. Am J Ther. 2013
8. Peintinger F, Georgoulopoulos A, Ralph G. et al. Retrospective comparison of chemotherapy-induced myelotoxicity in patients with ovarian cancer under and over 60 years of age. J Chemother. 2006;18:656-61
9. Weycker D, Barron R, Edelsberg J. et al. Risk and consequences of chemotherapy-induced neutropenic complications in patients receiving daily filgrastim: the importance of duration of prophylaxis. BMC Health Serv Res. 2014;14:189
10. Abou Saleh M, Mafiana RN, Al Za'abi M. et al. Epidemiology of chemotherapy-induced neutropenia at a tertiary university hospital in Oman. Int J Clin Pharm. 2013;35:1036-9
11. Groopman JE, Itri LM. Chemotherapy-induced anemia in adults: incidence and treatment. J Natl Cancer Inst. 1999;91:1616-34
12. Zinzani PL. Complications of cytotoxic chemotherapy in older patients: focus on myelotoxicity in lymphomas. Crit Rev Oncol Hematol. 2003;48:S27-31
13. Ludwig H, Van Belle S, Barrett-Lee P. et al. The European Cancer Anaemia Survey (ECAS): a large, multinational, prospective survey defining the prevalence, incidence, and treatment of anaemia in cancer patients. Eur J Cancer. 2004;40:2293-306
14. Seshadri T, Prince HM, Bell DR. et al. The Australian Cancer Anaemia Survey: a snapshot of anaemia in adult patients with cancer. Med J Aust. 2005;182:453-7
15. Caggiano V, Weiss RV, Rickert TS. et al. Incidence, cost, and mortality of neutropenia hospitalization associated with chemotherapy. Cancer. 2005;103:1916-24
16. Kelland L. The resurgence of platinum-based cancer chemotherapy. Nat Rev Cancer. 2007;7:573-84
17. Sastre J, Garcia-Saenz JA, Diaz-Rubio E. Chemotherapy for gastric cancer. World J Gastroenterol. 2006;12:204-13
18. Laviano A, Meguid MM, Inui A. et al. Therapy insight: Cancer anorexia-cachexia syndrome-when all you can eat is yourself. Nat Clin Pract Oncol. 2005;2:158-65
19. Hu Y, Kim HI, Hyung WJ. et al. Vitamin B(12) deficiency after gastrectomy for gastric cancer: an analysis of clinical patterns and risk factors. Ann Surg. 2013;258:970-5
20. Stabler SP. Clinical practice. Vitamin B12 deficiency. N Engl J Med. 2013;368:149-60
21. Pyrhonen S, Kuitunen T, Nyandoto P. et al. Randomised comparison of fluorouracil, epidoxorubicin and methotrexate (FEMTX) plus supportive care with supportive care alone in patients with non-resectable gastric cancer. Br J Cancer. 1995;71:587-91
22. Glimelius B, Ekstrom K, Hoffman K. et al. Randomized comparison between chemotherapy plus best supportive care with best supportive care in advanced gastric cancer. Ann Oncol. 1997;8:163-8
23. Murad AM, Santiago FF, Petroianu A. et al. Modified therapy with 5-fluorouracil, doxorubicin, and methotrexate in advanced gastric cancer. Cancer. 1993;72:37-41
24. Sloan JA, Goldberg RM, Sargent DJ. et al. Women experience greater toxicity with fluorouracil-based chemotherapy for colorectal cancer. J Clin Oncol. 2002;20:1491-8
25. Singh S, Parulekar W, Murray N. et al. Influence of sex on toxicity and treatment outcome in small-cell lung cancer. J Clin Oncol. 2005;23:850-6
26. Chansky K, Benedetti J, Macdonald JS. Differences in toxicity between men and women treated with 5-fluorouracil therapy for colorectal carcinoma. Cancer. 2005;103:1165-71
27. Sowers JR, Epstein M. Diabetes mellitus and associated hypertension, vascular disease, and nephropathy. An update. Hypertension. 1995;26:869-79
28. Celio L, Sternberg CN, Labianca R. et al. Pemetrexed in combination with oxaliplatin as a first-line therapy for advanced gastric cancer: a multi-institutional phase II study. Ann Oncol. 2009;20:1062-7
Author contact
![]() Corresponding author: Department of oncology, Beijing 307 People's Liberation Army Hospital Cancer Centre, Beijing, China; Fax and phone number: +8610 66947114; email: zsdxcancercom
Corresponding author: Department of oncology, Beijing 307 People's Liberation Army Hospital Cancer Centre, Beijing, China; Fax and phone number: +8610 66947114; email: zsdxcancercom