Impact Factor ISSN: 1837-9664

 Global reach, higher impact
J Cancer 2017; 8(9):1517-1524. doi:10.7150/jca.17878 This issue Cite
Research Paper
Gene Signal Distribution and HER2 Amplification in Gastroesophageal Cancer
Jan Trøst Jørgensen1 ![]() , Karsten Bork Nielsen2, Gitte Kjærsgaard2, Anna Jepsen2, Jens Mollerup2
, Karsten Bork Nielsen2, Gitte Kjærsgaard2, Anna Jepsen2, Jens Mollerup2
1. Dx-Rx Institute, Baunevaenget 76, DK-3480 Fredensborg, Denmark;
2. Agilent Technologies, Produktionsvej 42, DK-2600 Glostrup, Denmark.
Received 2016-10-11; Accepted 2017-3-31; Published 2017-6-1
Abstract
Background: HER2 serves as an important therapeutic target in gastroesophageal cancer. Differences in HER2 gene signal distribution patterns can be observed at the tissue level, but how it influences the HER2 amplification status has not been studied so far. Here, we investigated the link between HER2 amplification and the different types of gene signal distribution.
Methods: Tumor samples from 140 patients with gastroesophageal adenocarcinoma where analyzed using the HER2 IQFISH pharmDx™ assay. Specimens covered non-amplified and amplified cases with a preselected high proportion of HER2 amplified cases. Based on the HER2/CEN-17 ratio, specimens were categorized into amplified or non-amplified. The signal distribution patterns were divided into homogeneous, heterogeneous focal or heterogeneous mosaic. The study was conducted based on anonymized specimens with limited access to clinicopathological data.
Results: Among the 140 analyzed specimens 83 had a heterogeneous HER2 signal distribution, with 62 being focal and 21 of the mosaic type. The remaining 57 specimens had a homogeneous signal distribution. HER2 amplification was observed in 63 of the 140 specimens, and nearly all (93.7%) were found among specimens with a heterogeneous focal signal distribution (p<0.0001). The mean HER2/CEN-17 ratio for the focal heterogeneous group was 8.75 (CI95%: 6.87 - 10.63), compared to 1.53 (CI95%: 1.45 - 1.61) and 1.70 (CI95%: 1.22 - 2.18) for the heterogeneous mosaic and homogeneous groups, respectively, (p<0.0001).
Conclusions: A clear relationship between HER2 amplification and the focal heterogeneous signal distribution was demonstrated in tumor specimens from patients with gastroesophageal cancer. Furthermore, we raise the hypothesis that the signal distribution patterns observed with FISH might be related to different subpopulations of HER2 positive tumor cells.
Keywords: gastroesophageal cancer, HER2, FISH, signal distribution, tumor heterogeneity, companion diagnostics.
Introduction
Amplification of the human epidermal growth factor receptor 2 (HER2) gene and overexpression of the HER2 protein is found in a number of human cancers, including breast and gastroesophageal cancer. The gene for HER2 (also known as ErbB-2, c-erbB2 or Her2/neu) is a proto-oncogene located on the chromosome 17q. This gene encodes a 185-kDa transmembrane tyrosine kinase receptor protein that is a member of the human epidermal growth factor receptor family, which consists of HER1 (EFGR), HER2, HER3, and HER4. HER2 forms both homo- and heterodimers with the different members of the HER family, thereby serving as a critical dimerization partner, which leads to activation of downstream signaling pathways associated with cell proliferation, differentiation, survival and angiogenesis (1, 2). Amplification of the HER2 gene in gastric cancer was first described in 1986, and since then a large number of studies have confirmed this finding (2, 3).
In both gastroesophageal and breast cancer HER2 serves as an important therapeutic target. For gastroesophageal cancer, the clinical utility of HER2 targeted therapy was demonstrated in the ToGA trial, in which HER2-positive patients with advanced disease were randomized to receive 5-FU/capecitabine and cisplatin, either alone or in combination with trastuzumab (Herceptin®, Roche/Genentech). A clinically relevant and statistically significant gain in overall survival was observed in patients who received the combined treatment of trastuzumab plus chemotherapy (4). Based on the positive results from the ToGA trial, HER2 testing of gastroesophageal cancer patients is now routinely performed in most pathology laboratories where both immunohistochemistry (IHC) and fluorescence in situ hybridization (FISH) assays serve as companion diagnostics for trastuzumab. In general, a positive HER2 status is found in approximately 15% to 20% of patients with gastroesophageal cancer (2).
Due to the differences in tumor biology, HER2 testing in gastroesophageal cancer with IHC and FISH differs from breast cancer. The gastric cancer tissue more frequently shows HER2 heterogeneity and incomplete membrane staining, and consequently a specific gastric cancer scoring system is used (5,6,7). In the ToGA trial, HER2 positivity was defined as being either IHC3+ or FISH+ (HER2/CEN-17 ≥ 2.0), and based on the results from this study, a specific testing algorithm was developed. Here, IHC is regarded as the primary test, with FISH as a reflex test in borderline cases of IHC2+. However, as almost all patients in the ToGA trial had a FISH and IHC test performed, the US FDA recommends that both IHC2+ and IHC3+ cases are reflex tested with FISH (8).
When the HER2 FISH pharmDx (Dako) assay used during the ToGA trial, was developed for determination of HER2 gene amplification in gastroesophageal cancer specimens, differences in the HER2 signal distribution at the tissue level was observed as compared to breast cancer. In the gastroesophageal cancer tissue, the distribution of HER2 signals can be either homogeneous or heterogeneous, and further the heterogeneous distribution can be categorized as either focal or mosaic. These phenotypical characteristics are briefly described in the instruction for use (IFU) for the HER2 IQFISH pharmDx™ assay, and here, it is stated that the different HER2 signal distribution patterns should be recognized in relation to the selection of tumor area for the signal enumeration (9). If and how the signal distribution influences the HER2 amplification status has not been studied so far. Here, we report a study aimed to investigate whether a link between HER2 amplification and the different signal distribution patterns in tumor specimens from patients with gastroesophageal cancer exists. Furthermore, we raise the hypothesis that the signal distribution patterns observed with FISH might be related to different subpopulations of HER2 positive cancer cells.
Materials and Methods
Tissue Specimens
A total of 140 formalin-fixed, paraffin-embedded (FFPE) gastroesophageal adenocarcinoma specimens were included in the study, which covered both resections and biopsies. All specimens were residual, de-identified FFPE blocks originating from individual patients and were prepared according to the IFU for the HER2 IQFISH pharmDx assay and subsequently cut in serial sections of 4μm and mounted on glass slides (9). The specimens were obtained from commercial providers or local hospitals and the patient identities were not traceable. For each specimen, a pathologist identified the tumor area, which was indicated directly on a hematoxylin and eosin stained slide. Inclusion criteria were not related to signal distribution in the specimens, but acceptable tumor morphology and signal quality was required for inclusion. Additionally, specimens were included to represent comparable numbers of HER2 amplified and non-amplified cases as well as comparable numbers within the HER2 protein expression levels 0/1+, 2+ and 3+ (see Table 1) as determined by HercepTest™ according to the manufacturer's recommendations. The study was conducted in accordance with the current version of the World Medical Association Declaration of Helsinki. The study protocol was not submitted to an Ethics Committee (EC) as this type of analytical study in Denmark is exempt from EC approval. The specimens in the study were part of an internal validation study where the HER2 IQFISH pharmDx assay was compared to an automated version of the assay (Dako Omnis) (10).
Tabulation of gastric cancer specimen location, type and HercepTest score by HER2 status. The HER2 status was determined according to the manufacturer's instructions for manual HER2 IQFISH pharmDx.
| HER2amplified | HER2non-amplified | N | |
|---|---|---|---|
| Specimen location | |||
| Gastric | 52 | 62 | 114 |
| Gastric esophageal junction | 11 | 15 | 26 |
| All specimen locations | 63 | 77 | 140 |
| Specimen type | |||
| Biopsy | 4 | 6 | 10 |
| Resection | 59 | 71 | 130 |
| All specimen types | 63 | 77 | 140 |
| HercepTest score | |||
| 0 | 2 | 32 | 34 |
| 1+ | 0 | 15 | 15 |
| 2+ | 21 | 27 | 48 |
| 3+ | 40 | 3 | 43 |
| All HercepTest scores | 63 | 77 | 140 |
HER2 IQFISH pharmDx and fluorescence microscopy
The gastroesophageal tumor specimens were stained manually with the HER2 IQFISH pharmDx assay, which contains all key reagents required to complete a FISH procedure. Briefly, the cut specimen sections were exposed to heat pre-treatment using a microwave oven, and were then digested with pepsin at 37 °C to prepare the tissue for probe hybridization. Co-denaturation of probe and tissue target DNA was performed for 10 minutes at 66 °C followed by hybridization at 45 °C for 90 minutes using a Hybridizer (Agilent Technologies). The hybridization was performed using the RTU HER2/CEN-17 FISH Probe Mix based on a combination of a Texas Red-labeled DNA probe (HER2) and a fluorescein-labeled PNA probe (CEN-17). Following hybridization, specimen sections were subjected to stringent wash at 63 °C for 10 minutes before dehydration and drying. Dried slides were subsequently mounted using Fluorescence Mounting Medium containing 4',6-diamidino-2-phenylindole (DAPI) and cover slipped. The HER2 IQFISH stained slides were evaluated and enumerated using a fluorescence microscope equipped with 20×, 40× and 100× objectives and appropriate fluorescence filters for detection of the Texas Red labeled HER2 DNA and fluorescein labeled CEN-17 PNA probe signals (9, 11). Images were captured on an Olympus BX63 fluorescence microscope equipped with a DP73 camera using an Omega fluorescein / Texas Red dual band filter.
Assessment of Tissue Specimens
The assessment of the gene signal distribution was performed by locating the tumor within the context of the H&E stained slide and evaluating the same area on the FISH stained slide and subsequently determine the overall signal distribution (homogenous or heterogeneous). In case of heterogeneous signal distribution, it was then determined whether focal or mosaic distribution was present. The HER2/CEN-17 ratio was calculated based on the enumeration of 20 nuclei from the invasive tumor area. Based on this ratio, the specimens were categorized into amplified (HER2/CEN-17 ≥ 2.0) or non-amplified (HER2/CEN-17 < 2.0) HER2 status. Specimens with a ratio between 1.8 and 2.2 (borderline cases) were subjected to enumeration of additional 40 nuclei and the ratio was then recalculated for these 40 nuclei to determine if HER2 amplification was present or not. In every stained section the presence of 1-2 clearly visible red and green signals in normal cells served as an internal quality control of the staining reaction (9, 11).
Results
The gastric cancer specimens examined in this study are primarily from the stomach region (81%) with the remaining specimens from the gastroesophageal junction (19%) (Table 1). The majority of specimens are resections (93%) and a minor fraction are biopsies (7%) (Table 1).
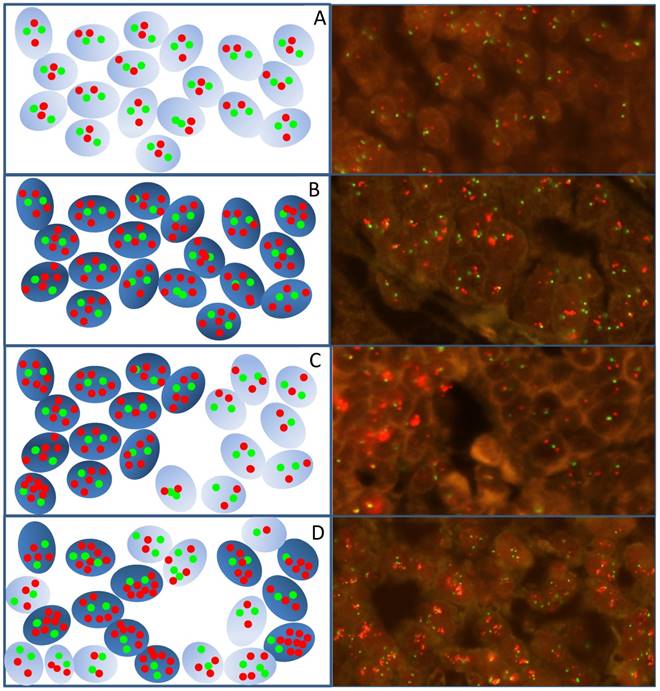
Examinations of gastroesophageal cancer tissues revealed that the distribution of fluorescent HER2 signals following HER2/CEN-17 FISH staining was not uniform and different signal distribution patterns were identified as illustrated by the drawings and fluorescence images from gastroesophageal specimens in Figure 1. These signal distribution patterns can be divided into the subgroups homogeneous and heterogeneous. Homogeneous signal distribution is defined by the same level of HER2 gene copies in all tumor nuclei (Figure 1, A and B), whereas, heterogeneous signal distribution is characterized by a variable number of HER2 gene copies in the tumor nuclei of a specimen. The heterogeneous signal distribution pattern can be subdivided into a focal (Figure 1C) and a mosaic (Figure 1D) pattern depending on whether the nuclei of tumor cells with variable HER2 gene copies are grouped together or are interspersed in the tumor tissue, respectively.
Images and schematic illustrations exemplify the different signal distribution patterns identified in gastroesophageal cancer specimens analyzed with HER2 IQFISH pharmDx™. A) HER2 non-amplified tumor cells. B) HER2 amplified tumor cells with homogeneous signal distribution. C) HER2 amplified tumor cells with heterogeneous focal signal distribution with grouped amplified tumor cells surrounded by non-amplified tumor cells. D) Amplified tumor cells with a heterogeneous mosaic signal distribution pattern where the HER2 amplified and non-amplified tumors cells are interspersed. The red dots indicate HER2 signals and green dots indicate CEN-17 signals. Amplified cells are indicated in dark blue in the schematic and non-amplified are light blue. Images are generated at 400x.
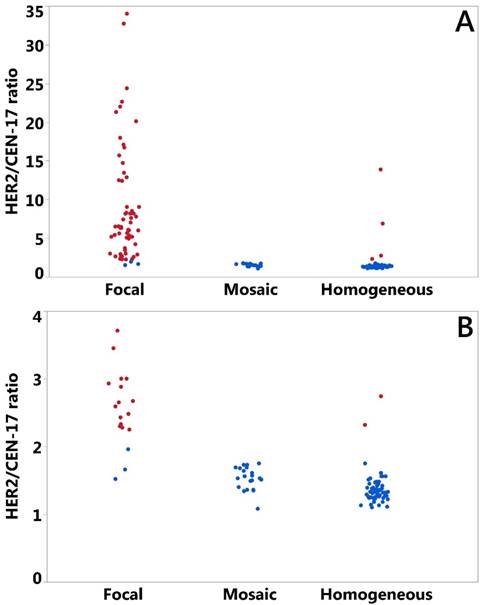
The gastric cancer specimens were inspected for the HER2 signal distribution in the tumor part according to the definitions described and illustrated above. A total of 83 specimens had heterogeneous HER2 signal distribution with 62 being focal and 21 of the mosaic type (Table 2). Homogeneous signal distribution was observed in 57 specimens (Table 2). The HER2/CEN-17 ratios were determined for all specimens using the US FDA approved HER2 IQFISH pharmDx according to the manufacturer's instructions (see Materials and Methods section) (9). To illustrate HER2/CEN-17 ratios in the three signal distribution groups plots were made for all specimens (Figure 2A) and for the subset with a maximum HER2/CEN-17 ratio at 4 (Figure 2B). In both plots in Figure 2 red color indicates an amplified HER2 status and a blue color indicates non-amplified HER2 status. Additionally, descriptive values for the HER2/CEN-17 ratio (mean, median, 95% confidence intervals (CI95%), and N) in each signal distribution group is shown in Table 2. We also observed a difference between the HER2/CEN-17 ratio in tissue of gastric versus esophageal origin. Mean HER2/CEN-17 ratio in the gastric specimens was 5.20 (CI95%: 3.96 - 6.44) and 3.03 (CI95%: 2.12 - 3.95) in the esophageal specimens (data not shown).
Mean, median, 95% confidence limits and N for HER2/CEN-17 ratios by signal distribution pattern. The HER2/CEN-17 ratio was determined according to the manufacturer's instructions for manual HER2 IQFISH pharmDx.
| HER2/CEN-17 ratio | ||||
|---|---|---|---|---|
| Mean | Median | 95% confidence limits | N | |
| Focal heterogeneous | 8.75 1,2 | 6.32 | 6.87 - 10.63 | 62 |
| Mosaic heterogeneous | 1.53 1,3 | 1.53 | 1.45 - 1.61 | 21 |
| Homogeneous | 1.70 1 | 1.33 | 1.22 - 2.18 | 57 |
| All | 4.80 | 1.69 | 3.77 - 5.83 | 140 |
1) HER2/CEN-17 ratio mean significantly different from the overall ratio mean by ANOM for transformed ranks (p<0.002).2) HER2/CEN-17 ratio mean significantly different from the ratio means of mosaic heterogeneous and homogeneous group by Wilcoxon (p<0.0001). 3) HER2/CEN-17 ratio mean significantly different from the ratio mean of the homogeneous group by Wilcoxon (p<0.0005).
Plot of HER2/CEN-17 ratios (N=140) determined by HER2 IQFISH pharmDx™ staining of the gastric cancer specimens by signal distribution group. All specimens are illustrated in A) and in B) specimens up to a HER2/CEN-17 ratio of 4.0 are plotted. Blue data points indicate non-amplified HER2 status and red data points indicate amplified HER2 status. Random jittering by SAS JMP was included to better visualize overlying or nearby data points.
The concordance between HER2 FISH and HER2 IHC for the gastric cancer specimens can be calculated from the data in Table 1. These data show a 95.9% (CI95%: 86.3-98.9) agreement between HER2 non-amplified and IHC 0/1+ groups and a 93.0% (CI95%: 81.4-97.6) agreement between HER2 amplified and the IHC 3+ group. Furthermore, overall agreement for the 0/1+ and 3+ groups can be calculated at 94.6% (CI95%: 87.9-97.7).
From Figure 2 and Table 2 a clear tendency can be observed towards a higher HER2/CEN-17 ratio in the heterogeneous focal HER2 signal distribution group of the gastric cancer specimens studied. Comparison of mean HER2/CEN-17 ratios between the focal heterogeneous group and the mosaic heterogeneous and homogeneous groups indicated an elevated HER2/CEN-17 ratio in the focal heterogeneous distribution group. By data analysis in JMP 12.2 it was observed that HER2/CEN-17 ratios were not well described by the normal distribution even following Box Cox transformation. Therefore, for comparison of mean HER2/CEN-17 ratios in the three distribution groups, robust data analyses using nonparametric testing with ANOM (Analysis of Means with transformed ranks) and the Wilcoxon test were performed. ANOM of transformed ranks showed that the mean HER2/CEN-17 ratios in each of the three signal distribution groups differed significantly from the overall mean (p<0.002). In addition, Wilcoxon tests indicated that the mean HER2/CEN-17 ratio of the heterogeneous focal group differed significantly from the heterogeneous mosaic group and the homogeneous group (p<0.0001). Wilcoxon tests also revealed that the HER2/CEN-17 ratio mean of the heterogeneous mosaic group differed significantly from the homogeneous group (p<0,0005). Therefore, the data obtained in this study shows that HER2/CEN-17 ratios in gastric cancer specimens with focal heterogeneous HER2 signal distribution are significantly higher compared to gastric cancer specimens with homogeneous or mosaic heterogeneous HER2 signal distribution.
To clarify if the HER2/CEN-17 ratio differences between signal distribution groups were mirrored by differences in HER2 status, cross-tabulation of HER2 status in the three groups are presented (Table 3). Chi-square test (Pearson) of the hypothesis that the frequency of HER2 non-amplified and HER2 amplified specimens are identical in the signal distribution groups revealed a low p value (p<0.0001), indicating that these frequencies are significantly different. In addition, comparison using Fisher's test between individual signal distribution groups revealed significant difference between HER2 status of the heterogeneous focal and heterogeneous mosaic distribution groups (p<0.0001) as well as between the heterogeneous focal and homogeneous signal distribution groups (p<0.0001). Between the heterogeneous mosaic and homogeneous signal distribution groups a high p value (p=0.57) was found, indicating no difference in HER2 status between these groups.
Tabulation of number of gastric cancer specimens in HER2 signal distribution group by HER2 FISH status. Number in parenthesis indicate percent observed in signal distribution group.
| HER2 amplified | HER2 non-amplified | N | |
|---|---|---|---|
| Heterogeneous-focal 1 | 59 (93.7%) | 3 (3.9%) | 62 |
| Heterogeneous-mosaic 2 | 0 (0.0%) | 21 (27.3%) | 21 |
| Homogeneous | 4 (6.3%) | 53 (68.8%) | 57 |
| Total | 63 (100.0%) | 77 (100.0%) | 140 |
Frequency of HER2 status different between groups by Pearson Chi-square test (p<0.0001)1) HER2 status significantly different to Heterogeneous mosaic and Homogeneous group by Fishers test (p<0.0001).2) HER2 status not significantly different to Homogeneous group by Fishers test (p=0.57).
Discussion
Different HER2 signal distribution patterns can be observed in tissue specimens from patients with gastroesophageal cancer; however, what this means in relation to HER2 amplification has not been studied systematically so far. In the current study, we investigated the relationship between HER2 amplification and the different signal distribution patterns in tumor specimens from patients with gastroesophageal cancer.
The 140 tissue specimens in the study sample mainly originated from patients with gastric cancer; however, approximately 20% of these came from patients with gastric esophageal junction cancer. The proportion of HER2 amplified specimens in the study sample was 45%, which is somewhat higher than the approximately 15% to 20% that would have been expected from an unselected population of patients with gastroesophageal cancer (2). The reason for the high proportion of HER2 positive specimen in the study sample is that originally, they were selected for a validation study where a certain proportion of both HER2 positive and negative specimens were required (10). The high proportion of HER2 positive specimens in the current study sample should be considered an advantage for the purpose of the study. Had the prevalence of HER2 positive specimens been lower it would have been more difficult to obtain significant results. The IHC HER2 status were known for all specimens included in the study, and when calculating the agreement between IHC and FISH the results were well in line with a recent reported meta-analysis based on data from more than 12,000 gastric cancer patients (12).
Based on the current study sample we demonstrate that HER2 amplification in gastroesophageal cancer is closely linked to the focal heterogeneous signal distribution. Nearly 94% of all the specimens that had a HER2/CEN-17 ≥ 2.0 was found in the focal heterogeneous group. Using Fisher's test, the HER2 status for this group was found to be highly significantly different compared to the heterogeneous mosaic and homogeneous groups. Furthermore, the mean HER2/CEN-17 ratio for the focal heterogeneous group was 8.75 (CI95%: 6.87 - 10.63), which is several times higher than the mean HER2/CEN-17 ratio for the two other groups. For the heterogeneous mosaic and homogeneous groups, the mean HER2/CEN-17 ratios were 1.53 (CI95%: 1.45 - 1.61) and 1.70 (CI95%: 1.22 - 2.18), respectively. Both the ANOM and the Wilcoxon tests showed that the mean HER2/CEN-17 ratio for the focal heterogeneous group was highly significantly different compared to the two other signal distribution groups. To the best of our knowledge, it is the first time that such strong link between HER2 amplification and the signal distribution pattern has been shown in gastroesophageal cancer. A relationship between focal HER2 amplification and gastroesophageal cancer has been described sporadically in other studies but not previously while using the definitions of focal, mosaic and homogeneous signal distributions (13, 14).
HER2 overexpression is a well described driver of carcinogenesis that has been shown to impair cellular organization by disrupting cell polarity and cellular adhesion (15), to promote cellular migration and invasion (16), and also to lead to uncontrolled proliferation by interference with cell cycle regulators such as cyclin D1 and p27 (17). There is also indication that HER2 overexpression via HER2-HER3 heterodimer formation leads to transformation involving activation of the PI3K/Akt and MAPK pathway (18, 19). The effect of HER2 overexpression on cancer cell phenotype and growth properties in tumors has been shown to depend on activation of SH2 domain containing proteins such as src-kinase, that is known to regulate integrin signaling and focal adhesions (20). Interestingly, src kinase inhibition in HER2 overexpressing breast tumor cells has revealed different growth phenotypes ranging from inhibition of invasiveness to complete growth inhibition (19).
Intra tumor heterogeneity and tumor aneuploidy are important mechanisms for development of drug resistance (21), and tumor characterization or stratification by in situ hybridization techniques offer the possibility to combine genetic/chromosomal information with spatial phenotypic characteristics of tumors. In this dataset, the observation that a characteristic tumor growth pattern in gastric cancer is linked to HER2 amplification could suggest that the HER2 positive tumor cells are mainly dominant with respect to the focal growth pattern. In a recent study of intra-tumor heterogeneity of breast cancers, the HER2 amplified and HER2 non-amplified genetic components were investigated using copy number profiling and sequencing (22). It was found that HER2 gene amplification was heterogeneously distributed within a given tumor, and it was also observed that alternative driver genetic alterations between the HER2 amplified and HER2 non-amplified part of a given tumor differed. Therefore, we speculate that the intra-tumor phenotypic difference in cancer growth exemplified by the variable signal distribution patterns of gastric cancer cells could be attributed to underlying genetic heterogeneity.
If we assume that the different signal distribution patterns represent different subtypes of HER2 positive cells, the next step would be to speculate about the clinical impact. Currently, trastuzumab is the only approved HER2-targeted drug for treatment of HER2 positive gastroesophageal cancer, and far from all patients respond adequately (4, 23, 24). In order to achieve a higher predictive value of the current ISH tests, determination of the signal distribution patterns might be a supplement that could increase the value of these tests. Likewise, as a number of new HER2 targeted compounds, both small molecules as well as antibodies, are under development, the signal distribution patterns might help to improve the predictability of these new drugs (8). These questions will need to be addressed in future studies.
As the current study was performed based on anonymized specimens no or very few clinicopathological patient characteristics have been available. This should be considered a drawback and the possibilities of doing different exploratory analyses are limited. However, taken these limitations into consideration the study has been able to demonstrate a clear relationship between HER2 amplification and the focal heterogeneous signal distribution in patients with gastroesophageal cancer. Furthermore, based on the phenotypical characteristics of the different signal distribution patterns we have raised the hypothesis that the related HER2 positive tumor cells might belong to different subpopulations. In the literature, it has been suggested that HER2 overexpression and/or amplification might be one of the molecular abnormalities linked to the development of gastric cancer (19, 25, 26). If and how the HER2 signal distribution patterns play a role in cancer development further research may show.
Acknowledgements
The publication was supported by a grant from the Dx-Rx Institute, Fredensborg, Denmark.
Conflict of Interest
Jan Trøst Jørgensen has worked as a consultant for Agilent Technologies and Euro Diagnostica, and has given lectures at meetings sponsored by AstraZeneca, Merck Sharp & Dohme, and Roche. Karsten Bork Nielsen, Gitte Kjærsgaard, Anna Jepsen, and Jens Mollerup are employees of Agilent Technologies.
References
1. Ross JS, Slodkowska EA, Symmans WF. et al. The HER-2 receptor and breast cancer: ten years of targeted anti-HER-2 therapy and personalized medicine. Oncologist. 2009;14:320-368
2. Jørgensen JT, Hersom M. HER2 as a Prognostic Marker in Gastric Cancer - A Systematic Analysis of Data from the Literature. J Cancer. 2012;3:137-144
3. Yamamoto T, Ikawa S, Akiyama T. et al. Similarity of protein encoded by the human c-erb-B-2 gene to epidermal growth factor receptor. Nature. 1986;319:230-234
4. Bang YJ, Van Cutsem E, Feyereislova. et al. Trastuzumab in combination with chemotherapy versus chemotherapy alone for treatment of HER2-positive advanced gastric or gastroesophageal junction cancer (ToGA): a phase 3, open label, randomised controlled trial. Lancet. 2010;376:687-697
5. Hofmann M, Stoss O, Shi D. et al. Assessment of a HER2 Scoring system for gastric cancer: results from a validation study. Histopathology. 2008;52:797-805
6. Rüschoff J, Hanna W, Bilous M. et al. HER2 testing in gastric cancer: a practical approach. Mod Pathol. 2012;25:637-650
7. Van Cutsem E, Bang YJ, Feng-Yi F. et al. HER2 screening data from ToGA: targeting HER2 in gastric and gastroesophageal junction cancer. Gastric Cancer. 2015;18:476-484
8. Jørgensen JT. Role of human epidermal growth factor receptor 2 in gastric cancer: biological and pharmacological aspects. World J Gastroenterol. 2014;20:4526-4535
9. Dako Denmark A/S. HER2 IQFISH pharmDx™, Code K5731, Working Procedure 10th edition, 2015. (http://www.agilent.com/cs/library/packageinsert/public/127433001.PDF). Accessed April 6. 2017
10. Viale G, Paterson J, Bloch M. et al. Analysis of HER2 status in gastroesophageal tumor specimens using a new automated HER2 IQFISH pharmDx™ (Dako Omnis) assay. Histol Histopathol. 2016;31:1327-35
11. Matthiesen SH, Hansen CM. Fast and non-toxic in situ hybridization without blocking of repetitive sequences. PLoS One. 2012;7:e40675. doi: 10.1371/journal.pone.0040675
12. Pyo JS, Sohn JH, Kim WH. Concordance rate between HER2 immunohistochemistry and in situ hybridization in gastric carcinoma: systematic review and meta-analysis. Int J Biol Markers. 2016;31:e1-10 doi: 10.5301/jbm.5000171
13. Pala EE, Bayol U, Ozguzer A. et al. HER2 status in gastric cancer: a comparison of two novel in situ hybridization methods (IQ FISH and dual color SISH) and two immunohistochemistry methods (A0485 and HercepTest™). Pathol Res Pract. 2013;209:548-54
14. Cho EY, Srivastava A, Park K. et al. Comparison of four immunohistochemical tests and FISH for measuring HER2 expression in gastric carcinomas. Pathology. 2012;44:216-220
15. Guo W, Pylayeva Y, Pepe A. et al. Beta 4 integrin amplifies ErbB2 signaling to promote mammary tumorigenesis. Cell. 2006;126:489-502
16. Appert-Collin A, Hubert P, Crémel G, Bennasroune A. Role of ErbB Receptors in Cancer Cell Migration and Invasion. Front Pharmacol. 2015;6:283. doi: 10.3389/fphar.2015.00283
17. Musgrove E.A, Cyclins. roles in mitogenic signaling and oncogenic transformation. Growth Factors. 2006;24:13-19
18. Yun C, Gang L, Rongmin G. et al. Essential role of Her3 in two signaling transduction patterns: Her2/Her3 and MET/Her3 in proliferation of human gastric cancer. Mol Carcinog. 2015;54:1700-1709
19. Moasser MM. The oncogene HER2: its signaling and transforming functions and its role in human cancer pathogenesis. Oncogene. 2007;26:6469-6487
20. Xu Y, Benlimame N, Su J. et al. Regulation of focal adhesion turnover by ErbB signalling in invasive breast cancer cells. Br J Cancer. 2009;100:633-643
21. McGranahan N, Burrell RA, Endesfelder D. et al. Cancer chromosomal instability: therapeutic and diagnostic challenges. EMBO Rep. 2012;13:528-538
22. Ng CK, Martelotto LG, Gauthier A. et al. Intra-tumor genetic heterogeneity and alternative driver genetic alterations in breast cancers with heterogeneous HER2 gene amplification. Genome Biol. 2015;16:107. doi: 10.1186/s13059-015-0657-6
23. Van Cutsem E, Sagaert X, Topal B. et al. Gastric Cancer. Lancet. 2016;388:2654-2664
24. Jørgensen JT. Targeted HER2 Treatment in Advanced Gastric Cancer. Oncology. 2010;78:26-33
25. Fornaro L, Lucchesi M, Caparello C. et al. Anti-HER agents in gastric cancer: from bench to bedside. Nat Rev Gastroenterol Hepatol. 2011;8:369-83
26. Zhu GJ, Xu CW, Fang MY, et a. Detection of Her-2/neu expression in gastric cancer: Quantitative PCR versus immunohistochemistry. Exp Ther Med. 2014;8:1501-1507
Author contact
![]() Corresponding author: Phone: +45 4848 0528, E-mail: jan.trostdk
Corresponding author: Phone: +45 4848 0528, E-mail: jan.trostdk