Impact Factor ISSN: 1837-9664

 Global reach, higher impact
J Cancer 2017; 8(7):1301-1310. doi:10.7150/jca.17778 This issue Cite
Research Paper
Diagnostic Value of Gd-EOB-DTPA-MRI for Hepatocellular Adenoma: A Meta-Analysis
Yongfei Guo1, 2*, Wenjuan Li1*, Zhinan Xie1, Yi Zhang1, Yijie Fang1, Wenli Cai3, Guobin Hong1, 3 ![]()
1. Department of Radiology, The Fifth Affiliated Hospital of Sun Yat-sen University, Zhuhai 519000, P. R. China;
2. Department of Radiology, Zhongshan Affiliated Hospital, Guangzhou University of Chinese Medicine, Zhongshan528400, P. R. China;
3. Department of Radiology, Massachusetts General Hospital and Harvard Medical School, Boston, 02114, USA.
* These authors contributed equally to this work.
Received 2016-9-30; Accepted 2017-2-19; Published 2017-5-11
Abstract
Objective: This study aimed to systematically review the gadoxetic acid-enhanced magnetic resonance imaging (Gd-EOB-DTPA-MRI) findings of hepatocellular adenoma (HCA), especially focusing on the diagnostic value of low signal intensity (SI) in the hepatocyte-phase (HBP) for differentiating HCA from focal nodular hyperplasia (FNH).
Methods: A thorough literature search was conducted in PubMed, Excerpta Medica Database (EMBASE) and China National Knowledge Infrastructure databases (CNKI) to identify studies evaluating Gd-EOB-DTPA-MRI presentations of HCA. Published studies using pathological examinations as the gold standard were included. The pooled proportions of low SI in the HBP, arterial-phase, portal venous-phase (PVP) in HCA were calculated, as well as pooled proportions of bleeding, fatty degeneration, and central scar. Meta-analysis was used to evaluate the diagnostic value of low SI in the HBP for HCA.
Results: The search yielded 90 studies, with 8 assessing a total of 256 HCA cases included in this study, total of 229 lesions showed low signal in the HBP. Pooled proportions of low SI in the arterial-phase, PVP, and HBP were 2% (95% CI: 0.01-0.05), 39% (95% CI: 0.25-0.55), and 89% (95% CI: 0.80-0.94), respectively. Pooled proportions of bleeding, fatty degeneration, and central scar in HCA were 11% (95% CI: 0.03-0.19), 37% (95% CI: 0.27-0.49), and 10% (95% CI: 0.03-0.27), respectively. The meta-analysis revealed the following characteristics of low SI in the HBP for HCA diagnosis: 1) pooled sensitivity, 0.917 (95% CI: 0.86-0.96); 2) pooled specificity, 0.952 (95% CI: 0.91-0.98); 3) pooled positive likelihood ratio, 15.028 (95% CI: 7.10-31.82); 4) pooled negative likelihood ratio, 0.105 (95% CI: 0.07-0.17); 5) area under the ROC, 0.9802 (Q value of 0.9375), The sensitivity analysis showed that no single study was found to influence the overall pooled estimates significantly, which indicated the stability of the meta-analysis results were good.
Conclusions: Low SI on the HBP of Gd-EOB-DTPA-MRI was helpful for the diagnosis of HCA and differentiating from FNH, but it was overvalued, especially for some HCA pathological subtypes. Combining low SI in the HBP with routine MRI presentations and the risk factors of liver diseases could substantially improve its diagnosis value for HCA as well as differential diagnosis.
Keywords: Meta-Analysis, Gd-EOB-DTPA-MRI, Hepatocellular Adenoma
Introduction
Hepatocellular adenoma (HCA), also known as hepatic adenoma, is a rare benign tumor of the liver, and the third leading benign liver tumor. Its etiology and pathogenesis remain unclear. Studies showed that HCA is mainly found in young females, and associated with oral contraceptive and steroid drug use, obesity, glycogen storage disease, and iron load in thalassemia [1]. Although benign, HCA has bleeding and malignant transformation tendency [2]. The clinical symptoms of HCA are generally non-specific, and most patients are asymptomatic. However, some patients might report abdominal pain due to the large tumor oppressing the surrounding tissues, or bleeding from the ruptured tumor [3].
HCA were classified into the four major molecular subgroups, according to their genetic and phenotype characteristics: HNF1A mutated adenomas (H-HCA); inflammatory adenomas (I-HCA); unclassified adenomas (U-HCA); β-catenin activated adenomas (b-HCA). Different pathological subtype of HCA have different clinical risk factors, treatment measures and prognosis. H-HCA prognosis general is well, which do not need surgery, I-HCA has a tendency of hemorrhage and malignant transformation, b-HCA has been considered as a borderline tumor between HCA and HCC which is easy to progression of HCC, for the two behind kind of HCA pathological subtypes, surgical resection are often required [4].
Conventional imaging of HCA lacks specificity, making it very hard to differentiate from other intra hepatic diseases, especially focal nodular hyperplasia (FNH), due to similarities in age at onset and imaging presentations. Gd-EOB-DTPA is a new hepatocyte specific contrast agent that could be taken in by normal hepatocytes. Currently, it is mainly used for diagnosis and treatment efficacy evaluation of hepatocellular carcinoma, as well as differential diagnosis of intra hepatic tumors with rich blood supply. Several studies have proposed Gd-EOB-DTPA for HCA diagnosis [3, 5-11]. However, as a new contrast agent, Gd-EOB-DTPA use is so far very limited; in addition, HCA incidence is very low; therefore, only few related studies have been published, and large scale multi-center studies are still lacking. Thus, in the present study, we used a meta-analysis to investigate the presentations of HCA in MRI images enhanced by Gd-EOB-DEPA, specifically evaluate the value of low SI in the HBP for HCA diagnosis.
Materials and Methods
Search strategy
Studies published before September 1, 2016, were searched from PubMed, EMBASE, China National Knowledge Infrastructure Databases (CNKI), using the following keywords: (Hepatocellular adenoma OR HCA) AND MRI AND (Gd-EOB-DTPA OR Primovist OR Gadoxetate disodium OR Gadoxetic acid OR eovist). Only studies published in English or Chinese were considered.
Inclusion criteria
Studies were included in the current meta-analysis if: 1) published in English or Chinese; 2) having a prospective or retrospective design and performed in humans, with sample size >5; 3) MRI was employed for examination with Gd-EOB-DTPA used as contrast agent, and HBP scanning applied; 4) complete raw data were available, and the essential data could be extracted for statistical analysis; 5) the lesions were histologically confirmed HCA, or some of intra hepatic multiple lesions confirmed by pathology were HCA ,and the imaging findings of other lesions in the liver were the same; If the data in multiple publications overlapped, the study with a more complete data set was included.
Exclusion criteria
Reviews, letters, comments, and case reports were excluded; the studies reported only a kind of HCA pathological subtype; Studies were also excluded with incomplete raw data availability.
Study selection and data extraction
Two investigators reviewed the studies independently. Any disagreements on study inclusion and data extraction were resolved by discussion until a consensus was reached. All data were evaluated three times. From each study, information including the first author's name, author's country, the year of publication, number of lesions, number of HCA lesions with low SI in the arterial phase, PVP, and HBP, and number of lesions with bleeding, fatty degeneration and central scar were extracted.
Study quality assessment
The quality assessment of diagnostic accuracy studies (QUADAS) tool was used to assess the quality of the included studies and determine the possibility of bias. Study quality was assessed from three aspects, namely bias, variations, and report quality, which include 14 items. Each item was assigned “yes”, “no”, or “unclear”. Two investigators performed the assessment independently, and all disagreements were solved by discussion.
Statistical analysis
Q test and I2 test (DeSimonian and laird) were used to assess publication heterogeneity. P>0.05 indicated no significant heterogeneity, and a fixed-effects model was used for analysis. P<0.05 was considered with significant heterogeneity, and a random-effects model was used for analysis. I2 value greater than 50% was considered to indicate substantial heterogeneity. Two models were used to calculate odds ratios (OR) with 95% confidence intervals (CIs): random effects model and fixed effects model, were used according to heterogeneity indicated by P and I2 values. Meta-analysis for the rates of low SI in the arterial-phase, PVP, and HBP of HCA in Gd-EOB-DTPA-MRI images, as well as number of lesions with bleeding, fatty degeneration, and central scar was performed by using the R software. STATA 12.0 software was used to perform sensitivity analysis to assess the stability of the meta-analysis results. True positives, false positives, true negatives, and false negatives were input into the Meta-DiSc 1.4 software to calculate pooled sensitivity, specificity, positive likelihood ratio, and negative likelihood ratio. SROC curves were plotted, and areas under the SROC curves (AUC) determined.
Results
Search findings
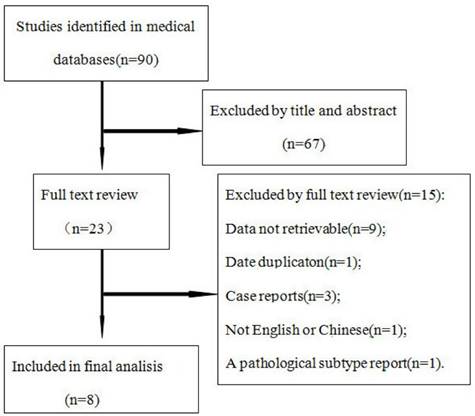
Seventy studies were obtained by the search. According to the inclusion and exclusion criteria, 8 eligible studies were finally included (Figure 1), the result is summarized in Table 1, including 1 prospective study and 7 retrospective studies, for a total of 256 HCA lesions and 209 FNH lesions.
Flow chart of articles retrieved from the search of databases and reasons for exclusion.
General characteristic of the included studies
| Author | Country | Publication Time | No. of Patient | Mean Age | No. of HCA | No. of FNH | Control Group | Pathology proved (HCA/FNH) | Pathological Type | ||
|---|---|---|---|---|---|---|---|---|---|---|---|
| Bieze M[3] | Netherlands | 2012 | 52 | 39 | 24 | 28 | HCA VS FNH | 24/28 | NO | ||
| Grazioli L[5] | Italy | 2012 | 82 | 42 | 43 | 68 | HCA VS FNH | 24/24 | YES | ||
| Purysko AS[6] | USA | 2012 | 47 | 42 | 12 | 35 | HCA VS FNH | 18/8 | NO | ||
| Mohajer K[7] | USA | 2012 | 28 | 35 | 6 | 34 | HCA VS FNH | 6/2 | NO | ||
| Grieser C[8] | Germany | 2014 | 68 | 41 | 71 | 44 | HCA VS FNH | 71/43 | YES | ||
| BA-Ssalamah A[9] | Austria | 2015 | 29 | 43 | 43 | 0 | HCA | 43/0 | YES | ||
| Thomeer[10] | Netherlands | 2014 | 7 | 38 | 8 | 0 | HCA | 8/0 | YES | ||
| Tse[11] | USA | 2016 | 21 | 39 | 49 | 0 | HCA | 49/0 | YES | ||
Study quality assessment
The QUADAS scale was used to assess the quality of all 8 studies. Among these, 5 were comparative studies assessing HCA and FNH, while 3 focused on only HCA. No studies reported the time of imaging, biopsy, or postoperative pathological examinations. HCA could progress to HCC by malignant transformation, while FNH could result from vascular disorders. As there are associations between the pathological types of lesions and disease progression, there was possible bias in these studies. Some of HCA and FNH lesions were confirmed by imaging. However, imaging was not the gold standard for differentiating HCA from FNH, suggesting a possible reference bias or multi-reference bias in some studies.
Heterogeneity test
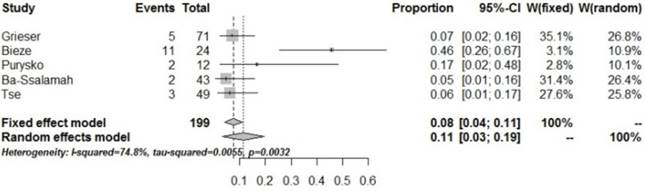
Pooled proportions of low SI indicates no significant heterogeneity in the arterial phase (P=0.8960, I2=0). However, significant heterogeneity was found in pooled proportions of low SI in the PVP and HBP (P=0.0003, I2=78.3%; P=0.0487, I2=50.5%), which could be associated with the different scanning time in the PVP; in addition, the distribution of HCA pathological types was also uneven, which could also induce heterogeneity in pooled proportions of low SI in the HBP. Significant heterogeneity in pooled proportions of central scar, fatty degeneration and bleeding were also found (P<0.0002, I2=79.5%; P=0.0162, I2=64.0%; P=0.0032, I2=74.8%); the main causes could be the differences in central scar, fatty degeneration and bleeding identification rates using distinct sequences. Identifying central scar and irregular old bleeding could be easily affected by the observers' subjective judgment, bleeding and fat discovery rate are significantly different when use different MRI scanning sequences. No significant heterogeneity in the pooled accuracy of low SI in the HBP for diagnosing HCA and FNH was found (P=0.7754, I2=0); however, a significant publication bias was found (P=0.04049). The pooled proportion was 191.02% (95% CI: 73.17%-98.73%) after adjustment of publication bias, which was similar to results before adjustment (Table 3).
Meta-analysis of HCA versus FNH of hepatobiliary phase. Showing no significant heterogeneity (P>0.05), publication bias was found (P<0.05).
| No. of Studies | No. of HCA | No. of FNH | Summary Estimate | P value† for Reporting Bias | Trim-and-Fill Estimate | |||
|---|---|---|---|---|---|---|---|---|
| Summary OR (95% CI) | P value* for Heterogeneity | I2 %§ | No. of Added studies | Adjusted Pooled Proportion (95 % CI) | ||||
| 5 | 156 | 209 | 250.56 [87.25,719.60] | 0.7754 | 0% | 0.04049 | 2 | 191.02 [73.17,498.73] |
*P value use the Cochran-Q method to test the heterogeneity of the pooled data. Values <0.05 indicate substantial heterogeneity.
§I2 is the Higgin′s index for heterogeneity and values greater than 50 % indicate substantial.
† P values are to test publication reporting bias using the Egger′s test.
P values less than 0.05 indicate significant bias heterogeneity.
Meta-analysis
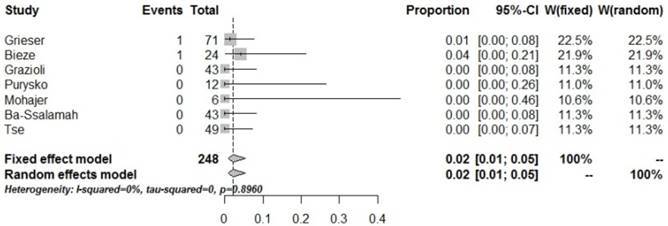
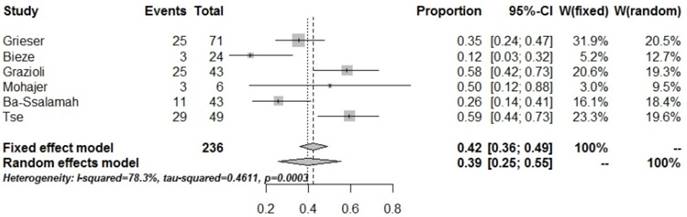
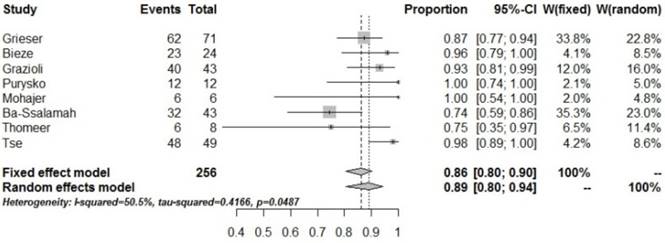
The pooled proportion of imaging presentations of HCA and FNH at Gd-EOB-DTPA-MRI are shown in Table 2. Pooled proportions of low SI HCA at Gd-EOB-DTPA-MRI in the arterial phase, PVP, and HBP were 2% (95% CI: 0.01-0.05), 39% (95% CI: 0.25-0.55), and 89% (95% CI: 0.80-0.94), respectively. These results indicate that most HCAs show marked enhancement in the arterial phase, start to wash out in the PVP, when entering the HBP the lesions characterized by low signal. Relative to the HCA, the pooled proportions of low SI FNH at Gd-EOB-DTPA-MRI in the arterial phase, PVP, and HBP were 0% (95% CI: 0.00-0.01), 1% (95% CI: 0.01-0.03), and 3% (95% CI: 0.03-0.07), respectively. These dates indicate that most FNH lesions show persistent enhancement from the arterial phase through HBP. Pooled proportions of bleeding, fatty degeneration, and central scar in the lesions were 11% (95% CI: 0.03-0.19), 37% (95% CI: 0.27-0.49), and 10% (95% CI: 0.03-0.27) respectively. Figure 2-7 were forest plots of the meta-analysis. Statistical analysis showed that HCA mainly showed iso- or high signals in the arterial phase and PVP in Gd-EOB-DTPA-MRI (2%, 95% CI: 0.01-0.05; 39%, 95% CI: 0.25-0.55); however in the HBP, HCA mainly showed clearance of the contrast agent and low SI in the HBP (89%, 95% CI: 0.80-0.94). Indeed, low SI in the HBP had high accuracy in diagnosing HCA, in all of 256 HCA lesions, 229 lesions showed low SI in the HBP, the pool sensitivity and specificity were 0.917 (95% CI: 0.86-0.96) and 0.952 (95% CI: 0.91-0.98), respectively. The possibilities of bleeding (11%) and fatty degeneration (37%) in HCA were low, while the possibility of central scar (10%) in HCA was extremely low.
Summary of the Meta-analysis pooled proportions of the imaging findings. Fix-effects model (I2>50%) or Random-effects model (I2<50%) were used to analysis these pooled proportions.
| Imaging Findings | No. of Studies | No. of Cases | No. of Positive Cases | Summary Estimate | ||
|---|---|---|---|---|---|---|
| Pooled Proportion(95 % CI) | P value for Heterogeneity* | I2 %§ | ||||
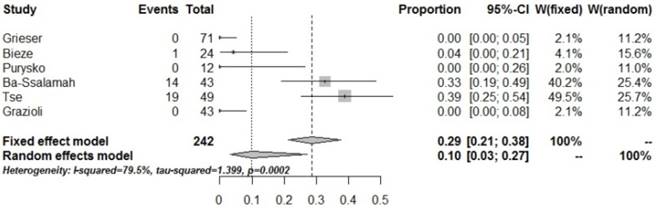
| scar | 6 | 242 | 34 | 0.10 [0.03, 0.27] | 0.0002 | 79.5% |
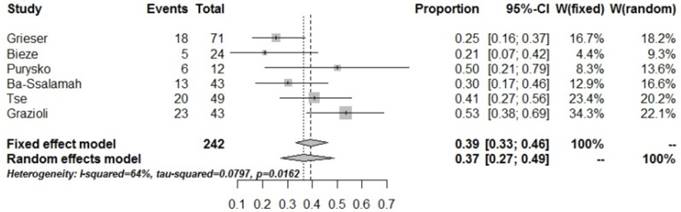
| fat | 6 | 242 | 85 | 0.37 [0.27, 0.49] | 0.0162 | 64.0% |
| blood | 5 | 199 | 23 | 0.11 [0.03, 0.19] | 0.0032 | 74.8% |
| HCA arterial phase_hypo | 7 | 248 | 2 | 0.02 [0.01, 0.05] | 0.8960 | 0.00% |
| PVP_hypo | 6 | 236 | 96 | 0.39 [0.25,0.55] | 0.0003 | 78.3% |
| HBP_hypo | 8 | 256 | 229 | 0.89 [0.80,0.94] | 0.0487 | 50.5% |
| FNH arterial phase_hypo | 4 | 174 | 0 | 0.00 [0.00,0.01] | 0.9905 | 0% |
| PVP_hypo | 4 | 174 | 2 | 0.01 [0.00,0.03] | 0.6703 | 0% |
| HBP_hypo | 5 | 209 | 10 | 0.03 [0.01,0.07] | 0.0427 | 59.5% |
* P value use the Cochran-Q method to test the heterogeneity of the pooled data. Values <0.05 indicate substantial heterogeneity.
§I2 is the Higgin′s index for heterogeneity and values greater than 50 % indicate substantial heterogeneity.
Forrest plots to show the pooled proportions of hypo-SI of HCA on the arterial phase. For each study, the proportion of hypo-SI and its corresponding 95% CI were plotted with grey box and a horizontal line, with box size reflecting the study-specific weight. The symbol filed diamond indicates pooled proportions and its corresponding 95% CI.
Forrest plots to show the pooled proportions of hypo-SI of HCA on the PVP. For each study, the proportion of hypo-SI and its corresponding 95% CI were plotted with grey box and a horizontal line, with box size reflecting the study-specific weight. The symbol filed diamond indicates pooled proportions and its corresponding 95% CI.
Forrest plots to show the pooled proportions of hypo-SI of HCA on the HBP. For each study, the proportion of hypo-SI and its corresponding 95% CI were plotted with grey box and a horizontal line, with box size reflecting the study-specific weight. The symbol filed diamond indicates pooled proportions and its corresponding 95% CI.
Forrest plots to show the pooled proportions of presence of blood. For each study, the proportion of hypo-SI and its corresponding 95% CI were plotted with grey box and a horizontal line, with box size reflecting the study-specific weight. The symbol filed diamond indicates pooled proportions and its corresponding 95% CI.
Forrest plots to show the pooled proportions of presence of fat. For each study, the proportion of hypo-SI and its corresponding 95% CI were plotted with grey box and a horizontal line, with box size reflecting the study-specific weight. The symbol filed diamond indicates pooled proportions and its corresponding 95% CI.
Forrest plots to show the pooled proportions of presence of central scar. For each study, the proportion of hypo-SI and its corresponding 95% CI were plotted with grey box and a horizontal line, with box size reflecting the study-specific weight. The symbol filed diamond indicates pooled proportions and its corresponding 95% CI.
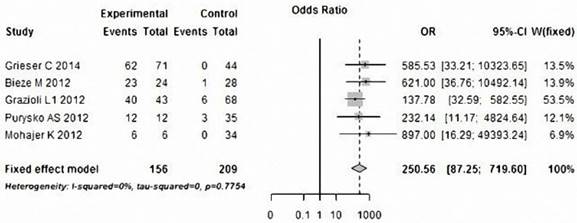
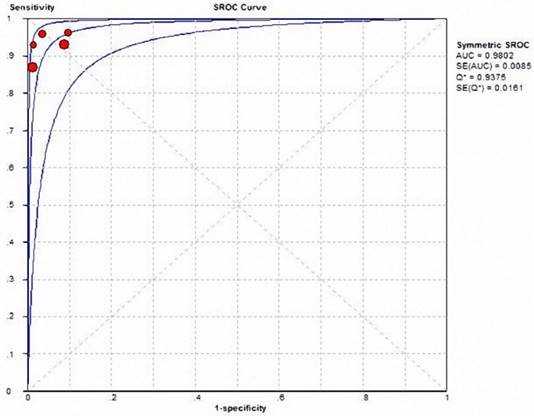
Five of the studies analyzed the accuracy of HBP in diagnosing HCA and FNH in 156 HCA and 209 FNH lesions, respectively. Table 3 and Figure 8 show heterogeneity data and forest plot. The pooled specificity was 0.952 (95% CI: 0.91-0.98), for a pooled sensitivity of 0.917 (95% CI: 0.86-0.96); pooled positive and negative likelihood ratios were15.028 (95% CI: 7.10-31.82) and 0.105 (95% CI: 0.07-0.17), respectively (Table 4), both of them indicate the very high discriminatory capability of positive and negative. The area under the SROC curve was 0.9802, for a Q value of 0.9375 (Figure 9). All of these showed the HBP signal characteristic can play an important role in the differential diagnosis of HCA and FNH.
Forest plot of the odds ratios (ORs) with 95% CIs, differentiate HCA from FNH with low SI on the HBP of Gd-EOB-DTPA-MRI. For each study, the proportion of hypo-SI and its corresponding 95% CI were plotted with grey box and a horizontal line, with box size reflecting the study-specific weight. The symbol filed diamond indicates pooled proportions and its corresponding 95% CI.
Forest plot of diagnostic accuracy of HCA was calculated by using low SI on the HBP phase of Gd-EOB-DTPA-MRI.
| REFERENCE | N | TP | TN | FP | FN | Sen | Spe | LR+ | LR- |
|---|---|---|---|---|---|---|---|---|---|
| Bieze M | 52 | 23 | 27 | 1 | 1 | 0.958 | 0.964 | 26.833 | 0.043 |
| Grazioli L | 111 | 40 | 62 | 6 | 3 | 0.930 | 0.912 | 10.543 | 0.077 |
| Mohazjer K | 40 | 6 | 34 | 0 | 0 | 1.000 | 1.000 | 65.000 | 0.072 |
| Purysko AS | 47 | 12 | 32 | 3 | 0 | 1.000 | 0.914 | 9.890 | 0.043 |
| Grieser C | 115 | 62 | 44 | 0 | 9 | 0.873 | 1.000 | 78.125 | 0.133 |
| POOLED RESULT | 0.917 | 0.952 | 15.028 | 0.105 | |||||
| 95% CI | (0.862-0.955) | (0.914-0.977) | (7.097-31.819) | (0.065-0.171) | |||||
| P* | 0.246 | 0.031 | 0.240 | 0.586 | |||||
| I2 %§ | 26.4% | 62.3% | 27.3% | 0.0% |
*P value use the Cochran-Q method to test the heterogeneity of the pooled data. Values <0.05 indicate substantial heterogeneity. §I2 is the Higgin′s index for heterogeneity and values greater than 50 % indicate substantial heterogeneity.
Abbreviations: N: number; TP: true positive; TN: true negative; FP: false positive; FN: false negative; Sen: sensitivity; Spe: specificity; LR+: positive likelihood ratio; LR-: negative likelihood ratio.
Summary ROC curve of Gd-EOB-DTPA-MRI showed to differentiate HCA from FNH. The middle line is the summary ROC curve and two besides are 95% confidence intervals. Each red dot represents an individual study in the meta-analysis, with the size of the red dot proportional to the sample size of the study.
Sensitivity analysis
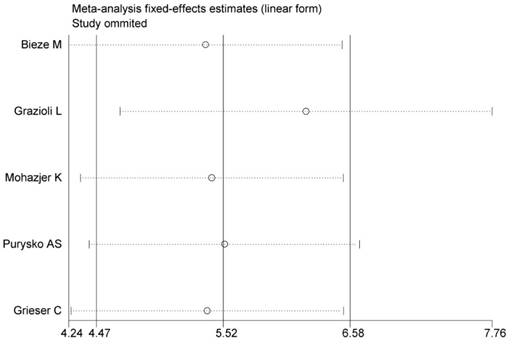
The sensitivity analyses of HCA comparison with FNH with low SI on the HBP of Gd-EOB-DTPA-MRI were performed by removing one study at a time to assess the influence of each included study on the overall pooled estimates.
As shown in Figure 10, no single study was found to influence the overall pooled estimates significantly, which indicated that our overall result was statistically stable (Figure 10).
Sensitivity analyses for low SI of HBP to differentiate HCA from FNH. The vertical axis indicates the overall OR and two vertical axes indicate its 95% CI. Every round indicates the pooled OR when the left study is omitted in this meta-analysis. Two ends of every broken line represent the respective 95% CI.
Discussion
Meta-analysis is a systemic review that pools and quantitatively analyzes the data of previous studies to obtain comprehensive and reliable results, similar to a re-evaluation of multi-center studies. The advantages of meta-analysis include increasing sample size, thus improving data reliability and solving inconsistency among individual studies.
HCA lacks specific presentations in routine imaging, and thus is very hard to differentiate from other intra hepatic diseases, especially FNH. The age at onset in HCA is similar to that in FNH, and both diseases are mainly found in women of child-bearing age. Both HCA and FNH patients are generally without a history of hepatitis or clinical symptoms and AFP-negative, and imaging presentations are non-specific [12].
Gd-EOB-DTPA is a hepatocyte specific contrast agent; however, it has not been applied in multiple clinical practices; in addition, HCA incidence is very low, and only few studies reported using Gd-EOB-DTPA in diagnosing HCA, with large-scale multi-center studies still lacking. Studies reported that low SI in the HBP in Gd-EOB-DTPA-MRI has higher sensitivity and specificity in diagnosing HCA than other parameters; however, the incidence of low SI in the HBP and HCA diagnostic accuracy varies greatly among previous studies [3, 5-11, 13]; thus a meta-analysis is required.
The present study showed that pooled proportions of low SI in the HBP for HCA was 89% (95% CI: 0.80-0.94), for a pooled sensitivity of 0.917 (95% CI: 0.86-0.96) and pooled specificity of 0.952 (95% CI: 0.91-0.98). These findings suggested that most HCA show low SI in the HBP, which has very high sensitivity and specificity for HCA diagnosis. The pooled positive likelihood ratio was 15.028 (95% CI: 7.10-31.82) and a pooled negative likelihood ratio of 0.105 (95% CI: 0.07-0.17) was obtained, also suggesting that low SI in the HBP has great diagnostic value for HCA. However, heterogeneity was found in the pooled specificity (P=0.0487, I2=50.5%), and could be associated with the heterogeneous distribution of the pathological HCA subtypes.
Low SI in the HBP in Gd-EOB-DTPA-MRI is rather specific, especially when HCA could not be differentiated from FNH by routine imaging. The presentations in the HBP in Gd-EOB-DTPA-MRI will greatly increase clinician confidence during diagnosis, with substantially improved HCA diagnosis accuracy. A small proportion of HCA showed iso- or high signals in the HBP, and it is hard to differentiate from FNH just according to imaging presentations in the HBP. Therefore, HCA presentations in routine imaging and the risk factors should also be considered for a comprehensive analysis to improve diagnosis accuracy.
Multiple studies have demonstrated a substantial difference in percentages of different pathological subtypes of HCA, and the proportion of low SI in the HBP is also overtly different among various subtypes; therefore, the accuracy of diagnosing HCA with low SI in the HBP by Gd-EOB-DTPA-MRI varies greatly among studies [3, 5-11]; this could be associated with differences in lifestyle, diet, and exposure to risk factors of HCA, which induce different pathological HCA subtypes.
The reasons for atypical HCA showing iso- or high signals could be as follows. First, it could be related to OATP1B1/3 and MRP3 expression. OATP1B1/3 could affect Gd-EOB-DTPA uptake by HCA cells, while MRP3 affects its excretion from the same cells; therefore, OATP1B1/3 and MRP3 levels, which vary substantially in different HCA subtypes, could directly affect the intensity of HBP signals [9].Second, fatty degeneration of the liver could also affect the relative intensity of HCA signals in the HBP[5]. Finally, chronic inflammation could reduce bile duct reactivity [14]. The low SI of heterogeneous signals of atypical FNH in the HBP could be associated with different expression levels of OATP8 in FNH cells, huge scars in the lesion, and fat contents [3,5-6,8,15].
In the present study, the pooled proportion of low SI in the arterial phase in HCA was 1% (95% CI: 0-0.02), suggesting that HCA is rich in blood supply; low SI in the arterial phase in the enhancement was hardly obtained. Although the center of HCA lacks a blood-supplying artery, the peripheral parts of the tumor are generally supplied by the large nourishing blood vessels from the hepatic artery [16-17]. The pooled proportion of low SI in the PVP for HCA was 39% (95% CI: 0.25-0.55), suggesting that a few HCA lesions show low SI in the PVP, while most of them display high signals. These findings indicate that enhancement of HCA in the PVP is heterogeneous, with specific features.
Fatty degeneration is an imaging presentation that could help diagnosing HCA with CT or MRI. The present study showed that a pooled proportion of fatty degeneration in HCA of 37% (95% CI: 0.27-0.49).The MRI sign is only found in the H-HCA pathological subtype [10]. Grazioli L and Purysko AS et al [5-6] reported that fatty tissues are also found in FNH, and could not actually differentiate HCA from FNH just according to the presence of fatty tissues in the tumor [18-19]. In addition, other intra hepatic diseases presenting fatty tissues, such as HCC and hepatic angiomyolipoma (HAML), should also be differentiated from HCA. HCC patients generally show increased incidence of hepatitis, history of cirrhosis, and AFP levels, which could help differentiate HCA from HCC. HAML seldom presents cystic changes and necrosis, and fatty contents and the shadows of large blood vessels in the lesions highly suggest HAML [20].
HCA has a bleeding tendency. Some HCA could rupture spontaneously, and the subsequent bleeding may be life threatening. The pooled proportion of bleeding in HCA was 11% (95% CI: 0.03-0.19) in the present study, less than the data (15%-20%) reported by van Aalten SM et al [21]. Bleeding mainly occurs in HCA with lesion size above 5 cm, but also in a few HCA cases with lesions<5 cm [22-23]. Since bleeding in FNH is extremely rare, bleeding in lesions found in imaging examinations is very important for the differential diagnosis between FNH and HCA with lesion size > 5 cm.
The pooled proportion of scar in HCA was 10% (95% CI: 0.03-0.27) in the present study, suggesting a very low incidence of scar in HCA. However, about 50% of FNH cases have scars, mainly in FNH lesions exceeding 3 cm, while only few FNH lesions <3 cm have a central scar [24-25]. In addition, such scars are very difficult to identify by imaging examinations [26-28]. For lesions >3 cm, the central scar could provide some evidence for the differential diagnosis between HCA and FNH, however, in some pathological subtypes of HCA, especially H-HCA, the incidence of scar sign in the lesion may reach 30% [9,11-12].
Different from conventional meta-analysis, the present study focused more on analyzing pooled proportions of presentations in MRI images of HCA, which allowed us to better understand presentations in MRI images for HCA diagnosis.
This study has some limitations: 1) the sample size was not large enough. Especially for the classification of different pathological subtypes, the sample size was relatively small. Further studies with higher quality and larger sample sizes are needed; 2) we include some conventional MRI signs, but part of the studies did not clarify what the MRI scanning sequences they used, these factors might affect the detection rate of some imaging signs. It is not each included study contains MRI signs we assess; 3) this study only evaluated and analyzed the diagnostic value of low SI in the HBP for HCA and FNH diagnoses. More studies are needed to assess its use in diagnosing other liver diseases, including HCC, HAML, hemangioma and hypervascular metastasis; 4) publication bias was identified while evaluating the diagnostic value of low SI in the HBP for HCA and FNH, which could affect the validity of our results.
In conclusion, low SI in the HBP in Gd-EOB-DTPA-MRI has high sensitivity and specificity for the diagnosis of HCA. Moreover, combining low SI in the HBP with routine MRI presentations and the risk factors of liver diseases could substantially improve its diagnosis value for HCA as well as differential diagnosis.
Abbreviations
Gd-EOB-DTPA-MRI: gadoxetic acid-enhanced magnetic resonance imaging
HCA: hepatocellular adenoma
SI: signal intensity
HBP: hepatocyte-phase
FNH: focal nodular hyperplasia
EMBASE: ExcerptaMedica Database
CNKI: China National Knowledge Infrastructure databases
PVP: portal venous-phase
95% CI: 95% confidence interval
ROC: receiver operating characteristic curve
Hypo: hypo intensity
OR: odds ratio
Acknowledgements
This work was partly supported by the National Natural Science Foundation of China (81271561) and the Natural Science Foundation of Guangdong Province, China (2015A030313173). The authors would like to thank editor and anonymous referees for their valuable and informative comments.
Competing Interests
The authors have declared that no competing interest exists.
References
1. Bioulac-Sage P, Laumonier H, Couchy G. et al. Hepatocellular adenoma management and phenotypic classification: the Bordeaux experience. Hepatology. 2009;50:481-9
2. Rooks JB, Ory HW, Ishak KG. et al. Epidemiology of hepatocellular adenoma. The role of oral contraceptive use.JAMA. 1979;242:644-8
3. Bieze M, van den Esschert JW, Nio CY. et al. Diagnostic accuracy of MRI in differentiating hepatocellular adenoma from focal nodular hyperplasia: prospective study of the additional value of gadoxetate disodium. AJR Am J Roentgenol. 2012;199:26-34
4. Blanc JF, Frulio N, Chiche L. et al. Hepatocellular adenoma management: Call for shared guidelines and multidisciplinary approach. Clin Res Hepatol Gastroenterol. 2015;39:180-7
5. Grazioli L, Bondioni MP, Haradome H. et al. Hepatocellular adenoma and focal nodular hyperplasia: value of gadoxetic acid-enhanced MR imaging in differential diagnosis. Radiology. 2012;262:520-9
6. Purysko AS, Remer EM, Coppa CP. et al. characteristics and distinguishing features of hepatocellular adenoma and focal nodular hyperplasia on gadoxetate disodium-enhanced MRI. AJR Am J Roentgenol. 2012;198:115-23
7. Mohajer K, Frydrychowicz A, Robbins JB. et al. Characterization of hepatic adenoma and focal nodular hyperplasia with gadoxetic acid. J Magn Reson.Imaging. 2012;36:686-96
8. Gsieser C, Steffen IG, Kramme IB. et al. Gadoxetic acid enhanced MRI for differentiation of FNH and HCA: a single centreexperience. EurRadiol. 2014;24:1339-48
9. Ba-Ssalamah A, Antunes C, Feier D. et al. Morphologic and Molecular Features of Hepatocellular Adenoma with Gadoxetic Acid-enhanced MR Imaging. Radiology. 2015;277:104-13
10. Thomeer MG, E Bröker ME, de Lussanet Q. et al. Genotype-phenotype correlations in hepatocellular adenoma: an update of MRI findings. Diagn Interv Radiol. 2014;20:193-99
11. Tse JR, Naini BV, Lu DS. et al. Qualitative and Quantitative Gadoxetic Acid-enhanced MRI Imaging Helps Subtype Hepatocellular Adenomas. Radiology. 2016;279:118-27
12. Bioulac-Sage P, Balabaud C, Wanless IR. Diagnosis of focal nodular hyperplasia: not so easy. Am J Surg Pathol. 2001;25:1322-25
13. Agarwal S, Fuentes-Orrego JM, Arnason T. et al. Inflammatory hepatocellular adenomas can mimic nodular hyperplasia on gadoxetic acid-enhangced MRI. AJR Am J Roentgenol. 2014;203:408-14
14. Rebouissou S, Bioulac-Sage P, Zucman-Rossi J. Molecular pathogenesis of focal nodular hyperplasia and hepatocellular adenoma. J Hepatol. 2008;48:163-70
15. Shanbhogue A, Shah SN, Zaheer A. et al. Hepatocellular adenomas: current update on genetics, taxonomy, and management. J Comput Assist Tomogr. 2011;35:159-66
16. Kong WT, Wang WP, Huang BJ. et al. Contrast-enhanced ultrasound in combination with color Doppler ultrasound can improve the diagnostic performance of focal nodular hyperplasia and hepatocellular adenoma. Ultrasound Med Biol. 2015;41:944-51
17. Manichon AF, Bancel B, Duriesx-Millon M. et al. Hepatocellular adenoma: evaluation with contrast-enhanced ultrasound and MRI and correlation with pathologic and phenotypic classification in 26 lesions. HPB Surg. 2012;2012:418745
18. Stanley G, Jeffrey Jr RB, Feliz B. CT findings and mistopathology of intratumoral steatosis in focal nodular hyperplasia: case report and review of the literature. J Comput Assist Tomogr. 2002;26:815817
19. Mortelé KJ, Stubbe J, Praet M. et al. Intratumoral steatosis in focal nodular hyperplasia coinciding with diffuse hepatic steatosis: CT and MRI findings with histologic correlation. Abdom Imaging. 2000;25:179-81
20. Cai PQ, Wu YP, Xie CM. et al. Hepatic angiomyolipoma: CT and MRI imaging findings with clinical-pathologic comparison. Abdom Imaging. 2013Jun;38(3):482-9
21. Van Aalten SM, de Man RA, IJzermans JN. et al. Systematic review of haemorrhage and rupture of hepatocellular adenomas. Br J Surg. 2012;99:911-6
22. Deneve JL, Pawlik TM, Cunningham S. et al. Liver cell adenoma: a multicenter analysis of risk factors for rupture and malignancy. AnnSurg Oncol. 2009;16:640-8
23. Dokmak S, Paradis V, Vilgrain V. et al. A Single-Center Surgical Experience of 122 Patients with Single and Multiple Hepatocellular Adenomas. Gastroen terology. 2009;137:1698-705
24. Grazioli L, Morana G, Kirchin MA. et al. Accurate differentitiation of focal nodular hyperplasis from hepatic adenoma at gadobenatedimeglumine-enhanced MR imaging: prospective study. Radiology. 2005;236:166-77
25. Van Aalten SM, Thomeer MG, Terkivatan T. et al. Hepatocellular Adenomas: Correlation of MR Imaging Findings with Pathologic Subtype Classification. Radiology. 2011;261:172-81
26. Mathieu D, Vilgrain V, Mahfouz AE. et al. Benign liver tumors. Magn Reson Imaging Clin N Am. 1997;5:255-88
27. Shirkhoda A, Farah MC, Bernacki E. et al. Hepatic focal nodular hyperplasia: CT and sonographic spectrum. Abdom Imaging. 1994;19:34-8
28. Shamsi K, De Schepper A, Degryse H. et al. Focal nodular hyperplasia of the liver: radiologic findings. Abdom Imaging. 1993;18:32-8
Author contact
![]() Corresponding author: Guobin Hong, Department of Radiology, the Fifth Affiliated Hospital, Sun Yat-sen University, Zhuhai 519000, China. Phone: +86 756 2528666; Email: honggbsysu.edu.cn
Corresponding author: Guobin Hong, Department of Radiology, the Fifth Affiliated Hospital, Sun Yat-sen University, Zhuhai 519000, China. Phone: +86 756 2528666; Email: honggbsysu.edu.cn