Impact Factor ISSN: 1837-9664

 Global reach, higher impact
J Cancer 2017; 8(7):1187-1196. doi:10.7150/jca.18171 This issue Cite
Research Paper
Chemoresistance of colorectal cancer to 5-fluorouracil is associated with silencing of the BNIP3 gene through aberrant methylation
Jianming He1, 2*, Li Pei 1*, Heng Jiang1, Weiwen Yang1, Jianfang Chen1, Houjie Liang1 ![]()
1. Department Of Oncology And Southwest Cancer Center, Southwest Hospital, Third Military Medical University, Chongqing, 400038 China;
2. Department Of Oncology, Hebei Provincial Hospital of Traditional Chinese Medicine, Shijiazhuang 050011, China.
* These authors contributed equally to this manuscript.
Received 2016-11-1; Accepted 2017-1-12; Published 2017-4-9
Abstract
Purpose To investigate the correlation between chemoresistance of colorectal cancer to 5-fluorouracil and BNIP3 and the underlying mechanism.
Methods BNIP3 protein in specimens was evaluated using immunohistochemistry. Semi-quantitative reverse transcription PCR and Western blot was employed to assay gene expression. The promoter methylation status of BNIP3 was examined by methylation-specific PCR. Drug sensitivity was assayed using MTT assay.
Results Specimens from 81 patients with colorectal cancer receiving 5-fluorouracil-based chemotherapy were analyzed. BNIP3 expression was negative in 42 cancer samples. The mean score of BNIP3 in cancer was 1.8±0.2 and it was 3.7±0.5 in adjacent colorectum (p<0.05). The response rate of the BNIP3 positive group was 63.6% and that of the negative group was 36.4% (p=0.021). The median PFS of the BNIP3 positive group was 9.25 months and that of the BNIP3 negative group was 6.5 months (p=0.011). BNIP3 mRNA was not detectable in 4 of 8 colorectal cell lines and all these 4 cell lines displayed BNIP3 methylated allele only. Other 4 cell lines what expressed detectable BNIP3 displayed BNIP3 unmethylated allele only or both unmethylated and methylated alleles. 5-Aza dramatically increased BNIP3 expression. Knockdown of DNMT1 increased BNIP3. Knockdown of DNMT3B alone did not detectably change BNIP3 expression while knockdown of both DNMT1 and DNMT3B increased BNIP3 expression more than knockdown of DNMT1 alone. Knockdown of BNIP3 decreased chemosensitivity to 5-fluorouracil and increasing BNIP3 through demethylation increased chemosensitivity.
Conclusion Chemoresistance of colorectal cancer to 5-fluorouracil is associated with silencing of the BNIP3 gene through aberrant methylation via DNMT1/DNMT3B.
Keywords: 5-fluorouracil, BNIP3, methylation, colorectal cancer.
Introduction
Colorectal cancer is the third most commonly diagnosed cancer in males and the second most in females worldwide, with an estimated 1.4 million cases occurring in 2012 [1]. The highest incidence rates are mainly in developed countries and the incidence is increasing in developing countries [1]. This may partly reflect the strong association between colorectal cancer and high serum cholesterol/triglyceride [1-3]. The majority of patients with colorectal cancer were at advanced stage at diagnosis and chemotherapy should be used in these patients [4-7]. Despite an enormous amount of effort spent in the development of chemotherapies for colorectal cancer, these are effective only in a small proportion of patients. To a large extent, this discouraging fact is largely due to the ability of a malignant tumor to demonstrate resistance to chemotherapies new and old [1, 4-5, 7].
Over the last five decades, 5-fluorouracil (5-Fu) remains one of the most effective and most commonly used drugs to treat colorectal cancer [5-7]. However, intrinsic and acquired resistance remains a major setback to 5-Fu clinical efficacy. Up to 40% of patients receiving 5-Fu-based adjuvant chemotherapy following potentially curative resection of stage Ⅱ and Ⅲ colon cancer experience recurrence or die within 8 years of follow-up [5]. As high as 50% of metastatic colorectal cancer patients are resistant to 5-Fu-based chemotherapy [6-7]. Response rates to current 5-Fu combination therapies may be only about 50% [8]. Therefore, a deeper understanding of the mechanism of 5-Fu resistance is important for the customization of strategies being tailored to the individual patient.
In the present study, the role of BNIP3 in resistance of colorectal cancer to 5-Fu was explored. Silencing of the BNIP3 gene significantly negatively correlated with chemotherapy response/ progression-free survival (PFS) to 5-Fu-based chemotherapy. Aberrant methylation via DNMT1 and DNMT3B was involved in the mechanism of resistance to 5-Fu caused by silencing of the BNIP3 gene.
Materials and Methods
Patients and cancer samples
The archival colorectal adenocarcinoma samples were derived from 81 patients undergoing surgical excision and diagnosed at the Department of Pathology, Southwest Hospital, Third Military Medical University, between July, 2002 and December, 2006. Patients were eligible for study entry if they had: 1) receiving L-OHP+CF+5-Fu chemotherapy (3-weekly chemotherapy comprising oxaliplatin (130 mg/m2, d1), leucovorin (200 mg/m2, d1~5) and 5-Fu (300 mg/m2, d1~5)), 2) ≥1 measurable lesion at the time starting L-OHP+CF+5-Fu chemotherapy, 3) completion of previous chemotherapy >6 months or radiotherapy >3 months prior to L-OHP+CF+5-Fu chemotherapy, 4) evaluation of lesions using computed tomography (CT) or magnetic resonance imaging (MRI) every 2 cycles of L-OHP+CF+5-Fu chemotherapy or every 6 weeks until progression. The objective tumor response was evaluated using image of CT or MRI according to RECIST (Response Evaluation Criteria in Solid Tumors) as previously described [9]. Each patient was assigned one of the following categories: 1) complete response (CR), 2) partial response (PR), 3) stable disease (SD), 4) progressive disease (PD). Objective response rate is the rate of CR and PR.
All available hematoxylin and eosin (H&E) stained slides were reclassified by a pathologist without knowledge of patient's data. Tumor differentiation was graded as follows: well, moderate, or poor.
Informed consent was obtained from all patient involved in this study. This study was approved by the Ethics Committee of Southwest Hospital, the Third Military Medical University and was carried out in accordance with the associated guidelines.
Immunohistochemical staining of BNIP3
BNIP3 immunohistochemistry of human samples was performed as previously described [10]. In brief, 10% neutral formalin-fixed, paraffin-embedded tissues were cut into 5 to 6 μm thickness sections. Immunohistochemistry was done according to the manual of SP-9000-D kits (Streptavidin-Biotin) (Beijing Zhongshan Jinqiao biotechnology Co., Ltd., China) [10]. BNIP3 primary antibody was from Sigma-Aldrich (St Louis, MO, USA).
Immunostained sections were analyzed independently by a pathologist without prior knowledge of clinicopathological data. Expression of BNIP3 was evaluated as previously described, based on the percentage and intensity of positively-stained cells [10]. The percentage of positively-stained cells was scored as: 0, negative; 1, positive in ≤ 10%; 2, positive in 11~50%; 3, positive in 51~80%; 4, positive in > 80% of cells. Staining intensity was scored as 0=negative, 1=weak, 2=moderate, and 3=strong. The score of one slide=the score of intensity × the score of the percentage。The slide with score of BNIP3 less than 2 was considered as negative. The slide with higher score was considered as positive.
Cell lines and cell culture
Human colon cancer cell lines, SW480, SW620, RKO, HCT116, LS174T, HCT15, LoVo and HT29 were obtained from the Cell Bank, Chinese Academy of Science. Cells were routinely grown and passaged as previously described [11]. In brief, cells were grown in F12K (Gibco, Grand Island, NY, USA) (LoVo), McCoy's 5A (Gibco) (HCT116 and HT29), Leibovitz's L-15 (Gibco) (SW480 and SW620), or RPMI-1640 (Gibco) (RKO, LS174T and HCT15) supplemented with 100 ml/L fetal bovine serum (FBS) (Gibco), 100,000 IU/L penicillin, and 100 mg/L streptomycin (Gibco) under a humidified atmosphere of 5% CO2 at 37 ℃.
For hypoxia exposure, cells were cultured for 24 hours in a modulator incubator chamber at 37 ℃ with 1% O2, 5% CO2, and 94% N2 as previously described [12].
For 5-Aza (Sigma-Aldrich) exposure, cells were cultured with 5-Aza in the media as indicated [13].
Semi-quantitative reverse transcription polymerase chain reaction (RT-PCR)
RT-PCR was performed as previously described [10]. Total RNA of cells was extracted with Trizol reagent (Invitrogen, Carlsbad, CA, USA), and first-strand cDNA was synthesized using 2μg of total RNA. Then 1μL cDNA was employed as a template for the PCR reaction. Each gene was amplified by PCR using the following cycle: preliminary denaturation at 95 ℃ for 5 min, followed by cycles of denaturation at 94 ℃ for 30 s, annealing for 45 s, and elongation at 72 ℃ for 30 s, followed by a final elongation step at 72 ℃ for 10 min. The annealing temperatures for β-actin, BNIP3, DNMT1 and DNMT3B were 61℃, 61℃, 57℃ and 59℃, respectively. The cycles of PCR amplication for β-actin, BNIP3, DNMT1 and DNMT3B were 26, 30, 30 and 30, respectively. The PCR products were subjected to agarose gel electrophoresis with ethidium bromide. The primers used for RT-PCR are listed in Table 1. β-actin was used as an internal standard.
Primers for RT-PCR
| Sequences of primers | ||
|---|---|---|
| β-actin | Forward | GTGGGGCGCCCCAGGCACCA |
| Reverse | CTTCCTTAATGTCACGCACGATTTC | |
| BNIP3 | Forward | GGTCAAGTCGGCCGGAAAATAT |
| Reverse | CGCCTTCCAATATAGATCCCCAA | |
| DNMT1 | Forward | GCCGGGTCCTCTACTACTCA |
| Reverse | CTTCCGTGGGCGTTTC | |
| DNMT3B | Forward | CGGTTCCTGGAGTGTAATC |
| Reverse | GTTCGACTTGGTGGTTATTG | |
| M-BNIP3 | Forward | TAGGATTCGTTTCGCGTACG |
| Reverse | ACCGCGTCGCCCATTAACCGCG | |
| U-BNIP3 | Forward | TAGGATTTGTTTTGTGTATG |
| Reverse | ACCACATCACCCATTAACCACA |
Western blot
Western blot was performed as previously described [14-15]. Cells were lysed in RIPA buffer with protease inhibitors and phosphatase inhibitors for 30 minutes on ice. Following centrifugation (16,000 g, 30 minutes, 4 ℃), the supernatant was collected as total cell protein. The protein was resolved by SDS/PAGE and blotted on PVDF membranes (Millipore, Bedford, MA, USA). The PVDF membranes were incubated with specific primary antibodies at 4℃ overnight. After incubation with HRP-linked secondary antibodies at room temperature for 2 hours, immunoreactive proteins were visualized by the enhanced chemiluminescnet substrate (Thermo Scientific, Pittsburgh, PA, USA).
Primary antibodies against BNIP3 and HRP-linked secondary antibodies were from Sigma-Aldrich, DNMT1 antibody was from Imgenex Corp. (San Diego, CA, USA), DNMT3B antibody was from Abnova (China) and β-actin antibody was from Novus Biologicals, Inc. (Littleton, CO, USA).
Methylation-specific PCR (MSP-PCR)
DNA was extracted using phenol-chloroform method as previously described [16]. DNA was modified by treatment with sodium bisulfite using EZ DNA Methylation kit (Zymo Research, Irvin, CA, USA) following the manufacturer's protocol [17]. MSP-PCR was performed using the M-BNIP3 and U-BNIP3 primer (Table 1) for methylated and unmethylated DNA, respectively. Both were amplified by PCR using the following cycle: initial denaturation at 95 ℃ for 5 minutes, denaturation at 94 ℃ for 40 sec, reassociation at 62 ℃ for 40 sec, primer extension at 72 ℃ for 30 sec (15 cycles), and then, denaturation at 94 ℃ for 30 sec, reassociation at 57.5 ℃ for 40 sec, primer extension at 72 ℃ for 30 sec (22 cycles), and a final extension step at 72 ℃ for 10 minutes.
Knockdown of genes
BNIPs was knocked down by plasmid mediated small hairpin (sh) RNA interference using pGenesil-1 (Genesil Biotechnology Co, Ltd., China) according the manual[18]. The BNIP3-targeting vector (shBNIP3) or an empty vector (Mock) was transfected into LoVo cells using Lipofectamine® 2000 (Invitrogen) according to the manufacturer's instructions [4, 14]. Cells were selected using neomycin (Sigma-Aldrich). The sense sequence of the shRNA targeting BNIP3 is GGAATTAAGTCTCCGATTA.
DNMT1 and DNMT3B were knocked down by the small interfering RNA (siRNA) sequences. The sense sequence targeting DNMT1 is 5'-GCACAGAAGUCAACCCAAAtt-3' and the anti-sense sequence is 5'-UUUGGGUUGACUUCUGUGCtt-3'. The sense sequence targeting DNMT3B is 5'-ACCAGGACUCGUUCAGAAAtt-3' and the anti-sense sequence is 5'-UUUCUGAACGAGUCCUGGUtt-3'. The sense sequence of scrambled RNA as a control is 5'-UUAAGUAGCUUGGCCUUGAtt-3' and the anti-sense sequence is 5'-UCAAGGCCAAGCUACUUAAtt-3'. All siRNA duplexes were chemically synthesized by the Shanghai GenePharma Company (China).
Flow cytometry
Propidium iodide (PI) (BD Biosciences Clontech, Palo Alto, CA, USA) was utilized for flow cytometry to determine the percentage of apoptotic cells and the percentages of cells at different stages [19]. Cells were harvested and were incubated with 300 μL 50 μg/mL PI for 30 minutes at 4 ℃ in the dark. Each sample was analyzed using flow cytometry (BD Biosciences Clontech) within 30 minutes.
MTT assay
Drug sensitivity was assayed using the MTT assay [20]. In brief, cells were seeded in 96-well plates with 100 μL media each well and treated as indicated. Then, 20 μL 5 mg/mL MTT (BD Biosciences Clontech) was added to each well and was incubated at 37 ℃ for 4 hours. MTT/media was replaced with 150 μL DMSO (Sigma-Aldrich) each well and the plate was shook for 15 minutes to dissolve formazan crystals that formed. The absorbance was measured at 490 nm using a microplate reader.
Cell growth
Cells were seeded in 24-well plates at the concentration of 1×10⁴/well. Cells were trypsinized as single cell suspension 1, 2, 3, 4, 5 days later and were counted using a cytometer. Each time point contained 3 samples and each sample was counted 3 times.
Statistical analyses
The data shown represent the mean ± standard error. The Kaplan-Meier test and Spearman's rank correlation coefficient were used to analyze the relationship between BNIP3 and clinicopathological parameters. Overall survival (OS) and progression-free survival (PFS) curves were estimated by the Kaplan-Meier technique and compared with use of the two-sided log-rank test. Statistical differences between groups were analyzed by Student's t-test, one-way ANOVA in other experiments. A p-value<0.05 was considered statistically significant.
Results
Absence of BNIP3 expression in colorectal cancer negatively correlates with chemotherapy response/PFS
Archival surgical resection specimens from 81 patients with colorectal cancer (46 male; 35 female) with a mean age of 56 (range 18-81) years were analyzed. Of the 81 cancer samples, 19 were in the proximal colon, 15 were in the distal colon and 47 were in the rectum. 29 were well differentiated, 37 were moderately differentiated and 15 were poorly differentiated. 1 was CR, 32 were PR, 22 were SD and 26 were PD. All samples underwent immunohistochemical staining for BNIP3 protein.
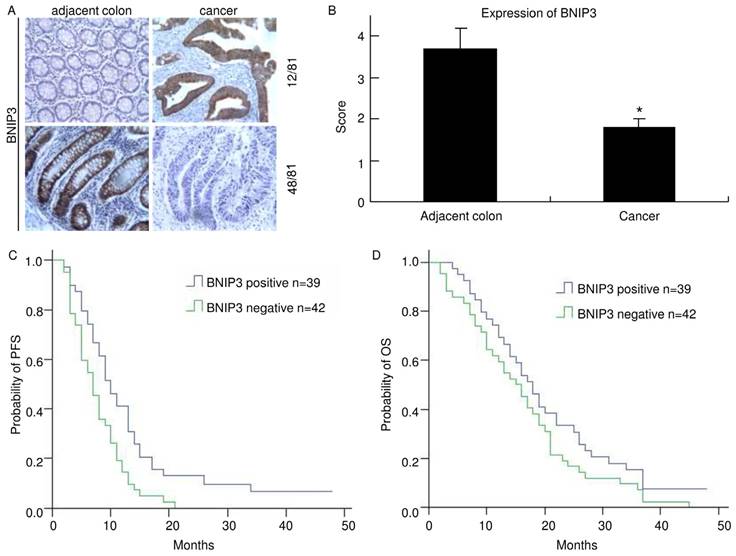
Positive BNIP3 expression was found in 39 of 81 (48.1%) cases of colorectal cancer examined, while it was negative in the remaining 42 (51.9%). Positive immunohistochemical staining for BNIP3 was found mainly in cytoplasm. In 12 of the matched pairs, BNIP3 was higher in the cancer sample than in the adjacent colorectum. However, in 48 pairs, BNIP3 expression was lower in the cancer sample than in the adjacent colorectum (Fig. 1A). The mean score of BNIP3 in cancer was 1.8±0.2 and it was 3.7±0.5 in adjacent colorectum. There was a significant difference (p<0.05) (Fig. 1B). These indicated that colorectal cancer tissues lost BNIP3 expression relative to matched adjacent colorectums. Clinical and pathological features of patients and their correlation with the presence of immunohistochemical staining of BNIP3 are summarized in Table 2.
Absence of BNIP3 expression in colorectal cancer negatively correlates with PFS. A) Cytoplasmic BNIP3 expression in matched colorectal cancer and adjacent colorectum pairs. Adjacent colorectum showed lower BNIP3 staining than matched cancer sample in 12 of 81 patients (up) and adjacent colorectum showed higher BNIP3 staining than matched cancer sample in 48 of 81 patients (down). B) Matched adjacent colorectum and cancer tissue was scored for the intensity of BNIP3 staining. The mean score of BNIP3 in cancer was significantly lower than that in adjacent colorectum (*: p<0.05) C) The median PFS of the BNIP3 positive group was significantly longer than that of the BNIP3 negative group (p=0.011). D) The median OS of the BNIP3 positive group was longer than that of the BNIP3 negative group, but without significance (p=0.143).
Spearman's rank correlation coefficient analysis of the association between presence of immunohistochemical staining of BNIP3 and clinicopathological parameters in patients with colon cancer (n=81).
| Parameter | BNIP3 | χ2 | P | |
|---|---|---|---|---|
| Negative n(%) | Positive n(%) | |||
| Total patients | 42 (51.9) | 39(48.1) | ||
| Age, years | 0.41 | 0.522 | ||
| <60, n=49 | 24 (49.0) | 25 (51.0) | ||
| ≥60, n=32 | 18 (56.3) | 14 (43.7) | ||
| Sex | 0.266 | 0.606 | ||
| Male, n=46 | 25 (54.3) | 21 (45.7) | ||
| Female, n=35 | 17 (48.6) | 18 (51.4) | ||
| Primary site | 0.451 | 0.798 | ||
| Proximal colon, n=19 | 11 (57.9) | 8 (42.1) | ||
| Distal colon, n=15 | 8 (53.3) | 7 (46.7) | ||
| Rectum, n=47 | 23 (48.9) | 24 (51.1) | ||
| Differentiation | 2.665 | 0.264 | ||
| Well, n=29 | 12 (41.4) | 17 (58.6) | ||
| Moderate, n=37 | 20 (54.1) | 17 (45.9) | ||
| Poor, n=15 | 10 (66.7) | 5 (33.3) | ||
| Metastasis site(s) | 0.054 | 0.973 | ||
| Liver, n=45 | 27 (60.0) | 18 (40.0) | ||
| Lung, n=17 | 10 (58.8) | 7 (41.2) | ||
| Other, n=29 | 18 (62.1) | 11 (37.9) | ||
| Number of metastasis site(s) | 1.424 | 0.233 | ||
| 1, n=36 | 16 (44.4) | 20 (55.6) | ||
| ≥2, n=45 | 26 (57.8) | 19 (42.2) | ||
| Chemotherapy response | 5.351 | 0.021 | ||
| CR+PR, n=33 | 12 (36.4) | 21 (63.6) | ||
| SD+PD, n=48 | 30 (62.5) | 18 (37.5) | ||
Of the 39 BNIP3 positive cases, the response (CR+PR) rate was 63.6% (21 cases) and of the 42 BNIP3 negative cases, the response rate was 36.4% (12 cases). There was a significant difference (p=0.021). No statistically significant difference in BNIP3 expression was found concerning sex, age, primary site, differentiation or metastasis.
The median PFS of the BNIP3 positive group was 9.25 months while that of the BNIP3 negative group was 6.5 months (Fig. 1C). There was a significant difference between the two groups (p=0.011). The median OS of the BNIP3 positive group was 17.25 months while that of the BNIP3 negative group was 15.0 months (Fig. 1D). The median OS of the BNIP3 positive group was longer than that of the BNIP3 negative group but there was no significant difference between them (p=0.143).
Knockdown of BNIP3 decreased chemosensitivity and enhanced cell growth
Since BNIP3 correlates with chemotherapy response/PFS in vivo, its expression was evaluated in colorectal cancer cell lines using RT-PCR (Fig. 2A). BNIP3 mRNA was not detectable in SW480, RKO, HCT15 and HT29. SW620, HCT116, LS174T and LoVo expressed BNIP3 mRNA. BNIP3 protein was evaluated using western blot (Fig. 2B). HCT116, LS174T and LoVo expressed BNIP3 and BNIP3 protein level in SW620 was undetectable under normoxia.
Knockdown of BNIP3 decreased chemosensitivity and enhanced cell growth. A) RT-PCR. B) Western blot. C) RT-PCR. D) Western blot. E) MTT. Knockdown of BNIP3 decreased chemosensitivity of LoVo cells to 5-Fu. F) IC50. (*: p<0.05 vs Mock or Parental) G) Apoptosis assayed using flow cytometry. Knockdown of BNIP3 significantly decreased 5-Fu induced apoptosis. (*: p<0.05 vs Mock or Parental) H) Cell growth. Knockdown of BNIP3 enhanced cell growth. (H: Hypoxia; N: Normoxia)
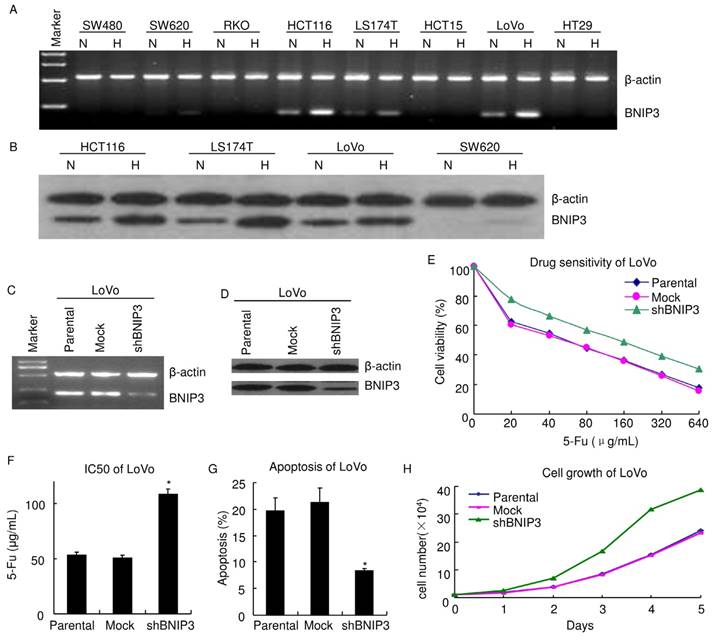
To explore the role of BNIP3 in colorectal cancer, BNIP3 in LoVo was knocked down using plasmid delivery of shRNA. Knockdown efficiency was evaluated using RT-PCR (Fig. 2C) and western blot (Fig. 2D). Chemosensitivity was assayed using MTT. LoVo cells were inoculated in 96 well plates with a density of 5×10³/well. 48 hours later, cells were treated with gradient concentrations of 5-Fu 48 hours. Then, MTT assay was applied. Results showed that knockdown of BNIP3 significantly decreased chemosensitivity of LoVo cells to 5-Fu (Fig. 2E). IC50 (50% inhibiting concentration) of Parental, Mock and shBNIP3 LoVo cells were 52.79±2.75 μg/mL, 50.08±2.85 μg/mL and 108.4±4.69 μg/mL, respectively. IC50 of shBNIP3 were significantly higher than that of Parental or Mock (p<0.05) (Fig. 2F). Apoptosis of LoVo treated with 20 μg/mL 5-Fu for 48 hours was assayed by PI staining and flow cytometry (Fig. 2G). Apoptosis ratio of Parental, Mock and shBNIP3 were 19.75±2.37, 21.24±2.71 and 8.35±0.46, respectively. This indicated that knockdown of BNIP3 significantly decreased 5-Fu induced apoptosis (p<0.05). Knockdown of BNIP3 also increased cell growth in vitro (Fig. 2H).
Absence of BNIP3 expression is caused by aberrant methylation of BNIP3 gene
In preliminary studies, bioinformatics tools were utilized and the analyses revealed that BNIP3 promoter contains hypoxia-responsive element (HRE). It also reported that BNIP3 was increased in several cancers under hypoxia [21-22]. Results of RT-PCR showed BNIP3 mRNA was detectably increased in SW620, HCT116, LS174T and LoVo under hypoxia. It was undetectable in SW480, RKO, HCT15 and HT29 under normoxia or hypoxia (Fig. 2A). Results of western blot showed that BNIP3 protein was detectably increased in HCT116, LS174T and LoVo under hypoxia. BNIP3 protein was undetectable in SW620 under normoxia and it was detectable under hypoxia. These demonstrated that hypoxia increased BNIP3 expression in a proportion of colon cancer cell lines.
It was reported that hypoxia regulated BNIP3 expression through methylation/demethylation and aberrant methylation played a key role in regulation of BNIP3 expression in several cancer [21-23]. The promoter methylation status of BNIP3 was examined by MSP-PCR (Fig. 3A). Results of MSP-PCR verified that SW620 and HCT15 displayed both BNIP3 methylated allele and unmethylated allele. HCT116, LS174T and LoVo displayed an unmethylated allele and BNIP3 methylated allele was not detectable. SW480, RKO and HT29 displayed a methylated allele and BNIP3 unmethylated allele was not detectable. As mentioned above, HCT116, LS174T and LoVo expressed BNIP3 and BNIP3 was undetectable in SW480, RKO and HT29 (Fig. 2A~B). These demonstrated that the colorectal cell lines which displayed BNIP3 unmethylated allele expressed BNIP3 and those which displayed BNIP3 methylated allele only did not expressed detectable BNIP3. These suggested that absence of BNIP3 expression may be caused by aberrant methylation of BNIP3 gene.
Absence of BNIP3 expression correlated with aberrant methylation of BNIP3 gene. A~C) Methylation status of the BNIP3 promoter in cell lines was examined by MSP-PCR. Bands in Lanes U and M are PCR products amplified with unmethylated and methylated gene-specific primers, respectively. D) RT-PCR. E) Western blot. F) Apoptosis assayed using flow cytometry. 1 μm 5-Aza 72 hours treatment significantly increased apoptosis in SW480. (p<0.05)
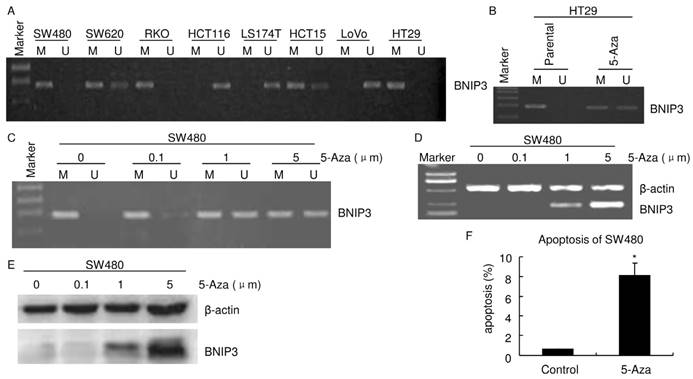
HT29 and SW480 cells were treated with the demethylating agent, 5-Aza. MSP-PCR analyses verified that both a BNIP3 unmethylated allele and a methylated allele were detectable in HT29 treated with 1 μm 5-Aza for 24 hours (Fig. 3B). 5-Aza 24 hours treatment increased BNIP3 unmethylated allele level in SW480 (Fig. 3C). Results of RT-PCR and western blot showed that 5-Aza increased BNIP3 in a dose dependent manner (Fig. 3D and E). Taken together with results mentioned above, these indicated that absence of BNIP3 expression was caused by aberrant methylation of BNIP3 gene. Since BNIP3 is a pro-apoptotic protein, increasing its expression may increase apoptosis. Results of PI staining flow cytometry showed that 1 μm 5-Aza 72 hours treatment significantly increased apoptosis in SW480 (Fig. 3F).
DNMT1 and DNMT3B play different roles in methylation regulating BNIP3 expression
It was reported that DNMT1 and DNMT3B play key roles in methylation [24-25]. Their expressions were assayed. Results of RT-PCR showed that both DNMT1 and DNMT3B were expressed in all colorectal cell lines in this study (SW480, SW620, RKO, HCT116, LS174T, HCT15, LoVo and HT29) (Fig. 4A). Results of western blot were consistent with that of RT-PCR. All colorectal cell lines expressed both DNMT1 and DNMT3B. Their expression levels are higher in HT29 and HCT15 than in other cell lines (Fig. 4B).
DNMT1 and DNMT3B play different roles in the mechanism of aberrant methylation of BNIP3 increasing chemoresistance to 5-Fu. A) RT-PCR. B~C) Western blot. D) Methylation status of the BNIP3 promoter in cell lines was examined by MSP-PCR. Bands in Lanes U and M are PCR products amplified with unmethylated and methylated gene-specific primers, respectively. E) RT-PCR. F) Western blot. E) MTT. Knockdown of DNMT1 increased chemosensitivity of HT29 cells to 5-Fu. Knockdown of DNMT1 and 3B increased chemosensitivity more than knockdown of DNMT1 alone. H) IC50. (*: p<0.05 vs Mock or Parental; #: p>0.05 vs Mock or Parental; $: p<0.05 vs siDNMT1; §: p<0.05 vs siDNMT3B)
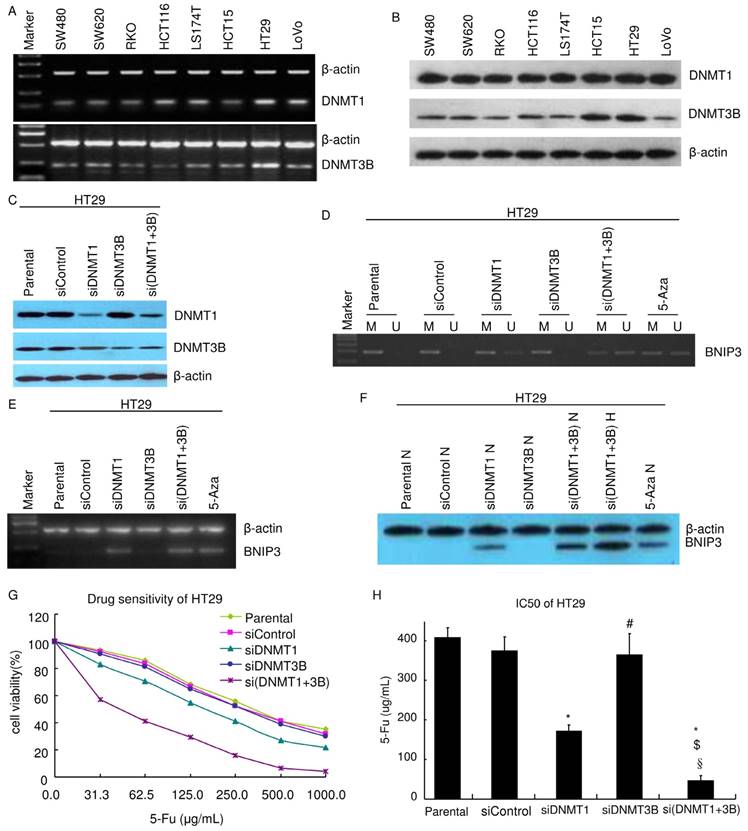
To explore the mechanism of methylation regulating BNIP3 expression, DNMT1 and DNMT3B were knocked down using siRNA in HT29. Knockdown efficiency was evaluated using western blot (Fig. 4C). The promoter methylation status of BNIP3 in HT29 was analyzed by MSP-PCR (Fig. 4D). Knockdown of DNMT1 (siDNMT1) or knockdown of both DNMT1 and DNMT3B (si(DNMT1+3b)) increased BNIP3 unmethylated allele level as 1 μm 24 hours 5-Aza treatment did. Knockdown of DNMT3B alone (siDNMT3B) did not detectably increase BNIP3 unmethylated allele level (Fig. 4D). Results of RT-PCR and western blot showed that siDNMT1 or si(DNMT1+3b) increased BNIP3 expression as 1 μm 24 hours 5-Aza treatment did. siDNMT3B did not detectably increase BNIP3 expression. BNIP3 expression level in si(DNMT1+3b) cells was higher than that in siDNMT1 cells (Fig. 4E and F). These pointed out that DNMT1 plays a key role in methylation regulating BNIP3 expression. Though DNMT3B alone may not play a role in the mechanism, it may co-operate with DNMT1 to regulate BNIP3 expression via methylation.
Further experiments were done to testify the above conclusion. Chemosensitivity of HT29 to 5-Fu was assayed using MTT (Fig. 4G~H). siDNMT1 cells were more sensitive than siControl cells and their IC50 was significantly lower (p<0.05). siDNMT3B cells were not significantly sensitive than siControl cells and their IC50 was similar as siControl cells' (p>0.05). si(DNMT1+3b) cells were more sensitive than siDNMT1 cells, let alone siControl cells. IC50 of si(DNMT1+3b) cells was significantly lower than siControl cells, siDNMT1 cells or siDNMT3B cells, respectively (p<0.05). Results of PI staining flow cytometry showed that knockdown of DNMT1 significantly increased apoptosis. Though knockdown of DNMT3B did not detectably change apoptosis ratio, knockdown of both DNMT1 and DNMT3B significantly increased more apoptosis than knockdown of DNMT1 alone did (Table 3). Knockdown of DNMT1 alone or knockdown of both DNMT1 and DNMT3B resulted in S cell cycle decreasing and G0/G1 increasing (Table 3). These suggested that knockdown of DNMT1 alone or knockdown of both DNMT1 and DNMT3B suppressed cell growth.
siDNMT1 or siDNMT3B affects HT29 cell mitotic cycle and apoptosis (%)
| mitotic cycle | Apoptosis | |||
|---|---|---|---|---|
| G0/G1 | S | G2/M | ||
| sicontrol | 60.50±1.49 | 26.28±0.29 | 13.23±0.91 | 1.023±0.28 |
| siDNMT1 | 73.64±3.02* | 18.17±1.17* | 8.37±0.53 | 7.27±1.25* |
| siDNMT3B | 60.37±2.51 | 24.80±0.94 | 14.72±1.40 | 1.80±0.24 |
| si(DNMT1+3b) | 77.64±0.36* | 14.57±0.37* | 7.79±0.58 | 14.67±1.90*$ |
*: p<0.05 vs sicontrol; $: p<0.05 vs siDNMT1
Discussion
BNIP3 (BCL2/adenovirus E1B 19 kDa protein-interacting protein 3) is a member of the BH3-only family of Bcl-2 proteins and has been assigned roles in apoptosis, programmed necrosis, autophagy and mitophagy during exposure of cells and tissues to hypoxia or ischemia [26-28]. Aberrant BNIP3 expression was found in various types of cancer [21-23, 29]. BNIP3 expression in colorectal cancer was assayed in this study. BNIP3 mRNA was not detectable in 4/8 colorectal cell lines (Fig. 2A) and BNIP3 protein was negative in 42 of 81 cases of colorectal cancer (Table 2). Furthermore, colorectal cancer tissues lost BNIP3 expression relative to matched adjacent colorectums (Fig. 1A and B). These demonstrate that there had been a loss of BNIP3 expression during colorectal cancer development.
Accumulating evidences indicate DNA methylation, one of the epigenetic modulations, is important in transcription regulation and chromatin structure remodeling during colorectal cancer development [13, 21-23, 29]. Recent works have verified that aberrant DNA methylation could result in genome-wide hypomethylation and regional hypermethylation, which is identified as a possible mechanism of inactivation of tumor suppressor genes, thus it may play an important role during carcinogenesis [13, 21-22]. DNA methylation mainly occurs at the CpG dinucleotides by three DNA methyltransferases (DNMTs), namely DNMT1, DNMT3A, and DNMT3B [22, 24-25]. DNMT1 is the maintenance methyltransferase that ensures faithful transmission of the methylation profile from maternal to daughter cells during cell division [25]. DNA methyltransferases DNMT3A and 3B are essential for de novo methylation by catalyzing the transfer of a methyl group to cytosine residues on DNA [24]. The promoter of BNIP3 is located within a CpG island and aberrant methylation of the BNIP3 gene in colorectal cancer was reported in several papers [21-23, 29]. This study showed that the colorectal cell lines which displayed BNIP3 unmethylated allele expressed BNIP3 and those which displayed BNIP3 methylated allele only did not expressed detectable BNIP3 (Fig. 2A, 2B, 3A). Demethylation dramatically increased BNIP3 expression level (Fig. 3B~E). These indicate that absence of BNIP3 expression was caused by aberrant methylation of BNIP3 gene. Further experiments showed that DNMT1 and DNMT3B played different roles in regulating BNIP3. The detail mechanism is still unclear and intensive investigation is deserved.
BNIP3 is present in the outer mitochondrial membrane with its N-terminus in the cytoplasm and its C-terminus inside the mitochondrion [27]. It collapses mitochondrial membrane potential, increases generation of reactive oxygen species, induces mitochondrial swelling, promotes mitochondrial fission, and stimulates mitochondrial turnover [28]. When the damaging effects of BNIP3 exceed the ability of the cell to efficiently dispose of damaged mitochondria, cell death can ensue [28]. 5-Fu kills cancer cells largely through mitochondrial pathway [30-31]. Therefore, the role of BNIP3 in chemoresistance to 5-Fu was explored. In vivo experiments showed that the decreased BNIP3 expression significantly negatively correlated with the response rate to L-OHP+CF+5-Fu chemotherapy (Table 2). In vitro experiments showed that knockdown of BNIP3 significantly decreased chemosensitivity to 5-Fu and increasing BNIP3 through demethylation via 5-Aza or knockdown of DNMT1/DNMT1+3B significantly increased chemosensitivity to 5-Fu (Fig. 2E~G, 3F, 4G~H). These unanimously indicate that absence of BNIP3 expression in colorectal cancer increased chemoresistance to 5-Fu.
In vivo experiments showed that absence of BNIP3 expression significantly negatively correlated with PFS of colorectal patients receiving L-OHP+CF+5-Fu chemotherapy (Fig. 1C). This also provides an evidence supporting the conclusion that absence of BNIP3 expression increased chemoresistance to 5-Fu. In vitro experiments also showed knockdown of BNIP3 enhanced cell growth in vitro or increased BNIP3 expression suppressed cell growth (Fig. 2H, Table 3). This may also attribute to explain the in vivo result that that absence of BNIP3 expression significantly negatively correlated with PFS.
Conclusions
5-Fu is one of the most commonly used drugs to treat colorectal cancer but about 50% of colorectal cancer patients are resistant to 5-Fu-based chemotherapy [6-8]. This study showed that BNIP3 was frequently down-regulated in colorectal cancer and absence of BNIP3 expression significantly negatively correlated with chemotherapy response/PFS to L-OHP+CF+5-Fu chemotherapy. Aberrant methylation of BNIP3 gene via DNMT1 and DNMT3B was involved in the mechanism of absence of BNIP3 expression increasing chemoresistance to 5-Fu. These findings may contribute to overcome resistance to 5-Fu-based chemotherapy and suggest BNIP3 may act as a potential predictor of colorectal cancer sensitivity to 5-Fu-based chemotherapy.
Abbreviations
5-Fu: 5-fluorouracil; PFS: progression-free survival; CT: computed tomography; MRI: magnetic resonance imaging; RECIST: Response Evaluation Criteria in Solid Tumors; CR: complete response; PR: partial response; SD: stable disease; PD: progressive disease; H&E: hematoxylin and eosin; FBS: fetal bovine serum; RT-PCR: semi-quantitative reverse transcription polymerase chain reaction; MSP-PCR: methylation-specific PCR; sh: small hairpin; si: small interfering; PI: propidium iodide; OS: overall survival; PFS: progression-free survival; HRE: hypoxia-responsive element; BNIP3: BCL2/adenovirus E1B 19 kDa protein-interacting protein 3; DNMTs: DNA methyltransferases; H: Hypoxia; N: Normoxia.
Acknowledgements
This work was supported by the National Natural Science Foundation of China (grant no. 81000990), the Natural Science Foundation Project of CQ CSTC (grant no. cstc2016jcyjA2109).
Ethics Committee Approval
The study was approved by the Ethics Committee of Southwest Hospital, the Third Military Medical University. All procedures performed in this study were in accordance with the 1964 Helsinki Declaration and its later amendments.
Competing Interests
The authors have declared that no competing interest exists.
References
1. Torre LA, Bray F, Siegel RL, Ferlay J, Lortet-Tieulent J, Jemal A. Global cancer statistics, 2012. CA Cancer J Clin. 2015;65:87-108
2. Bardou M, Barkun AN, Martel M. Obesity and colorectal cancer. Gut. 2013;62:933-47
3. He J, Shin H, Wei X, Kadegowda AK, Chen R, Xie SK. NPC1L1 knockout protects against colitis-associated tumorigenesis in mice. BMC Cancer. 2015;15:189
4. He J, Liang X, Luo F, Chen X, Xu X, Wang F. et al. P53 Is Involved in a Three-Dimensional Architecture-Mediated Decrease in Chemosensitivity in Colon Cancer. J Cancer. 2016;7:900-9
5. Sargent D, Sobrero A, Grothey A, O'Connell MJ, Buyse M, Andre T. et al. Evidence for cure by adjuvant therapy in colon cancer: observations based on individual patient data from 20,898 patients on 18 randomized trials. J Clin Oncol. 2009;27:872-7
6. Douillard JY, Cunningham D, Roth AD, Navarro M, James RD, Karasek P. et al. Irinotecan combined with fluorouracil compared with fluorouracil alone as first-line treatment for metastatic colorectal cancer: a multicentre randomised trial. Lancet. 2000;355:1041-7
7. Giacchetti S, Perpoint B, Zidani R, Le Bail N, Faggiuolo R, Focan C. et al. Phase III multicenter randomized trial of oxaliplatin added to chronomodulated fluorouracil-leucovorin as first-line treatment of metastatic colorectal cancer. J Clin Oncol. 2000;18:136-47
8. Pereira DM, Simoes AE, Gomes SE, Castro RE, Carvalho T, Rodrigues CM. et al. MEK5/ERK5 signaling inhibition increases colon cancer cell sensitivity to 5-fluorouracil through a p53-dependent mechanism. Oncotarget. 2016;7:34322-40
9. Eisenhauer EA, Therasse P, Bogaerts J, Schwartz LH, Sargent D, Ford R. et al. New response evaluation criteria in solid tumours: revised RECIST guideline (version 1.1). Eur J Cancer. 2009;45:228-47
10. Li Y, He J, Zhong D, Li J, Liang H. High-mobility group box 1 protein activating nuclear factor-kappaB to upregulate vascular endothelial growth factor C is involved in lymphangiogenesis and lymphatic node metastasis in colon cancer. J Int Med Res. 2015;43:494-505
11. He JM, Wang FC, Qi HB, Li Y, Liang HJ. Down-regulation of alphav integrin by retroviral delivery of small interfering RNA reduces multicellular resistance of HT29. Cancer Lett. 2009;284:182-8
12. Ding Z, Yang L, Xie X, Xie F, Pan F, Li J. et al. Expression and significance of hypoxia-inducible factor-1 alpha and MDR1/P-glycoprotein in human colon carcinoma tissue and cells. J Cancer Res Clin Oncol. 2010;136:1697-707
13. Chen H, Zhang T, Sheng Y, Zhang C, Peng Y, Wang X. Methylation Profiling of Multiple Tumor Suppressor Genes in Hepatocellular Carcinoma and the Epigenetic Mechanism of 3OST2 Regulation. J Cancer. 2015;6:740-9
14. Liang X, Xu X, Wang F, Chen X, Li N, Wang C. et al. E-cadherin knockdown increases beta-catenin reducing colorectal cancer chemosensitivity only in three-dimensional cultures. Int J Oncol. 2015;47:1517-27
15. Liang X, Xu X, Wang F, Li N, He J. E-cadherin increasing multidrug resistance protein 1 via hypoxia-inducible factor-1alpha contributes to multicellular resistance in colorectal cancer. Tumour Biol. 2016;37:425-35
16. Kramvis A, Bukofzer S, Kew MC. Comparison of hepatitis B virus DNA extractions from serum by the QIAamp blood kit, GeneReleaser, and the phenol-chloroform method. J Clin Microbiol. 1996;34:2731-3
17. Ligtenberg MJ, Kuiper RP, Chan TL, Goossens M, Hebeda KM, Voorendt M. et al. Heritable somatic methylation and inactivation of MSH2 in families with Lynch syndrome due to deletion of the 3' exons of TACSTD1. Nat Genet. 2009;41:112-7
18. Peng Q, Zhou Q, Zhou J, Zhong D, Pan F, Liang H. Stable RNA interference of hexokinase II gene inhibits human colon cancer LoVo cell growth in vitro and in vivo. Cancer Biol Ther. 2008;7:1128-35
19. Inoue H, Takahashi H, Hashimura M, Eshima K, Akiya M, Matsumoto T. et al. Cooperation of Sox4 with beta-catenin/p300 complex in transcriptional regulation of the Slug gene during divergent sarcomatous differentiation in uterine carcinosarcoma. BMC Cancer. 2015;16:53
20. Li Y, Liu D, Zhou Y, Xie J, Lee RJ, Cai Y. et al. Silencing of Survivin Expression Leads to Reduced Proliferation and Cell Cycle Arrest in Cancer Cells. J Cancer. 2015;6:1187-94
21. Bacon AL, Fox S, Turley H, Harris AL. Selective silencing of the hypoxia-inducible factor 1 target gene BNIP3 by histone deacetylation and methylation in colorectal cancer. Oncogene. 2007;26:132-41
22. Okami J, Simeone DM, Logsdon CD. Silencing of the hypoxia-inducible cell death protein BNIP3 in pancreatic cancer. Cancer Res. 2004;64:5338-46
23. Murai M, Toyota M, Suzuki H, Satoh A, Sasaki Y, Akino K. et al. Aberrant methylation and silencing of the BNIP3 gene in colorectal and gastric cancer. Clin Cancer Res. 2005;11:1021-7
24. Hu N, Strobl-Mazzulla PH, Simoes-Costa M, Sanchez-Vasquez E, Bronner ME. DNA methyltransferase 3B regulates duration of neural crest production via repression of Sox10. Proc Natl Acad Sci U S A. 2014;111:17911-6
25. Tao R, Chen Z, Wu P, Liu C, Peng Y, Zhao W. et al. The possible role of EZH2 and DNMT1 polymorphisms in sporadic triple-negative breast carcinoma in southern Chinese females. Tumour Biol. 2015;36:9849-55
26. Thompson JW, Wei J, Appau K, Wang H, Yu H, Spiga MG. et al. Bnip3 Binds and Activates p300: Possible Role in Cardiac Transcription and Myocyte Morphology. PLoS One. 2015;10:e0136847
27. Bocharov EV, Pustovalova YE, Pavlov KV, Volynsky PE, Goncharuk MV, Ermolyuk YS. et al. Unique dimeric structure of BNip3 transmembrane domain suggests membrane permeabilization as a cell death trigger. J Biol Chem. 2007;282:16256-66
28. Liu KE, Frazier WA. Phosphorylation of the BNIP3 C-Terminus Inhibits Mitochondrial Damage and Cell Death without Blocking Autophagy. PLoS One. 2015;10:e0129667
29. Shimizu S, Iida S, Ishiguro M, Uetake H, Ishikawa T, Takagi Y. et al. Methylated BNIP3 gene in colorectal cancer prognosis. Oncol Lett. 2010;1:865-72
30. Yin H, Xie F, Zhang J, Yang Y, Deng B, Sun J. et al. Combination of interferon-alpha and 5-fluorouracil induces apoptosis through mitochondrial pathway in hepatocellular carcinoma in vitro. Cancer Lett. 2011;306:34-42
31. Shin YK, Yoo BC, Chang HJ, Jeon E, Hong SH, Jung MS. et al. Down-regulation of mitochondrial F1F0-ATP synthase in human colon cancer cells with induced 5-fluorouracil resistance. Cancer Res. 2005;65:3162-70
Author contact
![]() Corresponding author: Tel. (Fax.): +86 23 68754128; E-mail: lianghoujiecom (H. Liang)
Corresponding author: Tel. (Fax.): +86 23 68754128; E-mail: lianghoujiecom (H. Liang)