Impact Factor ISSN: 1837-9664

 Global reach, higher impact
J Cancer 2017; 8(3):460-468. doi:10.7150/jca.16914 This issue Cite
Research Paper
Epigenetic dysregulation of NKD2 is a valuable predictor assessing treatment outcome in acute myeloid leukemia
Xi-xi Li1*, Jing-dong Zhou1*, Ting-juan Zhang1, Lei Yang1, Xiang-mei Wen2, Ji-chun Ma2, Jing Yang1, Zhi-hui Zhang1, Jiang Lin2 ![]() , Jun Qian1
, Jun Qian1 ![]()
1. Department of Hematology, Affiliated People's Hospital of Jiangsu University, Zhenjiang, Jiangsu, People's Republic of China;
2. Laboratory Center, Affiliated People's Hospital of Jiangsu University, Zhenjiang, Jiangsu, People's Republic of China.
*These authors contributed equally to this work.
Received 2016-7-20; Accepted 2016-11-14; Published 2017-2-11
Abstract
AIM: The present study was aimed to investigate NKD2 expression as well as promoter methylation and further analyze their clinical significance in patients with acute myeloid leukemia (AML).
METHODS: Real-time quantitative PCR was carried out to detect the pattern of NKD2 expression in 113 AML patients and 24 controls. Real-time quantitative methylation-specific PCR (RQ-MSP) and bisulfite sequencing PCR (BSP) were carried out to detect NKD2 promoter methylation in 101 AML patients and 24 controls with available DNA.
RESULTS: The level of NKD2 transcript in AML patients was significantly down-regulated as compared with controls (P=0.039). NKD2 methylation level in AML patients was significantly higher than controls (P=0.044). Moreover, NKD2 methylation negatively correlated with NKD2 expression in AML patients (R=-0.218, P=0.029). Furthermore, demethylation of NKD2 could increase NKD2 expression in the leukemic cell line THP1 (P<0.05). NKD2 low-expressed and high-expressed patients showed no statistical significance in complete remission (CR) rate among cytogenetically normal AML (CN-AML). However, low NKD2 expression was associated with shorter overall survival (OS) time and acted as independent risk factor in CN-AML according to Kaplan-Meier (P=0.029) and Cox regression analyses (P=0.022). Furthermore, gene expression (GEP) data also confirmed the prognostic value of NKD2 expression in CN-AML patients. Moreover, NKD2 showed significantly increased level in post-CR than initial diagnosis in follow-up AML patients (P=0.024).
CONCLUSION: Decreased NKD2 expression inactivated by promoter hypermethylation is a common event in AML and is associated with adverse outcome in CN-AML patients.
Keywords: NKD2, expression, methylation, prognosis, acute myeloid leukemia.
Introduction
Acute myeloid leukemia (AML) is a complex cancer characterized by uncontrolled proliferation and apoptosis of abnormal stem cells in the bone marrow (BM) and inhibition in the growth of normal hematopoietic cells [1,2]. The diagnosis of AML mainly depends on the features of morphology, immunology, cytogenetics, and molecular biology (MICM). Despite the advancements in the treatment of leukemia, clinical outcome of AML remains unsatisfactory [3]. Cytogenetic alterations play crucial roles in the pathogenesis of AML and also act as vital biological markers in predicting prognosis for AML [4,5]. However, there are approximately 40% de novo AML patients do not have clonal cytogenetic abnormalities, which was defined as cytogenetically normal AML (CN-AML) [6,7]. Clinical outcome of CN-AML patients is quite heterogeneous from a few days to complete cure. Recently, several molecular biomarkers including NPM1, CEBPA, C-KIT, and FLT3 mutations have provided helpful prognostic information for these patients [8]. Therefore, identifying novel genetic and epigenetic alterations which can recognize the patients who are at the risk of poor outcome is warranted to optimize treatment strategies [9,10].
WNT/β-Catenin signaling pathway plays crucial roles in physiological processes including stem cell maintenance, cell differentiation, migration, apoptosis and proliferation during embryonic development [11,12]. At the same time, abnormal regulation of Wnt/β-catenin signaling pathway also contributes to the development of human cancers including leukemia. Increasing studies have indicated that dysregulated Wnt pathway is associated with leukemogenesis and clinical outcome [13-16]. Overexpression of Wnt/β-catenin pathway genes or loss of Wnt antagonists promotes uncontrolled cell growth and survival [17]. Naked family (NKD1 and NKD2) has been reported to function as a negative regulator of Wnt/β-catenin signaling pathway [18]. NKD binds and inactivates dishevelled, a scaffold protein that transduces the Wnt signal from the frizzled receptor to the destruction complex [19]. Decreased expression of NKD2 caused by its promoter hypermethylation has been increasingly demonstrated in several solid tumors [19-22]. However, the pattern of NKD2 expression and methylation in AML has not been explored yet. Therefore, we focused on the NKD2 expression as well as methylation and their clinical significance in de novo patients with AML in the current study.
Materials and methods
Patients' samples
A total of 113 patients with a diagnosis of de novo AML including 42 CN-AML were enrolled into the study approved by the Institutional Review Board of the Affiliated People's Hospital of Jiangsu University. The diagnosis and classification of the patients were based on the revised 2008 World Health Organization (WHO) criteria [23]. Clinical features of the patients were showed in Table 1. Treatment protocol for AML patients was described previously [24]. A total of 9 AML patients achieved complete remission (CR) after induction therapy together with 24 healthy donors were also included. Follow-up data was obtained in 94 patients ranging from 1 to 58 months with a median of 7 months. Bone marrow (BM) were collected form all the patients and participants after written informed consents were obtained.
Comparison of clinical manifestations and laboratory features between AML patients with low and high NKD2 expression.
| Patient's parameters | High (n=56) | Low (n=57) | P value |
|---|---|---|---|
| Sex, male/female | 36/20 | 31/26 | 0.340 |
| Median age, years (range) | 58 (15-86) | 53 (10-93) | 0.726 |
| Median WBC, ×109/L (range) | 22.7 (1.1-203.6) | 6.75 (1.0-197.7) | 0.066 |
| Median hemoglobin, g/L (range) | 78.5 (40-133) | 69.5 (34-142) | 0.074 |
| Median platelets, ×109/L (range) | 48.5 (3-447) | 40 (6-399) | 0.916 |
| BM blasts, % (range) | 48.5 (5.5-94.5) | 38 (3-92) | 0.385 |
| CR (-/+) | 27/25 | 28/18 | 0.419 |
| WHO | 0.865 | ||
| AML with t(8;21) | 4 (7%) | 4 (7%) | |
| APL with t(15;17) | 9 (16%) | 13 (23%) | |
| AML with inv(16)(p13q22) | 0 (0%) | 0 (0%) | |
| AML with less differentiation | 0 (0%) | 1 (2%) | |
| AML without maturation | 5 (9%) | 3 (5%) | |
| AML with maturation | 20 (36%) | 17 (30%) | |
| Acute myelomonocytic leukemia | 12 (21%) | 11 (19%) | |
| Acute monoblastic/monocytic leukemia | 4 (7%) | 7 (12%) | |
| Acute erythroid leukemia | 2 (4%) | 1 (2%) | |
| Karyotype classification | 0.726 | ||
| Favorable | 12 (21%) | 17 (30%) | |
| Intermediate | 34 (61%) | 30 (53%) | |
| Poor | 7 (13%) | 8 (14%) | |
| No data | 3 (5%) | 2 (3%) | |
| Karyotype | 0.167 | ||
| normal | 31 (56%) | 20 (35%) | |
| t(8;21) | 4 (7%) | 4 (7%) | |
| t(15;17) | 8 (14%) | 12 (21%) | |
| 11q23 | 1 (2%) | 0 (0%) | |
| complex | 6 (11%) | 9 (16%) | |
| others | 3 (5%) | 10 (18%) | |
| No data | 3 (5%) | 2 (3%) | |
| Gene mutation | |||
| CEBPA (+/-) | 10/42 | 6/44 | 0.417 |
| NPM1 (+/-) | 7/45 | 6/44 | 1.000 |
| FLT3-ITD (+/-) | 10/42 | 6/44 | 0.417 |
| c-KIT (+/-) | 2/50 | 1/49 | 1.000 |
| NRAS or KRAS (+/-) | 6/46 | 2/48 | 0.148 |
| IDH1 or IDH2 (+/-) | 3/49 | 4/46 | 0.713 |
| DNMT3A (+/-) | 6/46 | 3/47 | 0.264 |
WBC: white blood cells; AML: acute myeloid leukemia; CR: complete remission.
Cell line, cell culture and 5-aza-dC treatment
Human leukemic cell line (THP1) was cultured in 1640 medium containing 10% fetal calf serum (ExCell Bio, Shanghai, China) and grown at 37°C in 5% CO2 humidified atmosphere. For epigenetic studies, 5-aza-2'-deoxycytidine (5-aza-dC) (Sigma-Aldrich, Steinheim, USA) diluted in dimethyl sulfoxide (DMSO) was added in three flasks of THP1 cells (at a density of 5×10⁵ cells/ml in 10 ml) once a day at different final concentrations of 0 μM, 2 μM and 4 μM during 3 days. All cells were cultured until harvested for extraction of RNA and DNA.
RNA isolation, reverse transcription and RQ-PCR
BM mononuclear cells (BMMNCs) were extracted by Lymphocyte Separation Medium (TBD sciences, Tianjin, China). Total RNA was isolated using Trizol reagent (Invitrogen, Carlsbad, CA, USA). Reverse transcription (RT) was performed as reported previously [25,26].
Real-time quantitative PCR (RQ-PCR) was performed on a 7500 Thermo cycler (Applied Biosystems, CA, USA). The reaction system with 20 μL volume consisted of H2O 6 μL, 10 μM of AceQ qPCR SYBR Green Master Mix (Vazyme Biotech Co., Piscataway, NJ, USA), 0.4 μM of ROX Reference Dye 2 (Invitrogen, Carlsbad, CA,USA),and 0.8 μM of primers (forward 5'-ACAGGAGGTTGTCTGCACACG-3' and reverse 5'-GACTTGAGGAACTGCTTCTCCG-3') [20]. The RQ-PCR reaction conditions were 95 °C for 5 min, followed by 40 cycles at 95 °C for 10 s, 65 °C for 30 s, 72 °C for 32 s, and 86 °C for 32 s to collect fluorescence, finally followed by 95 °C for 15 s, 60 °C for 60 s, 95 °C for 15 s, and 60 °C for 15 s. Both positive and negative controls were included in each assay. Relative NKD2 expression levels were calculated using the following equation:
NNKD2=(ENKD2)△CT NKD2 (control-sample)÷(EABL)△CT ABL (control-sample).
DNA isolation, chemical modification and RQ-MSP
Genomic DNA was isolated using genomic DNA purification kit (Gentra, Minneapolis, MN, USA) and was modified using the CpGenome DNA Modification Kit (Chemicon, Ternecula, Canada) according to the manufacturer's instructions. The primers used for the methylated (M) [(forward) 5'-GATCGTAGGGGATAGTTTCGTGGC-3'; (reverse) 5'-AAAACAACTCTAACACCGCTCCCCG-3'] and unmethylaed (U) [(forward) 5'-TGGATTGTAGGGGATAGTTTTGTGGT-3'; (reverse)5'-CAAAAACAACTCTAACACCACTCCCCA-3'] [20]. Real-time quantitative methyaltion-specific PCR (RQ-MSP) reaction contained 0.8 μM of primers, 10 μM of AceQ qPCR SYBR Green Master Mix (Vazyme Biotech Co., Piscataway, NJ, USA), 0.4 μM of ROX Reference Dye 2 (Invitrogen, Carlsbad, CA, USA), and 20 ng of modified DNA was also performed a 7500 Thermo cycler (Applied Biosystems, CA, USA). The reaction condition was 95°C for 5 min, 40 cycles for 10 s at 95°C, 30 s at 62°C (M) or 64°C (U), 72°C for 30 s, and 80°C (M) or 76°C (U) for 30 s, eventually a melting program of one cycle at 95°C for 15 s, 60°C for 60 s, 95°C for 15 s, and 60°C for 15 s. The normalized ratio (NM-NKD2) was applied to assess the level of NKD2 promoter methylation in samples. NM-NKD2 was calculated using the following formula:
NM-NKD2 = (EM-NKD2)ΔCT M-NKD2 (control-sample) ÷ (EALU)ΔCT ALU (control-sample).
BSP
Bisulfite sequencing PCR (BSP) reaction system was composed of 1×PCR buffer (KCl 0.25 mM), dNTP Mixture 6.25 μM, primers 0.5 μM, hot start DNA polymerase 0.75 U (Takara, Tokyo, Japan), and modified DNA 20 ng. The primers for bisulfite modified NKD2 promoter were 5'-TTTTGGAGTTAGTAGTGGGGG-3' (forward) and 5'-CACCAAAAACAACTCTAACACC-3' (reverse). The program was carried out at 98°C for 10 s, 40 cycles for 10 s at 98°C, 30 s at 58°C, 72°C for 30 s, and followed by a final 7 min extension step at 72°C. The PCR products were analyzed on 2% agarose gels. Each purified product was cloned into pMD19-T Vector (Takara, Tokyo, Japan), and was transfected into DH5α competent cells (Vazyme Biotech Co., Piscataway, NJ, USA). Five clones from each sample were sequenced (BGI Tech Solutions Co., Shanghai, China).
HRMA and sequencing
High-resolution melting analysis (HRMA) was performed on the LightScanner platform (Idaho Technology Inc., Salt Lake City, Utah, USA). NRAS or KRAS, DNMT3A, IDH1/2, KIT, and NPM1 mutations were detected by HRMA [27-30]. All positive samples were confirmed by DNA direct sequencing. FLT3-ITD and CEBPA mutations were detected by direct DNA sequencing (BGI Tech Solutions Co., Shanghai, China) [31].
Statistical analyses
Statistical analyses were performed using the SPSS 20.0 software package. Mann-Whitney's U test was carried to compare the difference of continuous variables between two groups. Pearson Chi-square analysis or Fisher exact test was employed to compare the difference of categorical variables. Correlation analysis between NKD2 expression and prognosis was performed by Kaplan-Meier curves and Cox regression analysis. Receiver operating characteristic curve (ROC) and area under the ROC curve (AUC) were used to assess the value of NKD2 expression in discriminating AML patients from controls. For all analyses, a two-tailed P<0.05 was defined as statistically significant.
Results
NKD2 expression in AML patients
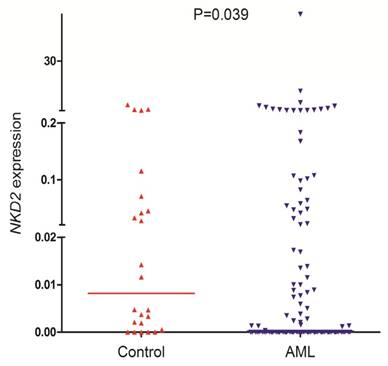
NKD2 transcript level in AML patients (range 0.0000-57.9485, median 0.0000) was significantly lower as compared with controls (range 0.0000-3.6715, median 0.0082) which indicated that NKD2 expression was down-regulated in AML (P=0.039, Fig. 1).
NKD2 expression in controls and AML patients.
Discriminative capacity of NKD2 expression
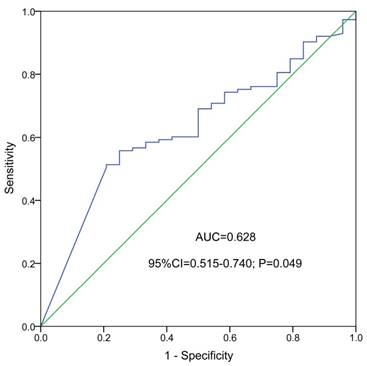
ROC curve indicated that NKD2 expression might serve as a biomarker for distinguishing whole-cohort AML patients from normal controls (AUC=0.628, 95% CI: 0.515-0.740, P=0.049, Fig. 2).
ROC curve analysis using NKD2 expression for discriminating AML patients from controls.
NKD2 methylation in AML patients
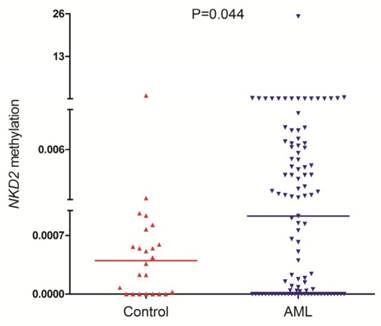
NKD2 methylation was detected in 101 AML patients and 24 controls with available DNA. NKD2 methylation level in AML patients (median 0.0009, range 0.0000-25.2199) was significantly higher than controls (median 0.0005, range 0.0000-1.0000) (P=0.044, Fig. 3) which suggested that NKD2 was hypermethylated in AML.
NKD2 methylation in controls and AML patients.
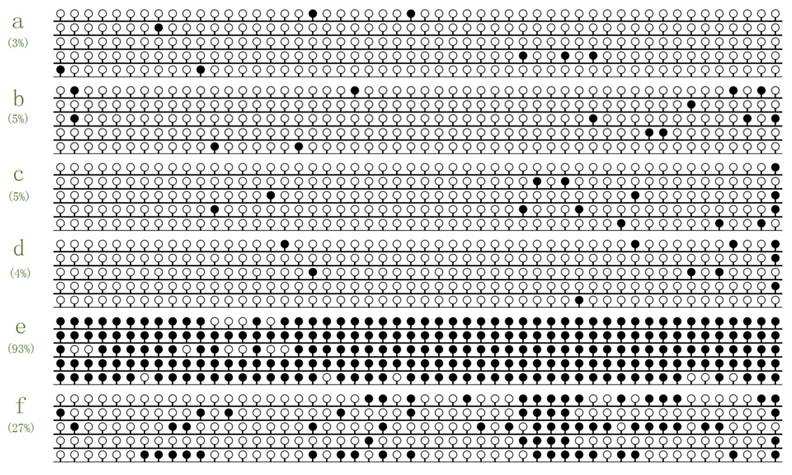
To further confirm RQ-MSP result, we selected 6 samples (2 with lowest methylation level, 2 with highest methylation level, and 2 selected randomly) to investigate the NKD2 methylation density by BSP. Controls presented almost fully unmethylated NKD2 promoter, while the two methylated AML patients presented higher density of NKD2 methylation (Fig. 4). Moreover, NKD2 methylation density in the tested samples was heavily correlated with NKD2 methylation level (R=0.928, P=0.008).
Methylation density of NKD2 promoter in normal controls and AML patients. White cycle: unmethylated CpG dinucleotide; Black cycle: methylated CpG dinucleotide. a, b: controls; c, d: selected randomly AML patients; e, f: high methylated AML patients.
NKD2 expression was regulated by its promoter methylation
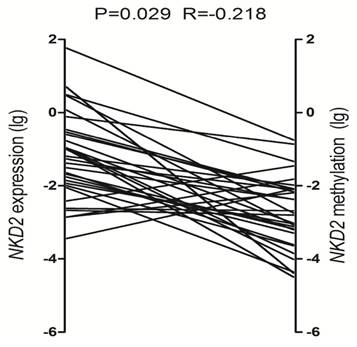
To determine the role of NKD2 promoter methylation in regulating NKD2 expression in AML, we analyzed the relationship between NKD2 methylation and expression in AML patients. Significantly negative correlation was observed between NKD2 expression and its promoter methylation in AML patients (R=-0.218, P=0.029, Fig. 5).
Relationship between NKD2 expression and its promoter methylation in AML patients.
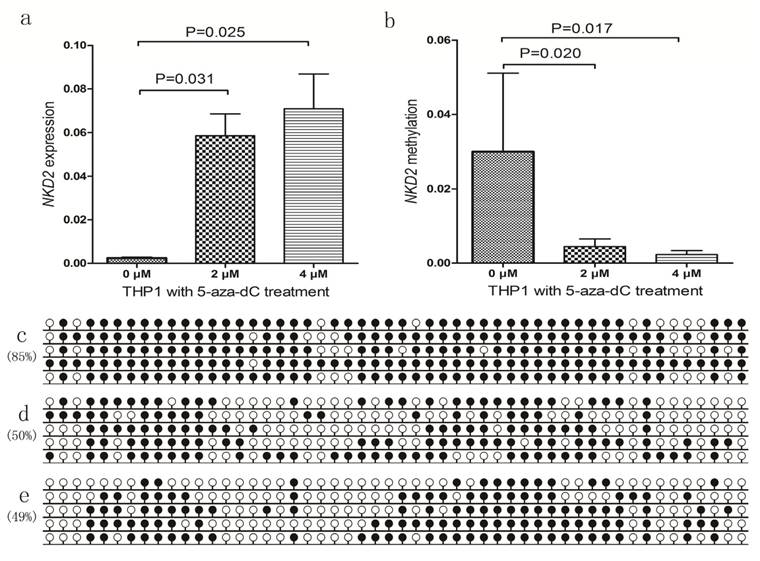
We further selected NKD2-methylated THP1 cell line treated by 5-aza-dC to further verify the epigenetic mechanism. Before 5-aza-dC treatment, THP1 showed weakly NKD2 expression and highly methylated NKD2 promoter. As expected, NKD2 promoter methylation level was decreased, meanwhile, NKD2 expression was significantly up-regulated after 5-aza-dC treatment (Fig. 6).
NKD2 expression and methylation in THP1 cell line before and after 5-aza-dC treatment. a: NKD2 relative expression levels; b: NKD2 relative methylation levels; c: NKD2 methylation density before treatment; d: NKD2 methylation density after 2 μM treatment; e: NKD2 methylation density after 4 μM treatment.
Clinical and laboratory characteristics of AML patients
The whole cohort of AML patients were divided into two groups at the median level of NKD2 expression: low NKD2 expression (NKD2low) and high NKD2 expression (NKD2high). The correlation between NKD2 expression and clinical characteristics was presented in Table 1. There were no significant differences in sex, age, platelets, white blood cells, hemoglobin and BM blasts between the NKD2high and NKD2low groups (P>0.05). No significant differences were found between the two groups in the distribution of WHO subtypes, and karyotypic classifications. Moreover, no significant correlations were found between NKD2 expression and nine gene mutations (P>0.05).
Correlation between NKD2 expression and clinical outcome
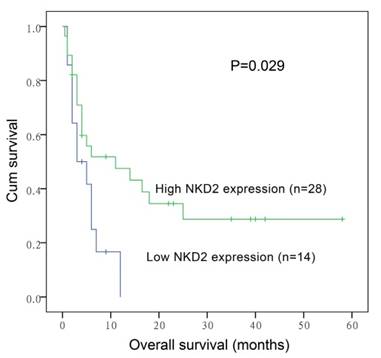
After induction therapy, there was no significant difference in complete remission (CR) rate between NKD2low patients and NKD2high patients (P=0.419, Table 1). Moreover, no significant differences were found between the two groups among both non-APL AML [30% (11/26) vs. 37% (16/27), respectively, P=0.636] and cytogenetically normal AML (CN-AML) patients [27% (4/11) vs. 50% (14/14), respectively, P=0.199]. The whole-cohort and non-APL AML showed no significant difference in both the overall survival (OS) (P=0.081 and 0.106) and leukemia-free survival (LFS) (P=0.516 and 0.376). However, among CN-AML patients, cases with low NKD2 expression had significantly shorter OS (median 3 versus 11 months, respectively, P=0.029, Fig. 7) but not LFS (P=0.178) time than those with high NKD2 expression. We further performed Cox regression analysis to determine the prognostic value of NKD2 expression in CN-AML patients. Multivariate analysis including variables [WBC (≥30×109/L vs. <30×109/L), age (>60 vs. ≤60 years old), gene mutations (mutant vs. wild-type), and NKD2 expression (high vs. low)] with P<0.20 in univariate analysis, and disclosed that low NKD2 expression and WBC were independent risk factor in OS but not LFS analyses among CN-AML patients (Table 2 and 3).
Overall survival of CN-AML patients.
Univariate and multivariate analyses of prognostic factors for overall survival in CN-AML patients.
| prognostic factors | Univariate analysis | Multivariate analysis | ||
|---|---|---|---|---|
| Hazard ratio (95% CI) | P value | Hazard ratio (95% CI) | P value | |
| age | 2.717 (1.504-4.912) | 0.001 | 1.897 (0.823-4.376) | 0.133 |
| NKD2 expression | 0.444 (0.202-0.973) | 0.043 | 0.328 (0.127-0.849) | 0.022 |
| WBC | 1.748 (0.991-3.083) | 0.054 | 2.489 (1.057-5.862) | 0.037 |
| FLT3-ITD mutation | 0.685 (0.272-1.727) | 0.423 | - | - |
| NPM1 mutation | 0.933 (0.418-2.086) | 0.867 | - | - |
| CEBPA mutation | 1.346 (0.603-3.004) | 0.468 | - | - |
| c-KIT mutation | 0.391 (0.054-2.837) | 0.353 | - | - |
| NRAS or KRAS mutation | 1.096 (0.434-2.769) | 0.847 | - | - |
| IDH1 or IDH2 mutation | 1.672 (0.809-3.455) | 0.165 | 7.559 (1.897-30.129) | 0.004 |
| DNMT3A mutation | 0.762 (0.302-1.921) | 0.564 | - | - |
Univariate and multivariate analyses of prognostic factors for leukemia-free survival in CN-AML patients.
| prognostic factors | Univariate analysis | Multivariate analysis | ||
|---|---|---|---|---|
| Hazard ratio (95% CI) | P value | Hazard ratio (95% CI) | P value | |
| age | 2.019 (1.111-3.671) | 0.021 | 2.086 (0.926-4.700) | 0.076 |
| NKD2 expression | 0.565 (0.264-1.209) | 0.141 | 0.404 (0.168-0.973) | 0.043 |
| WBC | 1.562 (0.879-2.778) | 0.129 | 2.280 (1.022-5.086) | 0.044 |
| FLT3-ITD mutation | 0.726 (0.288-1.829) | 0.497 | - | - |
| NPM1 mutation | 0.820 (0.368-1.827) | 0.628 | - | - |
| CEBPA mutation | 1.035 (0.465-2.303) | 0.933 | - | - |
| c-KIT mutation | 0.386 (0.053-2.800) | 0.346 | - | - |
| NRAS or KRAS mutation | 0.994 (0.394-2.506) | 0.990 | - | - |
| IDH1 or IDH2 mutation | 1.265 (0.613-2.609) | 0.525 | - | - |
| DNMT3A mutation | 0.821 (0.326-2.069) | 0.676 | - | - |
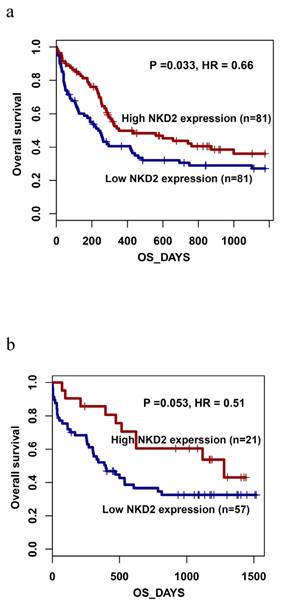
Furthermore, the prognostic impact of NKD2 expression was also confirmed by gene expression profiling (GEP) data (accession number GSE12417, http://www.ncbi.nlm.nih.gov/geo/) from two independent cohorts of adult CN-AML patients published by Metzeler et al using the online web tool Genomicscape (http://genomicscape.com/microarray/survival.php) [32]. Similarly, patients with low NKD2 expression showed shorter OS as compared to those with high NKD2 expression in both two cohorts (162 and 78 patients) (P=0.033 and 0.053, respectively, Fig. 8a and 8b).
Prognostic value of NKD2 expression using Gene expression profiling data (accession number GSE12417, http://www.ncbi.nlm.nih.gov/geo/) in CN-AML. a: data with 162 patients; b: data with 78 patients.
Surveillance of NKD2 expression in follow-up AML patients
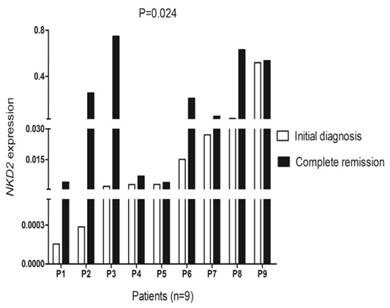
To further investigated whether levels of NKD2 factored in patients' response to therapy, we followed NKD2 expression of 9 patients with AML from the initial diagnosis to CR. Our study revealed that NKD2 showed significantly increased level in post-CR than initial diagnosis in follow-up AML patients (P=0.024, Fig 9).
Changes of NKD2 expression in follow-up AML patients (n=9) from the initial diagnosis to complete remission. White represents AML patients before therapy, black indicates complete remission after therapy.
Discussion
The activity of the Wnt pathway is controlled by extracellular and intracellular inhibitors mainly including secreted frizzled-related proteins (SFRPs), dickkopfs (DKK), SRY-box containing gene (SOX), and NKD family [19]. Frequent promoter hypermethylation of Wnt pathway inhibitor genes and their effect on gene expression have been revealed in malignant tumors [19]. Recently, accumulating evidence has revealed the direct role of NKD2 in tumorigenesis. Reduced NKD2 expression is found in osteosarcoma and has a significant role in driving tumor growth and metastasis [33]. NKD2 suppresses breast cancer cell proliferation both in vitro and in vivo and induced G1/S arrest and inhibits Wnt signaling in breast cancer cells [20]. In human gastric cancer, NKD2 restoration suppresses cell proliferation, colony formation, cell invasion and migration, induced G2/M phase arrest, and sensitizes cancer cells to docetaxel [34]. In addition, curcumin significantly upregulated the expression of NKD2 in SW620 colorectal cancer cells and inhibited the proliferation of colorectal cancer cells, resulting in the down-regulation of crucial markers in the Wnt signaling [35]. Zhi Li et al suggested that NKD2 is a direct target of miR-130b, and miR-130b regulated proliferation and apoptosis of osteosarcoma cells by targeting NKD2 and regulating the Wnt signaling [36]. Moreover, long noncoding RNA ZFAS1 repressed underlying targets KLF2 and NKD2 transcription to promote gastric cancer cells proliferation by interacting with EZH2 and LSD1/CoREST [37]. Our previous studies have disclosed that SOX17 and SRFP1/2 expression was down-regulated in AML and low SOX17 expression was associated with adverse prognosis in CN-AML patients [38-40]. Additionally, decreased SFRP1 expression was found more frequently in the less well differentiated subgroups of AML and is associated with NPM1 mutation in AML [39], whereas reduced SFRP2 expression was correlated with intermediate/poor karyotypes in AML [40]. As far as we know, this is the first report about NKD2 expression and its clinical significance in patients with AML.
In this study, we observed that down-regulation of NKD2 expression was a frequent event in AML patients, which indicates that NKD2 might act as tumor suppressor role as well in leukemogenesis. Obviously, function studies of NKD2 in leukemia are needed to support our results. Although no significant associations were observed between NKD2 expression and laboratory features as well as common gene mutations, survival analyses revealed that low NKD2 expression were associated with shorter OS and LFS among CN-AML patients. Notably, dynamic monitoring the level of NKD2 in 9 cases of patients illustrated that NKD2 were significantly increased from the initial diagnosis to CR by mentioned therapeutic protocols. In recent years, clinical significance of NKD2 expression has been increasingly investigated in various human cancers. Zhao et al demonstrated that decreased expression of NKD2 was associated with a significantly worse OS in human osteosarcoma tumors [33]. These results together indicated that NKD2 expression was a valuable predictor in assessing treatment outcome as well as status, and might serve as a criterion for the therapeutic evaluation in AML.
The regulation of NKD2 expression is associated with the methylation of its promoter [21]. We found that NKD2 methylation was a common event in AML patients and its role in silencing NKD2 expression was confirmed in leukemic cell lines THP1. In addition, our study further observed that NKD2 expression was negatively correlated with NKD2 expression in clinical samples. Recently, the clinical significance of NKD2 methylation has been also identified in several cancers [20,21,34]. In human breast cancer, NKD2 methylation is associated with higher tumor stages [20]. Moreover, in gastric cancer, methylation of NKD2 is significantly associated with the degree of cell differentiation, TNM stage, and distant metastasis and may serve as a poor prognostic predictor [34].
All in all, decreased NKD2 expression inactivated by promotor hypermethylation is a common event in AML and is associated with adverse outcome in CN-AML patients.
Acknowledgements
This work was supported by National Natural Science foundation of China under Grant (81270630, 81172592), Science and Technology Special Project in Clinical Medicine of Jiangsu Province under Grant (BL2012056), 333 Project of Jiangsu Province under Grant (BRA2013136), Six Talent Peaks Project in Jiangsu Province under Grant (2015-WSN115), Science and Technology Infrastructure Program of Zhenjiang under Grant (SS2012003), Social Development Foundation of Zhenjiang under Grant (SH2014086, SH2014044, SH2015058), Clinical Medical Science, Development Foundation of Jiangsu University under Grant (JLY20140018), Key Medical Talent Program of Zhenjiang City.
Competing Interests
The authors have declared that no competing interest exists.
References
1. Estey E, Döhner H. Acute myeloid leukaemia. Lancet. 2006;368:1894-907
2. Smith M, Barnett M, Bassan R. et al. Adult acute myeloid leukaemia. Crit Rev Oncol Hematol. 2004;50:197-222
3. Zhou JD, Yang L, Zhu XW. et al. Clinical significance of up-regulated ID1 expression in Chinese de novo acute myeloid leukemia. Int J Clin Exp Pathol. 2015;8:5336-44
4. Grimwade D. The clinical significance of cytogenetic abnormalities in acute myeloid leukaemia. Best Pract Res Clin Haematol. 2001;14:497-529
5. Byrd JC, Mrózek K, Dodge RK. et al. Pretreatment cytogenetic abnormalities are predictive of induction success, cumulative incidence of relapse, and overall survival in adult patients with de novo acute myeloid leukemia: Results from Cancer and Leukemia Group B (CALGB 8461). Blood. 2002;100:4325-36
6. Rowley JD. Chromosomal translocations: revisited yet again. Blood. 2008;112:2183-9
7. Mrozek K, Heerema NA, Bloomfield CD. Cytogenetics in acute leukemia. Blood Rev. 2004;18:115-36
8. Gregory TK, Wald D, Chen Y. et al. Molecular prognostic markers for adult acute myeloid leukemia with normal cytogenetics. J Hematol Oncol. 2009;2:23
9. Vardiman JW, Thiele J, Arber DA. et al. The 2008 revision of the World Health Organization (WHO) classification of myeloid neoplasms and acute leukemia: rationale and important changes. Blood. 2009;114:937-51
10. Gulley ML, Shea TC, Fedoriw Y. Genetic tests to evaluate prognosis and predict therapeutic response in acute myeloid leukemia. J Mol Diagn. 2010;12:3-16
11. Klaus A, Birchmeier W. Wnt signalling and its impact on development and cancer. Nat Rev Cancer. 2008;8:387-98
12. Logan CY, Nusse R. The Wnt signaling pathway in development and disease. Annu Rev Cell Dev Biol. 2004;20:781-810
13. Ysebaert L, Chicanne G, Demur C. et al. Expression of beta-catenin by acute myeloid leukemia cells predicts enhanced clonogenic capacities and poor prognosis. Leukemia. 2006;20:1211-6
14. Wang Y, Krivtsov AV, Sinha AU. et al. The Wnt/beta-catenin pathway is required for the development of leukemia stem cells in AML. Science. 2010;327:1650-3
15. Metzeler KH, Heilmeier B, Edmaier KE. et al. High expression of lymphoid enhancer-binding factor-1 (LEF1) is a novel favorable prognostic factor in cytogenetically normal acute myeloid leukemia. Blood. 2012;120:2118-26
16. Fu Y, Zhu H, Wu W. et al. Clinical significance of lymphoid enhancer-binding factor 1 expression in acute myeloid leukemia. Leuk Lymphoma. 2014;55:371-7
17. Barker N, Clevers H. Mining the Wnt pathway for cancer therapeutics. Nat Rev Drug Discov. 2006;5:997-1014
18. Hu T, Krezel AM, Li C. et al. Structural studies of human Naked2: a biologically active intrinsically unstructured protein. Biochemical and biophysical research communications. 2006;350:911-5
19. Götze S, Wolter M, Reifenberger G. et al. Frequent promoter hypermethylation of Wnt pathway inhibitor genes in malignant astrocytic gliomas. Int J Cancer. 2010;126:2584-93
20. Dong Y, Cao B, Zhang M. et al. Epigenetic silencing of NKD2, a major component of Wnt signaling, promotes breast cancer growth. Oncotarget. 2015;6:22126-38
21. Jia Y, Cao B, Yang Y. et al. Silencing NKD2 by promoter region hypermethylation promotes gastric cancer invasion and metastasis by up-regulating SOX18 in human gastric cancer. Oncotarget. 2015;6:33470-85
22. Feng W, Shen L, Wen S. et al. Correlation between CpG methylation profiles and hormone receptor status in breast cancers. Breast Cancer Res. 2007;9:R57
23. Swerdlow SH CE, Harris NL, Jaffe ES. et al. WHO classification of tumours of haematopoietic and lymphoid tissues. France: IARC Press. 2008
24. Li Y, Lin J, Yang J. et al. Overexpressed let-7a-3 is associated with poor outcome in acute myeloid leukemia. Leuk Res. 2013;37:1642-7
25. Zhou JD, Yang L, Zhang YY. et al. Overexpression of BAALC: clinical significance in Chinese de novo acute myeloid leukemia. Med Oncol. 2015;32:386
26. Zhou JD, Yao DM, Zhang YY. et al. GPX3 hypermethylation serves as an independent prognostic biomarker in non-M3 acute myeloid leukemia. Am J Cancer Res. 2015;5:1786-94
27. Lin J, Yao DM, Qian J. et al. Recurrent DNMT3A R882 muta-tions in Chinese patients with acute myeloid leukemia and myelodysplastic syndrome. PLoS One. 2011;6:e26906
28. Lin J, Yao DM, Qian J. et al. IDH1 and IDH2 mutationanalysis in Chinese patients with acute myeloid leukemia and myelodysplastic syndrome. Ann Hematol. 2012;91:519-25
29. Yang X, Qian J, Sun A. et al. RAS mutation analysis in alarge cohort of Chinese patients with acute myeloid leukemia. Clin Biochem. 2013;46:579-83
30. Qian J, Yao DM, Lin J. et al. U2AF1 Mutations in Chinese patients with acute myeloid leukemia and myelodysplastic syndrome. PloS One. 2012;7:e45760
31. Wen XM, Lin J, Yang J. et al. Double CEBPA mutations are prognostically favorable in non-M3 acute myeloid leukemia patients with wild-type NPM1 and FLT3-ITD. Int J Clin Exp Pathol. 2014;7:6832-40
32. Metzeler KH, Hummel M, Bloomfield CD. et al. An 86-probe-set gene-expression signature predicts survival in cytogenetically normal acute myeloid leukemia. Blood. 2008;112:4193-201
33. Zhao S, Kurenbekova L, Gao Y. et al. NKD2, a negative regulator of Wnt signaling, suppresses tumor growth and metastasis in osteosarcoma. Oncogene. 2015;34:5069-79
34. Jia Y, Cao B, Yang Y. et al. Silencing NKD2 by promoter region hypermethylation promotes gastric cancer invasion and metastasis by up-regulating SOX18 in human gastric cancer. Oncotarget. 2015;6:33470-85
35. Zhang Z, Chen H, Xu C. et al. Curcumin inhibits tumor epithelial-mesenchymal transition by downregulating the Wnt signaling pathway and upregulating NKD2 expression in colon cancer cells. Oncol Rep. 2016May;35(5):2615-23
36. Li Z, Li Y, Wang N. et al. miR-130b targets NKD2 and regulates the Wnt signaling to promote proliferation and inhibit apoptosis in osteosarcoma cells. Biochem Biophys Res Commun. 2016Mar18;471(4):479-85
37. Nie F, Yu X, Huang M. et al. Long noncoding RNA ZFAS1 promotes gastric cancer cells proliferation by epigenetically repressing KLF2 and NKD2 expression. Oncotarget. 2016 May 26
38. Tang CY, Lin J, Qian W. et al. Low SOX17 expression: prognostic significance in de novo acute myeloid leukemia with normal cytogenetics. Clin Chem Lab Med. 2014;52:1843-50
39. An C, Guo H, Wen XM. et al. Clinical significance of reduced SFRP1 expression in acute myeloid leukemia. Leuk Lymphoma. 2015;56:2056-60
40. Guo H, Lin J, Wen XM. et al. Decreased SFRP2 expression is associated with intermediate and poor karyotypes in de novo acute myeloid leukemia. Int J Clin Exp Pathol. 2014;7:4695-703
Author contact
![]() Corresponding authors: Jun Qian, M.D., Department of Hematology, Affiliated People's Hospital of Jiangsu University, 8 Dianli Rd., 212002 Zhenjiang, People's Republic of China. Fax: +86.511.85234387; E-mail address: qianjun0007com. Jiang Lin, Ph.D., Laboratory Center, Affiliated People's Hospital of Jiangsu University, 8 Dianli Rd., 212002 Zhenjiang, People's Republic of China. Fax: +86.511.85234387; E-mail address: linjiangmailcom.
Corresponding authors: Jun Qian, M.D., Department of Hematology, Affiliated People's Hospital of Jiangsu University, 8 Dianli Rd., 212002 Zhenjiang, People's Republic of China. Fax: +86.511.85234387; E-mail address: qianjun0007com. Jiang Lin, Ph.D., Laboratory Center, Affiliated People's Hospital of Jiangsu University, 8 Dianli Rd., 212002 Zhenjiang, People's Republic of China. Fax: +86.511.85234387; E-mail address: linjiangmailcom.