Impact Factor ISSN: 1837-9664

 Global reach, higher impact
J Cancer 2016; 7(10):1265-1272. doi:10.7150/jca.15074 This issue Cite
Research Paper
Use of Plasma Metabolomics to Identify Diagnostic Biomarkers for Early Stage Epithelial Ovarian Cancer
Lijun Fan1,2, Mingzhu Yin3, Chaofu Ke2, Tingting Ge3, Guangming Zhang2, Wang Zhang2, Xiaohua Zhou4, Ge Lou3 ![]() , Kang Li2
, Kang Li2 ![]()
1. National Center for Endemic Disease Control, Harbin Medical University, Harbin, China;
2. Department of Epidemiology and Biostatistics, Harbin Medical University, Harbin, China;
3. Department of Gynecology Oncology, The Third Affiliated Hospital of Harbin Medical University, Harbin, China;
4. Department of Biostatistics, School of Public Health and Community Medicine, University of Washington, Seattle, USA.
Received 2016-1-25; Accepted 2016-4-26; Published 2016-6-23
Abstract
The early detection of ovarian carcinoma is difficult due to the absence of recognizable physical symptoms and a lack of sensitive screening methods. The currently available biomarkers (such as CA125 and HE4) are insufficiently reliable to distinguish early stage (I/II) epithelial ovarian cancer (EOC) patients from normal individuals because they possess a relatively poor sensitivity and specificity. To evaluate the application of metabolomics to biomarker discovery in the early stages of epithelial ovarian cancer (EOC), plasma samples from 21 early stage EOC patients and 31 healthy controls were analyzed with ultra-performance liquid chromatography quadrupole time-of-flight mass spectrometry (UPLC/Q-Tof/MS) in conjunction with multivariate statistical analysis. Eighteen metabolites, including lysophospholipids, 2-piperidone and MG (18:2), were found to be disturbed in early stage EOC with satisfactory diagnostic accuracy (AUC=0.920). These biomarkers were specifically validated in the EOC nude mouse model, and five of the biomarkers (lysophospholipids, adrenoyl ethanolamide et al.) were highly suspected of being associated with EOC because they were differentially expressed with the same tendency in the EOC nude mice versus normal controls. In conclusion, the selected metabolic biomarkers have considerable utility and significant potential for diagnosing early ovarian cancer and investigating its underlying mechanisms.
Keywords: metabolomics, epithelial ovarian cancer, biomarkers, plasma, diagnosis.
Introduction
Ovarian cancer is a common cause of cancer death and the most lethal gynecological cancer. It is estimated that in 2015 in the United States, 21,290 women will have been diagnosed with ovarian cancer and 14,180 of these women will die from the disease [1]. The high mortality rate of ovarian carcinoma is due to the lack of a screening strategy to detect early-stage disease, when it usually arises and initially progresses without well-defined clinical symptoms [2]. Certain cancer biomarkers, such as the cancer antigen 125 (CA125), carcino-embryonic antigen (CEA) and human epididymis protein 4 (HE4), have been clinically used for the diagnosis of ovarian cancer, but they have shown relatively poor sensitivity and specificity [3-5], especially in early diagnosis. Thus, studying the specific diagnostic biomarkers and pathogenesis of this disease is of great importance.
Metabolomics is a promising technology with a high sensitivity that possesses the ability to quantitatively measure the entire composition of metabolites in a given biological specimen of biofluids and tissues [6, 7]. The application of metabolomics in cancer studies has shown great potential for the diagnostic or predictive interpretation of cancer status for cancers such as colon cancer, prostate cancer, kidney cancer or breast cancers [8-12]. Recently, metabolic profiling technology has been used to analyze significant metabolic variations in biofluid specimens of epithelial ovarian cancer (EOC) patients; this process revealed a significantly perturbed expression of amino acids, fatty acids, carboxylic acids, and components of the tricarboxylic acid cycle and urea cycle in EOC patients compared with normal controls [13-18]. However, during the early stages (stage I/II) of EOC, studies have been very limited due to the difficulty of collecting samples. Garcia et al. applied NMR spectroscopy-based metabolomics for serum to discriminate ovarian cancer patients at early stages from healthy controls [16]. However, the metabolic profile of plasma associated with early EOC morbidity remains poorly understood and is of particular interest because its study would provide global pathophysiological information. To address this challenge, we explored plasma metabolomics based on the highly sensitive ultra-performance liquid chromatography quadrupole time-of-flight mass spectrometry (UPLC/Q-Tof/MS) to investigate early EOC.
In this study, we report our investigation of plasma from healthy controls and patients suffering from early stage EOC, employing UPLC/Q-Tof/MS in conjunction with pattern recognition techniques. The purpose of this comprehensive metabolic analysis was to identify diagnostic metabolic biomarkers for the early stages of EOC and explore the possible mechanisms of cancer development and progression. Additionally, to compare and verify the important metabolic alterations, a targeted analysis of the plasma from 17 nude mice was performed.
Materials and Methods
Sample collection
Plasma samples of early-stage EOC patients and controls were obtained from the Harbin Medical University Cancer Hospital after approval by the Institutional Review Board; and each participant signed informed consent. Controls comprised age-matched participants who had no ovarian diseases or evidence of other diseases, such as other cancers, diabetes mellitus or other metabolic diseases. All participants were required to fast and avoid medicine and alcohol for 12 hours prior to sampling. Then, 5 mL of whole blood was collected by venipuncture into evacuated blood collection tubes containing EDTA-K3 (sodium dihydrogen phosphate). One hour after centrifugation, the plasma was collected, and 400 μL aliquots of each sample were stored at -80°C until use.
The xenograft mouse model
The epithelial ovarian cancer cell line SKOV3 was obtained from the Third Affiliated Hospital of Harbin Medical University. The cell lines were maintained in RPMI 1640 medium supplemented with 10% fetal bovine serum (FBS), penicillin (100 U/mL) and streptomycin (100 g/mL) at 37°C in a humidified 5% CO2 atmosphere. Female nude mice (20±2 g) were purchased from the Shanghai SLAC Laboratory Animal Company (Shanghai, China). All mice were allowed to acclimatize in communal plastic cages for seven days and then in metabolism cages for three days before treatment. Temperature and humidity were regulated at 22±2°C and 45±15%, respectively. A cycle of 12 h light/12 h dark was established. Food and drinking water were provided ad libitum. All experimental procedures were conducted in accordance with the institutional guidelines for the care and use of laboratory animals of Harbin Medical University and conformed to the National Research Council's Guide for the Care and Use of Laboratory Animals. Human SKOV-3 cells were grown in RPMI medium and mixed with matrigel (total 100 ll/106 tumor cells), and 0.2 mL of SKOV-3 was injected into the right backs of the nude mice for the ovarian nude xenografted models. The mice were fed ad libitum and monitored daily for signs of distress. The tumor volumes were measured by calipers. The tumour volume reached approximately 5 mm in diameter after seven days, the xenograft models were built. Blood samples were collected on the second day after building the xenograft models. Plasma was collected, and the aliquots of each sample were stored at -80°C after centrifugation.
Sample preparation
In the laboratory, the plasma samples were thawed in a 4°C water bath. A 300 µL aliquot (100 µL for the mice) was injected into a vial and vortexed for 30 s before being extracted with five rounds of methanol (1500 µL for the human plasma and 500 µL for the mouse plasma). The mixture was vortexed for 2 min. After being incubated for 10 min at 20°C, the mixtures were centrifuged at 14,000 g for 10 min at 4°C. An aliquot of supernatant was transferred to a sampling vial for nitrogen drying at 37°C. A 300 µL aliquot of acetonitrile/water (3:1) was added, and the mixture was vortexed for 60 s. After being kept at 30°C for 10 min, the supernatant was transferred into the sampling vial to await UPLC/QTOF/MS analysis.
The parameters for chromatography and MS spectrometry
A 2 µL aliquot of the pre-treated sample was injected into a 100 mm × 2.1 mm, 1.7 µm BEH C18 column (Waters, Milford, USA) maintained at 35°C using an Acquity ultra-performance liquid chromatography system (Waters, Milford, USA). Samples from five controls and five EOC patients were alternately run through the system. A gradient consisting of two solutions, A (water with 0.1% formic acid) and B (acetonitrile with 0.1% formic acid), was used, and the column was eluted with a linear gradient of 2-20% B for 0-1.5 min, 20-70% B for 1.5-6 min and 70-98% B for 6-10 min and held for 2 min. The gradient then returned to 40% B. Mass spectrometry experiments were primarily performed on a Waters Micromass Q-TOF (Waters, Manchester, U.K.). In the tandem mass spectrometry (MS/MS) experiments, argon was employed as the collision gas, and the collision energy was altered between 10 and 30 eV based on their chemical stability.
The corresponding experimental procedures and the parameters for chromatography and MS spectrometry analysis of samples from the nude mice were the same as those used for the human plasma.
Data preprocessing and annotation
First, the ESI+ raw data were transformed to NetCDF files by Databridge (Waters, Manchester, U.K.). Then, these CDF files were imported to the xcms package for preprocessing [19, 20]. The full width at half-maximum was set to 10, and the retention time window was set to 10. All other parameters were set at their defaults. A matrix containing the peaks with retention times, m/z values and corresponding peak areas was listed. Then, the R package CAMERA was used for the annotation of the isotope peaks, adducts and fragments in the peak lists [21]. Normalization to total peak area for each sample was performed before the statistical analysis.
The signals of eight quality control samples (mixtures of plasma samples) were used to describe the analytical characteristics of the metabolic profiling of the UPLC/Q-Tof/MS system. The RSD values of the mean, median and 95% peak areas were 9%, 7% and 1.7%-24%, respectively.
Statistical analyses
After preprocessing, the human data were imported to SIMCA-p 11.5 (Umetrics AB, Umea, Sweden). Then, both the unsupervised method (PCA) and supervised method (OPLS-DA) were employed to reveal the global metabolic changes of early stage EOCs and healthy controls, and corresponding VIP values were also calculated in the OPLS-DA model. A validation plot was used to assess the validity of the OPLS-DA model by comparing the goodness of fit (R2 and Q2) of the PLS-DA models with 100 Y-permutated models. Meanwhile, a two-sided Cochran and Cox test was performed to determine the significance of each metabolite. A differential metabolite was selected when the value of VIP was more than 1.0 and the p value was less than 0.001 for human data. The differential metabolites were then validated in the mice models by a two-sided Cochran and Cox test. Statistical analysis was performed on the R platform, with the exception of PCA and OPLS-DA, which were performed on SIMCA-p.
Identification of metabolites
The fragmentation patterns of selected metabolites and their structure information were obtained from MS/MS experiments performed on a Waters Q-TOF micro MS. Metabolite identification was conducted based on the retention behavior, mass assignments, MS/MS product ion patterns, online database queries and confirmation with standards. The mass tolerance between the measured M/Z values and exact mass of the interested components was set to within 30 ppm. The MS/MS product ion spectrum of selected metabolites was matched with the structural information of the metabolites (with the same M/Z) obtained from the HMDB (www.hmdb.ca) [22], METLIN (http://metlin.scripps.edu/) [23] and KEGG (http://www.genome.jp/kegg/) [24] databases.
Results
Metabolic profiles between early-stage EOC patients and controls
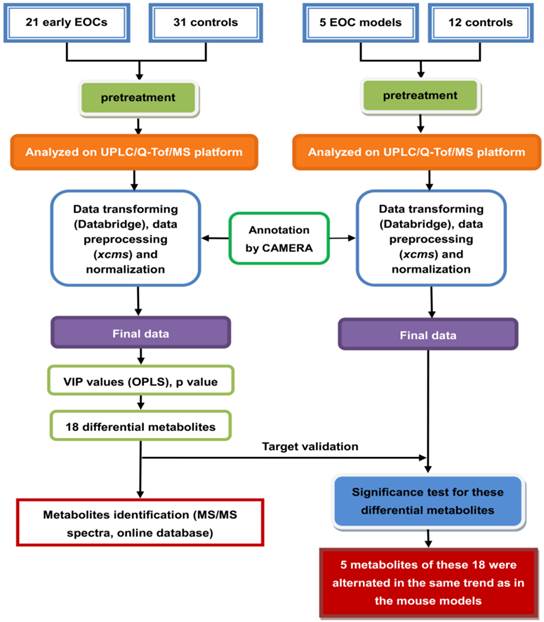
The overall workflow of the plasma metabolomics analysis in this study is summarized in Figure 1, and the characteristics of the participants are shown in Table 1.
An overview of the workflow of plasma metabolomics for early stage (I/II) epithelial ovarian cancer (EOC) patients and controls using ultra-performance liquid chromatography quadrupole time-of-flight mass spectrometry (UPLC/Q-Tof/MS).
Demographic and clinical chemistry characteristics of patients with epithelial ovarian cancer (EOC) and controls.
| Characteristics | EOCs(stage I/II) | Controls |
|---|---|---|
| No. of subjects | 21 | 31 |
| Age | ||
| median | 53.09 | 53.75 |
| range | 30.90~72.10 | 28.00~74.30 |
| Menopause | ||
| pre-menopause | 13 | 14 |
| post-menopause | 8 | 15 |
| CA125(mean) | 839.35 | 15.95 |
| FIGO Stage | ||
| stage I | 7 | - |
| stage II | 14 | - |
| Histology type | ||
| serous adenocarcinoma | 7 | - |
| mucoid adenocarcinoma | 1 | - |
| endometrioid adenocarcinoma | 2 | - |
| others | 11 | - |
| Histopathological differentiation | ||
| well differentiated | 1 | - |
| moderately differentiated | 3 | - |
| poorly differentiated | 7 | - |
| unknown | 10 | - |
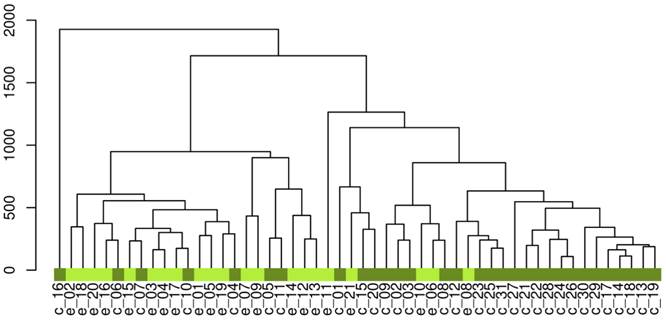
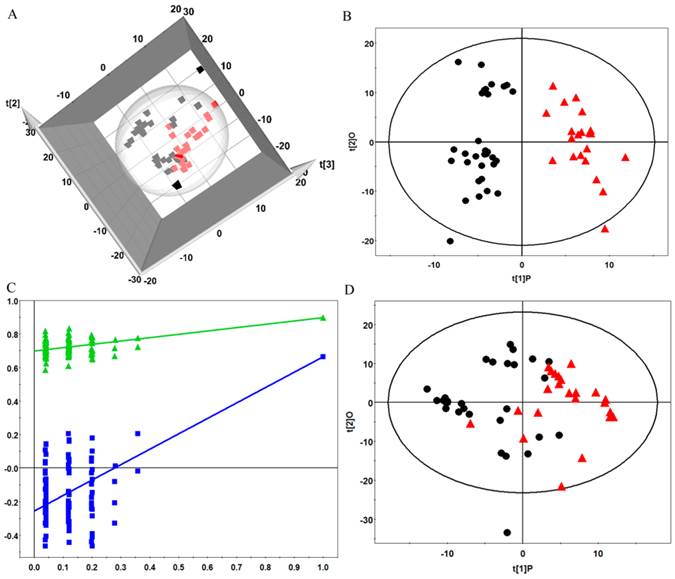
After the data processing, the final dataset consisted of 530 variables. The unsupervised hierarchical clustering of the raw data separated the samples into two main groups (Figure 2).To reveal the global metabolic changes in early EOC patients and healthy controls and locate the outliers, principal component analysis (PCA) was used. The PCA scores plot showed a considerable separation tendency between EOC patients and controls (seven components, with R2X=0.693, Q2cum=0.431, Figure 3A). To specify cancer-related metabolic variations, an orthogonal partial least-squares discriminate analysis (OPLS-DA) model was constructed with a satisfactory predictive ability using one predictive component and four orthogonal components (R2Ycu=0.899, Q2Ycum=0.597, Figure 3B). The validation plot strongly indicated the validity of our classification model because the Q2 regression line (shown in blue) has a negative intercept, and all of the permuted R2-values (shown in green) on the left are lower than the original point of the R2 value on the right (Figure 3C). Additionally, we attempted to stratify patients with different CA125 levels using metabolomics data, but no valid model of metabolic profile differentiation could be established between the subjects with high CA125 (≥35 ng/mL) and low CA125 (<35 ng/mL) levels (Figure 3D).
The hierarchical clustering of the raw data. 'e' represents epithelial ovarian cancer patients, 'c' represents controls.
(A) Principle component analysis (PCA) plots of factor scores for the first three principal components (t[1], t[2], t[3]) showing the considerable separation achieved between EOC plasma samples (red box) and healthy premenopausal controls (black box); (B) Orthogonal partial least-squares discriminate analysis(OPLS-DA) scores plot for the top two components that differentiate EOC patients (red triangle) and controls (black dot); (C) the validation plot obtained from 100 permutation tests with R2(green triangle) and Q2(blue box); and (D) OPLS-DA scores plot for the subjects with high CA125 levels (red triangle) and low CA125 levels (black dot).
Based on the variable importance in the projection (VIP) values and p values (VIP>1 and p<0.001), a total of 52 metabolites were selected as biomarker candidates for differentiating early stage EOC patients from normal controls. Following to the annotation of peaks by CAMERA, 22 metabolites were obtained, and four metabolites were further deleted due to their high relative standard deviations (RSDs, RSD>30%). As a consequence, 18 metabolites were obtained and identified as our candidate biomarkers (Table 2). Among these metabolites, five were studied by their available mass spectrogram. Of these five metabolites, LysoPC16:0 and 2-piperidone were verified by reference standards. Nine other metabolites were tentatively identified through a database search and the literature researching. To further interpret the biological significance associated with EOC morbidity, we applied the Kyoto Encyclopedia of Genes and Genomes (KEGG) database to link lysophospholipids (LysoPCs) and MG to metabolic pathways.
Differential metabolites in plasma to discriminate the early-stage epithelial ovarian cancer (EOC) patients and controls.
| VAR | m/z | RT (s) | VIP | p value | EOC | %RSD | p value1 | Formula | Metabolites |
|---|---|---|---|---|---|---|---|---|---|
| V14 | 100.0768 | 122.19 | 1.45 | 0.000539 | ↓ | 3.34 | - | C5H9NO | 2-Piperidinone 2 |
| V115 | 246.0135 | 293.79 | 1.98 | 5.57E-05 | ↓ | 22.16 | 0.4443 | C10H9NO5 | 4-(2-Aminophenyl)-2, 4-dioxobutanoic acid 3,5 |
| V198 | 324.2558 | 215.09 | 2.01 | 6.02E-05 | ↓ | - | 0.9784 | C19H35NO4 | trans-2-Dodecenoylcarnitine 4,5 |
| V211 | 336.3270 | 578.07 | 2.13 | 0.000370 | ↑ | 13.96 | - | C22H41NO | Pipericine5 |
| V214 | 337.2745 | 414.8 | 1.34 | 0.000700 | ↓ | 2.09 | 0.0920 | C21H38O4 | MG (18:2) 2,4 |
| V254 | 365.1210 | 189.44 | 2.15 | 5.41E-05 | ↓ | 2.72 | 0.2154 | C16H22O8 | Coniferin 3,5 |
| V271 | 376.3210 | 584.87 | 2.15 | 0.000201 | ↑ | - | 0.0035 | C24H41NO2 | Adrenoyl Ethanolamide5 |
| V285 | 395.2257 | 629.24 | 1.84 | 0.000971 | ↑ | 14.48 | 0.3476 | UNKNOW | UNKNOW |
| V293 | 402.3961 | 460.79 | 2.26 | 2.27E-05 | ↑ | 14.96 | 0.6628 | UNKNOW | UNKNOW |
| V328 | 436.2870 | 439.95 | 1.49 | 0.000203 | ↓ | 4.85 | 0.0140 | C27H54NO7P | LysoPE(16:0)5 |
| V358 | 468.3094 | 380.46 | 1.21 | 0.000305 | ↓ | 3.12 | 0.0091 | C22H46NO7P | LysoPC(14:0) 2 |
| V387 | 496.3210 | 442.27 | 1.98 | 0.000282 | ↑ | 0.56 | 0.2394 | C24H50NO7P | LysoPC(16:0) 2 |
| V391 | 500.2947 | 383.30 | 2.04 | 2.82E-05 | ↓ | 9.26 | - | C26H45NO6S | Taurochenodesoxycholic acid |
| V406 | 510.3568 | 477.70 | 1.87 | 0.000204 | ↓ | 13.65 | 0.0589 | C25H52NO7P | LysoPC(17:0) 2 |
| V421 | 518.3240 | 383.69 | 1.64 | 0.000845 | ↓ | 9.27 | 2.87E-05 | C26H48NO7P | LysoPC(18:3) 2 |
| V434 | 526.3000 | 409.55 | 1.94 | 7.65E-05 | ↓ | 7.20 | 0.0710 | C27H44NO7P | LysoPE(22:6)5 |
| V461 | 548.2875 | 411.48 | 1.76 | 0.000308 | ↓ | 13.74 | 0.3068 | UNKNOW | UNKNOW |
| V516 | 683.5415 | 587.21 | 1.40 | 0.000263 | ↑ | - | 0.0103 | UNKNOW | UNKNOW |
m/z: mass to charge ratio; RT: retention time; VIP: variable importance in the projection; EOC: epithelial ovarian cancer; RSD: relative standard deviation.
1 represents the p value in mice;
2 represents that the metabolite was verified by the reference compound;
3representsadduct ion of the metabolite;
4represents fragment ion;
5 represents the metabolite was verified by the available mass spectrogram.
Target analysis of discriminant metabolites for validation of potential biomarkers in the mice with SKOV-3 ovarian cancer xenograft and controls
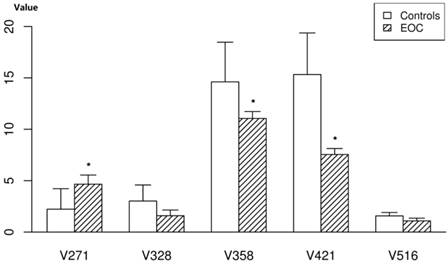
To evaluate the changes of these 18 compounds in the mouse samples, we measured the compounds in nude mouse plasma. Of these 18 selected potential biomarkers, adrenoyl ethanolamide, LysoPCs, LysoPE and one unknown compound were found to be present in significant levels in the plasma of nude mice, with similar tendencies toward altered expression (Figure 4).The 2-piperidone verified by the reference standard was not found in the plasma of nude mice; pipericine and taurochenodesoxycholic acid were also not found. The other metabolites (MG18:2 and others) were present at insignificant levels in the mice.
The relative quantity of the five potential biomarkers in the plasma of nude mice. Data represent the means and standard deviation of the metabolites in the EOC nude mice and controls. * represents p value of <0.001.
Discussions
We employed plasma metabolomics with UPLC/Q-Tof/MS to distinguish early stage EOC patients from healthy controls and then validated the discriminant metabolites in the SKOV-3 xenograft models. A good separation between early stage EOC patients and healthy controls was achieved, and 18 up- or down-regulated metabolites were identified between the two groups. In addition, five biomarkers (lysophospholipids, adrenoyl ethanolamide et al.) were differentially expressed with the same tendency in the EOC nude mice versus normal controls.
Our study further confirmed that metabolomics can be used to differentiate early stage EOC patients from healthy controls through plasma samples analyzed by UPLC/Q-Tof/MS. The biomarkers we selected showed great potential for improving the diagnostic accuracy of CA125 (AUC values of CA125: 0.887; 18 metabolites: 0.897; combination of 18metabolites and CA125: 0.935).
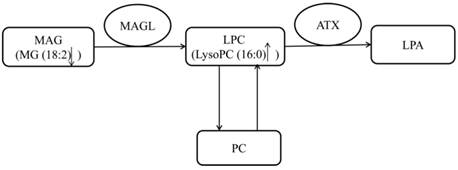
The metabolism of lysophospholipids (V358, V387, V406 and V421) was disturbed in both human early stage EOC patients and EOC nude mice. Lysophospholipids have been suggested to be correlated with cell growth, proliferation and metastasis [25], and several studies have confirmed their abnormal metabolism in EOC patients [13, 15]. Very interestingly, we observed that LysoPC16:0 was increased in early-stage EOC patients, while other LysoPCs were decreased. This observation might indicate that LysoPC16:0 plays a different role in early stage EOC. It is known that LysoPC16:0 is involved in the metabolism of phosphatidylcholine (PC) and can contribute to the production of PLA 16:0 through autotaxin (ATX) [26]. An enhanced PC metabolism has been observed in human epithelial ovarian cancer cells [27]. Additionally, lysophosphatidic acid (LPA) has been reported to contribute to the initiation and progression of ovarian cancer [28]. Therefore, the elevation of plasma LysoPC16:0 might play an important role in the development of ovarian cancer. MG 18:2, a type of monoacylglycerol (MAG), was down-regulated in the early stages of EOC. The metabolism of MAGs is in contact with lysophospholipids through monoacylglycerol lipase (MAGL), which breaks down MAGs [29]. It has been reported that the MAGL is highly expressed in aggressive human ovarian cancer cells and regulates a fatty acid network involving certain lysophospholipids that promote cancer pathogenesis [29]. The reduced level of MAG accompanied by the elevated lysophospholipids in the early stages of EOC observed in our study might indicate the disturbance of this pathway from MAGs to lysophospholipids mediated by MAGL in early-stage ovarian patients (Figure 5). Other LysoPCs and LysoPEs were also found to be disturbed in several diseases such as diabetes and cerebrovascular disease. Studies have reported that LysoPCs and LysoPEs were shown to be up-regulated in diabetes and cerebrovascular disease [30, 31], while our study demonstrated that LysoPC (14:0), LysoPC (17:0), LysoPC (18:3), LysoPE (16:0) and LysoPE (22:6) were all down-regulated in EOC patients.
The pathway of LysoPC16:0.
A significantly decreased level of 2-piperidone (V14) was observed in the plasma samples of early-stage EOC patients compared with healthy controls. Notably, we reported in a previous study that 2-piperidone was found to be down-regulated in EOC patients compared with patients with benign ovarian tumors [15]. The metabolism of 2-piperidone might be disrupted in the early stages of EOC, and 2-piperidone has the potential of serving as a new biomarker of early ovarian cancer. However, 2-piperidone was not found in the nude mouse models, which indicates that it might be a metabolite that is unique to humans. And this metabolite was not reported disturbed in other diseases until now, which indicated that it might be a specific biomarker for ovarian cancer.
Adrenoylethanolamide (V271), was supposed to be a type of N-acylethanolamine (NAE), was detected as being an up-regulated component in the plasma samples of both the EOC patients and nude mice. NAEs are released from N-acylphosphatidylethanolamine in response to a variety of stimuli [32, 33]. In our results, the accumulation of adrenoylethanolamide in the early stages of EOC might be attributed to the stimulus of neoformation. 4-(2-Aminophenyl)-2,4-dioxobutanoic acid (V115) is a substrate for mitochondrial kynurenine/alpha-aminoadipate aminotransferase. Kynurenine plays an important role in cancer development and can suppress antitumor immune responses while promoting tumor cell survival and motility [34]. In our present study, 4-(2-Aminophenyl)-2,4-dioxobutanoic acid was down-regulated, suggesting that the decomposition of kynurenine would be reduced. Moreover, four metabolites (V285, V293, V461 and V516) were not identified but did have some linkage with tumor mortality. These metabolites should be studied in further research. Remarkably, accelerated L-tryptophan degradation has been observed in the blood of EOC patients compared with the blood of patients with benign ovarian tumors and healthy controls [13, 15, 35]. However, in our study, L-tryptophan did not differ between early stage EOC patients and normal controls (VIP=0.74, p=0.92). This divergence shows that L-tryptophan metabolism was not yet changed in the early stage EOC patients we examined.
In summary, our results demonstrate the potential of the plasma metabolomics strategy as a complementary diagnostic tool for EOC. Several important metabolites, including LysoPCs in different pathways, were disturbed in association with EOC morbidity in humans; some of these changes associated with morbidity were also detected in nude mice. These biomarkers possess great potential in diagnosing early stage EOC; additionally, these biomarkers may be useful for investigating the underlying mechanisms of EOC in the future. There are also several limitations to the current study. First, not all of the differential metabolites were identified and validated due to continually improving metabolite identification capabilities. Second, further investigations consisting of larger sample sizes and many subtype cancers are needed in our future work. Third, only one type of mouse model was used; multiple models should be studied in further research. Additionally, multiple controls and different geographical locations will be added in the future.
Acknowledgements
This work was supported by a grant from the National Science Foundation of China (NSFC 81473072, NSFC 81472028).
Competing Interests
The authors have declared that no competing interest exists.
References
1. Siegel RL, Miller KD, Jemal A. Cancer statistics, 2015. CA Cancer J Clin. 2015;65(1):5-29
2. Teneriello MG, Park RC. Early detection of ovarian cancer. CA Cancer J Clin. 1995;45(2):71-87
3. Jacobs IJ, Menon U. Progress and challenges in screening for early detection of ovarian cancer. Mol Cell Proteomics. 2004;3(4):355-66
4. Williams TI, Toups KL, Saggese DA. et al. Epithelial ovarian cancer: disease etiology, treatment, detection, and investigational gene, metabolite, and protein biomarkers. J Proteome Res. 2007;6(8):2936-62
5. Moore RG, McMeekin DS, Brown AK. et al. A novel multiple marker bioassay utilizing HE4 and CA125 for the prediction of ovarian cancer in patients with a pelvic mass. Gynecol Oncol. 2009;112(1):40-6
6. Vitzthum F, Behrens F, Anderson NL. et al. Proteomics: from basic research to diagnostic application. A review of requirements & needs. J Proteome Res. 2005;4(4):1086-97
7. Gowda GA, Zhang S, Gu H. et al. Metabolomics-based methods for early disease diagnostics. Expert Rev Mol Diagn. 2008;8(5):617-33
8. Jain M, Nilsson R, Sharma S. et al. Metabolite profiling identifies a key role for glycine in rapid cancer cell proliferation. Science. 2012;336(6084):1040-4
9. Sreekumar A, Poisson LM, Rajendiran TM. et al. Metabolomic profiles delineate potential role for sarcosine in prostate cancer progression. Nature. 2009;457(7231):910-4
10. Kim K, Aronov P, Zakharkin SO. et al. Urine metabolomics analysis for kidney cancer detection and biomarker discovery. Mol Cell Proteomics. 2009;8(3):558-70
11. Oakman C, Tenori L, Claudino WM. et al. Identification of a serum-detectable metabolomic fingerprint potentially correlated with the presence of micrometastatic disease in early breast cancer patients at varying risks of disease relapse by traditional prognostic methods. Ann Oncol. 2011;22(6):1295-301
12. Fridman E, Pichersky E. Metabolomics, genomics, proteomics, and the identification of enzymes and their substrates and products. Curr Opin Plant Biol. 2005;8(3):242-8
13. Chen J, Zhang X, Cao R. et al. Serum 27-nor-5beta-cholestane-3,7,12,24,25 pentol glucuronide discovered by metabolomics as potential diagnostic biomarker for epithelium ovarian cancer. J Proteome Res. 2011;10(5):2625-32
14. Fan L, Zhang W, Yin M. et al. Identification of metabolic biomarkers to diagnose epithelial ovarian cancer using a UPLC/QTOF/MS platform. Acta Oncol. 2012;51(4):473-9
15. Zhang T, Wu X, Yin M. et al. Discrimination between malignant and benign ovarian tumors by plasma metabolomic profiling using ultra performance liquid chromatography/mass spectrometry. Clin Chim Acta. 2012;413(9-10):861-8
16. Garcia E, Andrews C, Hua J. et al. Diagnosis of early stage ovarian cancer by 1H NMR metabonomics of serum explored by use of a microflow NMR probe. J Proteome Res. 2011;10(4):1765-71
17. Woo HM, Kim KM, Choi MH. et al. Mass spectrometry based metabolomic approaches in urinary biomarker study of women's cancers. Clin Chim Acta. 2009;400(1-2):63-9
18. Slupsky CM, Steed H, Wells TH. et al. Urine metabolite analysis offers potential early diagnosis of ovarian and breast cancers. Clin Cancer Res. 2010;16(23):5835-41
19. Tautenhahn R, Patti GJ, Rinehart D. et al. XCMS Online: a web-based platform to process untargeted metabolomic data. Anal Chem. 2012;84(11):5035-9
20. Tautenhahn R, Patti GJ, Kalisiak E. et al. metaXCMS: second-order analysis of untargeted metabolomics data. Anal Chem. 2011;83(3):696-700
21. Kuhl C, Tautenhahn R, Bottcher C. et al. CAMERA: an integrated strategy for compound spectra extraction and annotation of liquid chromatography/mass spectrometry data sets. Anal Chem. 2012;84(1):283-9
22. Wishart DS, Knox C, Guo AC. et al. HMDB: a knowledgebase for the human metabolome. Nucleic Acids Res. 2009;37(Database issue):D603-10
23. Smith CA, O'Maille G, Want EJ. et al. METLIN: a metabolite mass spectral database. Ther Drug Monit. 2005;27(6):747-51
24. Brown M, Dunn WB, Dobson P. et al. Mass spectrometry tools and metabolite-specific databases for molecular identification in metabolomics. Analyst. 2009;134(7):1322-32
25. Sutphen R, Xu Y, Wilbanks GD. et al. Lysophospholipids are potential biomarkers of ovarian cancer. Cancer Epidemiol Biomarkers Prev. 2004;13(7):1185-91
26. Frolkis A, Knox C, Lim E. et al. SMPDB: The Small Molecule Pathway Database. Nucleic Acids Res. 2010;38(Database issue):D480-7
27. Iorio E, Ricci A, Bagnoli M. et al. Activation of phosphatidylcholine cycle enzymes in human epithelial ovarian cancer cells. Cancer Res. 2010;70(5):2126-35
28. Fang X, Schummer M, Mao M. et al. Lysophosphatidic acid is a bioactive mediator in ovarian cancer. Biochim Biophys Acta. 2002;1582(1-3):257-64
29. Nomura DK, Long JZ, Niessen S. et al. Monoacylglycerol lipase regulates a fatty acid network that promotes cancer pathogenesis. Cell. 2010;140(1):49-61
30. Ha CY, Kim JY, Paik JK. et al. The association of specific metabolites of lipid metabolism with markers of oxidative stress, inflammation and arterial stiffness in men with newly diagnosed type 2 diabetes. Clin Endocrinol (Oxf). 2012;76(5):674-82
31. Mannheim D, Herrmann J, Versari D. et al. Enhanced expression of Lp-PLA2 and lysophosphatidylcholine in symptomatic carotid atherosclerotic plaques. Stroke. 2008;39(5):1448-55
32. Lecour S, Smith RM, Woodward B. et al. Identification of a novel role for sphingolipid signaling in TNF alpha and ischemic preconditioning mediated cardioprotection. J Mol Cell Cardiol. 2002;34(5):509-18
33. Hofmann U, Domeier E, Frantz S. et al. Increased myocardial oxygen consumption by TNF-alpha is mediated by a sphingosine signaling pathway. Am J Physiol Heart Circ Physiol. 2003;284(6):H2100-5
34. Opitz CA, Litzenburger UM, Sahm F. et al. An endogenous tumour-promoting ligand of the human aryl hydrocarbon receptor. Nature. 2011;478(7368):197-203
35. Prendergast GC. Cancer: Why tumours eat tryptophan. Nature. 2011;478(7368):192-4
Author contact
![]() Corresponding authors: Kang Li, PhD, Department of Epidemiology and Biostatistics, Harbin Medical University, Harbin 150081, China. Tel: 86-451-87502939, E-mail: likanghrbmu.edu.cn. and Ge Lou, Department of Gynecology Oncology, The Third Affiliated Hospital of Harbin Medical University, Harbin 150086, China. E-mail: lougehrbmu.edu.cn.
Corresponding authors: Kang Li, PhD, Department of Epidemiology and Biostatistics, Harbin Medical University, Harbin 150081, China. Tel: 86-451-87502939, E-mail: likanghrbmu.edu.cn. and Ge Lou, Department of Gynecology Oncology, The Third Affiliated Hospital of Harbin Medical University, Harbin 150086, China. E-mail: lougehrbmu.edu.cn.