Impact Factor ISSN: 1837-9664

 Global reach, higher impact
J Cancer 2014; 5(7):585-589. doi:10.7150/jca.9785 This issue Cite
Research Paper
3.0T MR-CAD: Clinical Value in Diagnosis of Breast Tumor Compared with Conventional MRI
Yu-Hui Liu, Liang Xu, Li-Heng Liu, Xiao-Shan Liu, Zhong-Yu Hou, Dong-Liang Hou, Zhao-Qiu Chen, Wen-Wu Li ![]() , Yong Huang
, Yong Huang ![]()
Department of Radiology, Shandong Tumor Hospital, Affiliated to Shandong Academy of Medical Sciences, Jinan 250017, China
Received 2014-6-2; Accepted 2014-6-18; Published 2014-7-13
Abstract
Purpose: to explore the clinical value of 3.0T magnetic resonance (MR) imaging compared with computer-aided MR diagnosis (MR-CAD) in differential diagnosis of benign and malignant breast tumors.
Materials and Methods: MRI method and MR-CAD method was used in the diagnosis of a total of 93 breast lesions of 78 patients, based on the morphological and time-intensity-curve (TIC) analysis. The accuracy of the two modalities in differentiating malignant and benign breast tumor was compared.
Results: MR-CAD method yielded a statistically better accuracy than MRI method. For 51 mass-like lesions, MRI and MR-CAD had no difference in diagnosing accuracy, but MR-CAD had better accuracy in 42 non-mass-like lesions.
Conclusion: MR-CAD had a notable advantage over MRI in differential diagnosis of benign and malignant breast tumors, especially non-mass-like tumor.
Keywords: 3.0T magnetic resonance imaging, computer-aided MR diagnosis
Introduction
Chinese women have a higher cancer incidence and mortality.(1) The imperfection of traditional breast imaging modality of mammography and color Doppler ultrasonography include the limited soft tissue resolution and spatial resolution, which might lead to misdiagnosis and underscore in clinical tumor staging. Enjoying its superior soft tissue contrast (2), high field magnetic resonance imaging (MRI) was reported to be an important modality in the diagnosis and staging of breast cancer. And some authors believe that breast MRI has high false positive rate which might lead to unnecessary surgical procedure. Furthermore, different MRI systems, different scanning protocols, and uneven diagnostic experience of breast radiologists will inevitably undermine the consistency of diagnosis of breast tumors (3). In recent years, a new MRI computer aided diagnosis (CAD) system has been put into clinical use. Compared with conventional MR diagnosis based on reading images on the workstation, MR-CAD system helped to improve diagnostic specificity while maintaining high sensitivity and eliminate the inconsistency of diagnostic interpretation between image readers (4,5). Herein, this study aimed at exploring the clinical value of MR-CAD in diagnosis of benign and malignant breast tumors.
Materials and Methods
Clinical data
The institutional review board approved this prospective study. Informed consent was obtained from all patients. From August 2010 to June 2011, a total of seventy-eight consecutive female patients (age range, 26-80 years, mean age, 47 years) with recently diagnosed breast tumor in our institution underwent MR examination. Ninety-three lesions were detected at routine MR examination. All lesions were greater than 0.8 cm in long-axis diameter. The diagnosis was confirmed by needle core biopsy (n = 13) and surgical histology (n = 80). MRI image analysis was performed on the integrated workstation and MR-CAD were used to differentiate benign and malignant lesions.
MRI protocol
MR scanning was performed with a 3.0T MR scanner (Philips Achieva 3.0T). The patients took a prone and feet-first position and put their breasts into the dedicated phased array breast coil. The scanning protocol and parameters are the following: axial T1-weighted imaging (repetition time (TR) = 495 ms, echo time (TE) = 10 ms, slice thickness / gap = 3 mm / 0 mm, matrix = 512, number of signal averaged (NSA) = 1, field of view (FOV) = 340 mm × 340 mm), axial T2-weighted imaging (TR = 4213 ms, TE = 120 ms, slice thickness / gap = 3 mm / 0 mm, matrix = 512, NSA = 1, FOV = 340 mm × 340 mm), T2-weighted fat-saturated imaging using a spectral selection attenuated inversion recovery (SPAIR) (TR = 4216 ms, TE = 60 ms, inversion delay (IR) = 120 ms, slice thickness / gap = 3 mm / 0 mm, matrix = 352, NSA = 1, FOV = 340 mm × 340 mm), and T1-weighted high-resolution isotropic volume examination (THRIVE) (TR = 4.4 ms, TE = 2.2 ms, flip angle = 12°; matrix = 352; FOV = 340 mm × 340 mm; number of sections = 110; acquisition time: 256 seconds) with seven dynamic scans. Contrast-enhanced MRI was achieved using 0.1 mmol/kg of body weight of gadopentetate dimeglumine administered through a power injector at a rate of 2.0 ml/s, immediately followed by a saline flush of 20 ml at the same injection rate. The source THRIVE images were reformatted to obtain the axial and oblique sagittal images with section slice of 3 mm and inter-slice gap of 0 mm.
MRI diagnosis
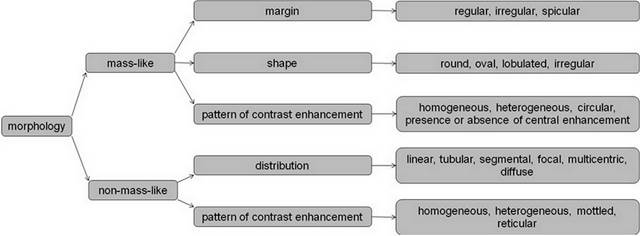
Three radiologists with over ten years of experience in MR imaging performed the image analysis on the integrated computer workstation without access to the final histologic results. Image analysis included the number, morphology and time intensity curve (TIC) pattern of breast lesion. Care was taken to include incidentally detected lesions in contralateral breast and exclude lesions less than 0.8 cm in long-axis diameter. All lesions were classified into mass-like lesion and non-mass-like lesion based on their shape, margin, distribution and pattern of contrast enhancement as illustrated in the following diagram (Figure 1).
Diagram showing the morphologic analysis procedure.
Three radiologists independently draw six regions of interest (ROIs) in each lesion, covering as much enhancing portion as possible while excluding apparent cystic and necrotic component. For cystic lesions, the ROIs were placed at the enhancing margin. The TICs of lesions were classified into three types based on their trajectory: type one, persistently enhancing, type two, plateau, and type three, washout). The three radiologists independently made the diagnosis as to benignity or malignancy base on a comprehensive consideration of the morphologic characteristics, the enhancing pattern and the TIC type. When there was a divergence of diagnosis between radiologists, a consensus was reached by discussion.
MR-CAD procedure
MR-CAD was performed on the DynaCAD system (Ivivo, version 2.1.1). A voxel was considered to be significantly enhancing if its signal intensity of the first dynamic scan after contrast medium administration reached a assigned threshold by comparing with the pre-contrast scan and was given a certain pseudo-color and otherwise no pseudo-color produced. The pseudo-color assigned to a voxel was depended on the signal intensity change between the first and the last dynamic scan after contrast medium administration. If the last dynamic scan had signal intensity greater than the first for more than ten percent, the voxel was given “RED” which represent washout curve, and if less for more than ten percent, “BLUE” which represent persistent contrasting curve, and if between plus and minus ten percent, “GREEN” which represent a plateau type of curve (Figure 2). The pseudo-color on each slice gives the information as to pattern and range of enhancement. Furthermore, imaging subtraction, multi-planar reformatting (MPR) and maximum intensity projection (MIP) (Figure 3) was performed with DynaCAD system.
A patient with histologically proven infiltrative ductal carcinoma with a history of five years after right beast radical mastectomy. A non-mass-like lesion was identified in the inner upper quadrant of left breast, which was diagnosed as benign lesion based on morphological analysis by using dynamic contrast enhanced MRI (A~H indicating time serial dynamics) on workstation.
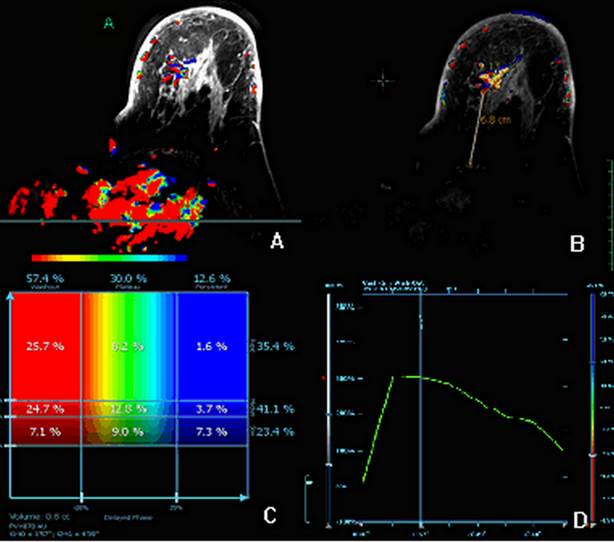
Same case with Figure 2. A diagnosis of malignant tumor was made by using MR-CAD, which revealed a good percentage of area of quick wash-in and wash-out within the lesion.

Differential diagnosis by MR-CAD
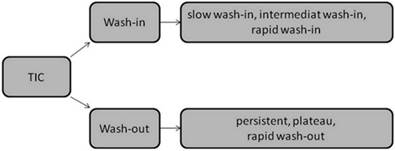
Morphologic analysis was identical to the MRI diagnosis. And the analysis of TIC was performed automatically by the system in the following procedure (Figure 4): a rapid wash-in was defined that the signal intensity of the first post-contrast dynamic scan of a voxel was 200% greater than the pre-contrast image, an intermediate wash-in was between 150% and 200%, and slow wash-in was below 60%. A quick wash-out was defined that the signal intensity of the first post-contrast dynamic scan of a voxel was more than 10% greater than the last dynamic scan, a persistent enhancing curve was defined that the first post-contrast dynamic scan of a voxel was more than 10% less than the last dynamic scan, and between plus and minus 10%, a plateau curve. Three radiologists performed MR-CAD procedure and first classified lesions into mass and non-mass group, then the morphology, the enhancement pattern and TIC pattern was taken into consideration to make a final diagnosis as to malignancy or benignity. When there was a divergence in diagnosis, the final diagnosis will be subject to the majority.
Diagram showing the time intensity curve (TIC) analysis procedure.
Results
A total of 93 lesions were detected from 78 patients, including 52 malignant lesions and 41 benign lesions (Table 1). Fifty-one lesions were classified to be mass-like lesion, and 42 non-mass-like lesion. The two methods had no difference as to mass and non-mass classification. In comparison with histology results, 69 (74.2%) of the 93 lesions were correctly diagnosed with MRI method, and 81 (87.1%) lesions were correctly diagnosed with MR-CAD method. And MR-CAD method was significantly more accurate than MRI method for both benign and malignant subgroup (P<0.05). For the 51 mass-like lesions, the two methods showed no difference in diagnosis (P>0.05), and for the 42 non-mass-like lesions, 28 (66.7%) lesions were correctly diagnosed with MRI method, and 36 (85.7%) lesions were correctly diagnosed with MR-CAD method. MR-CAD method was significantly more accurate than MRI method for malignant subgroup (P<0.05) and for the benign subgroup the two methods showed no statistical difference (P>0.05).
The diagnostic accuracy of two methods in mass-like lesions and non-mass-like lesions
| mass-like lesions (51) | non-mass-like lesions (42) | |||
|---|---|---|---|---|
| benign | malignant | benign | malignant | |
| MRI MRI-CAD | 17/22 18/22 | 24/29 27/29 | 14/19 16/19 | 14/23 20/23 |
Discussion
Since benign and malignant breast lesions may show resemblance in morphology, differentiation based solely on morphologic appearance is unreliable. Dynamic contrast-enhanced scan can provide more information helpful to diagnosis by facilitating detection of breast lesions and TIC characterization. In spite that three types of TIC (persistently ascending, plateau, and quick wash-out type) typically represent benign, possibly malignant, and definitive malignant lesion, there is still an overlap between benign and malignant lesions. Kuhl (6) et al. reported a positive predictive value of 6%, 12%, and 87% for the three types of TIC respectively. So TIC cannot guarantee a definitive diagnosis, but can of added value to morphologic analysis as to the differentiation between benign and malignant lesion.
Our study found that MRI method and MR-CAD method showed no difference in detection of breast lesions. This is due to the patient inclusion criteria excluded those lesion less than 0.8cm in diameter to eliminate impact of difference in sensitivity on the statistical analysis.
In the diagnosis of breast lesions, the morphologic and enhancement characteristics were firstly analyzed. A diagnosis of malignant lesion was made on the basis of prominent malignant signs such as lobulated and spiculated margin and apparent invasion of chest wall (7). A diagnosis of benign lesion was made on the basis of apparent benign signs such as a clear border, eccentric and homogeneous enhancement, presence of septa of low signal intensity and being hyper-intense on T2-weighted images. When the morphologic appearance was not typical, TIC characteristics is taken into consideration. MR-CAD analysis can reflect both the wash-in and the wash-out status of every voxel with the lesion. And according to different TIC types, a pseudo-color was given to the voxel. “RED” represent areas of definitively malignant tissue, “GREEN” represent areas of possibly malignant tissue, and “BLUE” represent possibly benign tissue. The analysis of TIC characteristics was usually performed subjectively and manually on workstation, and there might be a variant of diagnosis according to different ROI size and position, and moreover the wash-in status is usually neglected. This drawback can be overcome by MR-CAD, by which the analysis of wash-in and wash-out was performed automatically based on the pre-established threshold and was thus more objective. Former studies(8,9) showed that the accuracy of quantitative analysis was 86% and much better than qualitative assessment. MR is a useful diagnostic tool for fluid-containing mass.(10)
In this study, we showed that MR-CAD method was more accurate than MRI method for the 42 non-mass-like lesions. And for the typical mass-like lesions, the two methods yielded no difference in accuracy. The mass-like tumor are most pathologically invasive ductal carcinoma, which usually present typical morphology and TIC of malignant tumor and had lessened difficulty in diagnosis. Non-mass-like lesions include ductal carcinoma in situ (DCIS), invasive lobular carcinoma and papilloma, which may have a variant morphologic appearance and TIC type, causing difficulty in confident diagnosis. In the MR-CAD analysis, we found that malignant tumor usually had volume of quick wash-in and wash-out with a coverage of more than 10% of total volume, while for benign lesions, the percentage is usually less than 10%. When the morphologic appearance and the TIC curve analysis did not support a confident diagnosis, the percentage of volume representing different kinetics out of the total lesion volume may be of added value to reach a definitive conclusion. In contrast, manual TIC analysis is usually performed by one radiologist by positioning one or several ROIs to most suspicious site within the lesion. Poor repeatability is inevitable and an overall evaluation of the kinetics of the whole volume of lesion is unachievable.
Conclusion
The dedicated MR-CAD system can not only help to evaluate the morphology of breast lesions, but also facilitate comprehensive, automatic, quantitative kinetic analysis, thus enjoys advantages in differentiating malignant and benign breast lesions, especially non-mass-like lesions.
Abbreviations
MR: magnetic resonance; MRI: magnetic resonance imaging; CAD: computer aided diagnosis, TR: repetition time, TE: echo time, NSA: number of signal averaged, FOV: field of view, SPAIR: spectral selection attenuated inversion recovery, THRIVE: T1-weighted high-resolution isotropic volume examination, TIC: time intensity curve, ROI: regions of interest, MPR: multi-planar reformatting, MIP: maximum intensity projection.
Acknowledgements
This study was supported by Shandong Cancer Hospital Grant.
Competing Interests
The authors have declared that no competing interest exists.
References
1. Zeng H, Zheng R, Zhang S, Zou X, Chen W. Incidence and mortality of female breast cancer in China, 2009. Thoracic Cancer. 2013;4(4):400-404
2. Wiener JI, Schilling KJ, Adami C, Obuchowski NA. Assessment of suspected breast cancer by MRI: a prospective clinical trial using a combined kinetic and morphologic analysis. AJR Amer J Roen. 2005;184(3):878-886
3. Jansen SA, Shimauchi A, Zak L. et al. Kinetic curves of malignant lesions are not consistent across MRI systems: need for improved standardization of breast dynamic contrast-enhanced MRI acquisition. Amer J Roen. 2009;193(3):832-839
4. Comstock C. Breast magnetic resonance imaging interpretation using computer-aided detection. Sem Roen. 2011;46(1):76-85
5. Lehman CD, Peacock S, DeMartini WB, Chen X. A new automated software system to evaluate breast MR examinations: improved specificity without decreased sensitivity. Amer J Roen. 2006;187(1):51-56
6. Kuhl CK, Mielcareck P, Klaschik S. et al. Dynamic breast MR imaging: are signal intensity time course data useful for differential diagnosis of enhancing lesions? Radiology. 1999;211(1):101-110
7. Macura KJ, Ouwerkerk R, Jacobs MA, Bluemke DA. Patterns of enhancement on breast MR images: interpretation and imaging pitfalls. Radiographics: a review publication of the Radiological Society of North America, Inc. 2006;26(6):1719-1734 quiz 1719
8. El Khouli RH, Macura KJ, Jacobs MA. et al. Dynamic contrast-enhanced MRI of the breast: quantitative method for kinetic curve type assessment. Amer J Roen. 2009;193(4):W295-300
9. Newell D, Nie K, Chen JH. et al. Selection of diagnostic features on breast MRI to differentiate between malignant and benign lesions using computer-aided diagnosis: differences in lesions presenting as mass and non-mass-like enhancement. Eur Radiol. 2010;20(4):771-781
10. Jin H, Tang LQ, Pan ZG. et al. Ten-year retrospective analysis of multiple trauma complicated by pulmonary contusion. Mil Med Res. 2014;1:7
Author contact
![]() Corresponding authors: Dr. Wenwu Li, Email: cnliuyncom. Dr. Yong Huang, Email: czhouorg
Corresponding authors: Dr. Wenwu Li, Email: cnliuyncom. Dr. Yong Huang, Email: czhouorg