Impact Factor ISSN: 1837-9664

 Global reach, higher impact
J Cancer 2026; 17(3):604-613. doi:10.7150/jca.126673 This issue Cite
Research Paper
Impact of Skeletal Muscle-related Parameters on Survival in Patients with Advanced Pancreatic Cancer Treated with Gemcitabine plus Nab-paclitaxel as First-line Chemotherapy
Nanako Matsuo1,2, Toshifumi Yamaguchi1,2, Hiroki Yukami1,2, Hiroyuki Kodama1,2, Takako Ikegami1,2, Toru Kadono1,2, Shin Kameisihi1,2,3, Dai Okemoto1,2,4, Elham Fakhrejahani5, Hiroki Nishikawa2 ![]()
1. Cancer Chemotherapy Center, Osaka Medical and Pharmaceutical University Hospital, Osaka, Japan
2. Second Department of Internal Medicine, Osaka Medical and Pharmaceutical University, Osaka, Japan
3. Department of Gastrointestinal Oncology, National Cancer Center Hospital, Tokyo, Japan
4. Department of Gastrointestinal Oncology, National Cancer Center Hospital East, Kashiwa, Japan
5. Kyoto Breast Cancer Research Network
Received 2025-10-13; Accepted 2026-2-3; Published 2026-2-26
Abstract

Background: Sarcopenia, defined as a reduction in muscle mass assessed using scales such as the psoas muscle mass index (PMI), is accompanied by decreased muscle strength or physical function. However, sarcopenia's effect in patients with pancreatic cancer (PC) receiving chemotherapy remains unclear. In addition, recent international studies have demonstrated that intramuscular fat infiltration, assessed using parameters such as FRPM, is associated with poor prognosis across various malignancies. However, evidence regarding its prognostic significance in pancreatic cancer remains limited. We aimed to evaluate the relationship between sarcopenia and the prognosis of patients with PC receiving palliative chemotherapy.
Methods: We retrospectively reviewed patients diagnosed with unresectable PC who received gemcitabine plus nab-paclitaxel (GnP) as the first-line therapy at our hospital between 2018 and 2021. We calculated PMI, defined as the sum of the bilateral psoas muscle mass at the lumbar three (L3) level and FRPM, defined as the sum of areas within the psoas muscles corresponding to fat at the L3 level from Vincent® on the CT images. We compared the overall survival (OS) between the PMI-high and PMI-low groups and the FRPM-high and FRPM-low groups.
Results: Of 46 patients, 37 were eligible. Eighteen (49%) and 19 (51 %) patients were classified into PMI-high and PMI-low groups, respectively. Twenty (54%) and 17 patients (46%) were classified into FRPM-high and FRPM-low groups, respectively. The median OS was 16.4 months in PMI-high and 8.7 months in PMI-low groups (hazard ratio [HR]: 0.45, 95% confidence interval [CI]: 0.23-0.90, P < 0.01). The median OS was 15.6 months in FRPM-low and 8.5 months in FRPM-high groups (HR: 0.36, 95% CI: 0.18-0.76, P < 0.01). In multivariate analysis, the presence of ascites (P < 0.01), PMI-low (P = 0.02), and FRPM-high (P = 0.03) were independent adverse prognostic factors for OS.
Conclusion: Muscle-related parameters may be independent indicators of poor prognosis in patients with PC treated with first-line GnPs.
Keywords: Advanced pancreatic cancer, Gemcitabine plus nab-paclitaxel, Psoas muscle, Fat deposition, Prognosis
Introduction
Pancreatic cancer (PC) is the fourth leading cause of cancer-related death in Japan, and its incidence and mortality rates are increasing steadily [1]. PC is a lethal condition of the digestive system, and patients have a poor prognosis. Incidence and mortality rates of PC have increased over the past decades [2-4]. Despite advances in systemic chemotherapy and supportive care, the prognosis of patients with PC remains extremely poor, with a 5-year overall survival (OS) rate of approximately 10% [5]. In patients with stage IV PC, the 5-year survival rate drops to < 2%, underscoring the disease's aggressive nature and the urgent need to identify clinical and biological factors that can guide treatment decisions and predict prognosis [6]. Among the standard first-line chemotherapy regimens for unresectable PC, gemcitabine combined with nanoparticle albumin-bound paclitaxel (nab-paclitaxel) has shown a survival benefit over gemcitabine monotherapy and is now widely used in clinical practice [7]. However, the therapeutic response to this regimen substantially varies among patients, suggesting that the tumor burden alone is insufficient to predict treatment outcomes. In recent years, host-related factors, including nutritional status, body composition, and systemic inflammation, have gained research traction. These have been shown to influence treatment tolerance and survival outcomes. Sarcopenia, defined as the progressive loss of skeletal muscle mass, strength, or physical performance, is highly prevalent in patients with advanced cancer, particularly in those with PC [8-12]. These patients are often older and are commonly affected by cancer cachexia, reduced physical activity, and insufficient oral intake. Sarcopenia is associated with increased chemotherapy-related toxicity, early treatment discontinuation, impaired antitumor immunity, and poorer OS [13-16]. However, its prognostic value in patients with PC undergoing palliative chemotherapy, including those treated with gemcitabine and nab-paclitaxel (GnP), remains unclear. In addition to skeletal muscle quantity, muscle quality, particularly the degree of intramuscular fat infiltration, or myosteatosis, has been recently acknowledged as a clinically relevant indicator of muscle function and metabolic health [17]. Myosteatosis is associated with insulin resistance, inflammation, and frailty and may contribute to poor treatment outcomes in patients with cancer. Specifically, the psoas muscle mass index (PMI), which reflects muscle quantity, and the fat ratio within the psoas muscle (FRPM), which reflects muscle quality, have emerged as objective and quantifiable markers of sarcopenia in clinical settings [18-21]. We previously reported the prognostic impact of FRPM in patients with stage IV gastric cancer who were undergoing systemic chemotherapy [22].
Systemic inflammation is increasingly being recognized as a hallmark of cancer progression and is associated with malnutrition and muscle wasting. In this context, inflammation-based biomarkers, such as the Glasgow Prognostic Score (GPS) and neutrophil-to-lymphocyte ratio (NLR), have emerged as simple and cost-effective prognostic tools. GPS, which integrates serum C-reactive protein (CRP) and serum albumin levels, reflects both systemic inflammation and nutritional status, while NLR provides insight into the balance between protumor neutrophilic activity and antitumor lymphocyte-mediated immune surveillance. Both indices are correlated with poor survival in various malignancies, including PC [22-2].
We investigated the prognostic significance of sarcopenia and intramuscular fat infiltration in patients with unresectable PC who underwent GnP therapy. We focused on objective indices, such as PMI and FRPM, and examined their association with treatment efficacy and survival outcomes. We explored their relationship with systemic inflammatory markers, such as GPS and NLR.
Materials and Methods
Patients and methods
We retrospectively reviewed the medical records of patients with histologically confirmed advanced PC at the Osaka Medical and Pharmaceutical University, Osaka, Japan. Inclusion criteria were as follows: patients who received GnP, no systemic chemotherapy before receiving GnP after the diagnosis of inoperable PC, Eastern Cooperative Oncology Group performance status (ECOG-PS) of 0-2, and histologically confirmed PC.
Between April 2018 and March 2021, 46 patients diagnosed with unresectable PC were identified in our medical records, of whom 37 underwent first-line chemotherapy with GnP. They were eligible for our analysis. Five patients who received other treatments and four with immature dates were excluded from the analysis. The primary endpoint was OS. Factors relevant to OS were retrospectively analyzed by univariate and multivariate analyses. The Ethics Committee of Osaka Medical and Pharmaceutical University Hospital (approval number, 2024-057) approved the study. The requirement for informed consent from each patient was waived because of the study's retrospective nature.
Age, sex, ECOG-PS, body mass index (BMI), and laboratory data were extracted from medical records, and prognostic indicators reflecting inflammation and cachexia, GPS (GPS = 0 was assigned when CRP levels were < 1.0 mg/dL and serum albumin levels were > 3.5 g/dL; GPS = 1 was assigned when CRP was > 1.0 mg/dL or serum albumin levels were < 3.5 g/dL, and GPS = 2 was assigned when CRP levels were > 1.0 mg/dL and serum albumin levels were < 3.5 g/dL). NLR was calculated from laboratory data. The presence or absence of ascites was determined from computed tomography (CT) images.
Treatment
Almost all patients were treated with nab-paclitaxel (125 mg/m2) and gemcitabine (1,000 mg/m2) as the first-line chemotherapy on days 1, 8, and 15 every 4 weeks, constituting one treatment cycle. In some patients, doses were reduced based on certain factors, such as age and ECOG-PS. First-line chemotherapy was discontinued in patients who developed progressive disease (PD). After initiating treatment, patients underwent careful follow-up and imaging, and tumor marker measurements. Patients with PD received a second-line chemotherapy regimen or adequate supportive care. The start date of the follow-up was set as the date of initiation of first-line chemotherapy. The end date of the follow-up was set as the final follow-up date in June 2021 or the date of death.
Measurement of skeletal muscle mass
PMI was defined as the sum of bilateral psoas muscle mass calculated by Vincent® (SYNAPSEVINCENT, Fuji Film Medical Corporation, Tokyo, Japan) at the lumbar three (L3) level on the CT images (at the time of initial chemotherapy), divided by height squared (cm2/m2). We proposed FRPM at the L3 level (at the time of initial chemotherapy) based on our previous findings and calculated it as follows: fat mass within the bilateral psoas muscle at the L3 level was calculated using Vincent's formula (the sum of the areas within the left and right psoas muscles corresponding to fat (cm2)) divided by bilateral psoas muscle mass calculated using Vincent's formula (cm2) × 100 (%) [20]. The CT density for fat was defined between -200 Hounsfield Units (HU) and -50 HU. To minimize measurement bias, a single well-trained researcher (T. I.) identified and measured the psoas muscle mass and fat within the psoas muscle.
Statistical analysis
Continuous variables between two groups were compared by Student's t-test or Mann-Whitney U test, as appropriate. Categorical variables between groups were compared by the Pearson χ2 test. Continuous parameters were divided into two groups at the median value and transformed into nominal variables to analyze the significance of the prognostic parameters. Continuous analyses of PMI and FRPM were also considered; however, because of potential overfitting and instability of estimates, the dichotomized approach was prioritized. The cutoff value for NLR (3.44) was determined based on the median value within our cohort. Currently, there is no standardized cutoff value for NLR, and previous studies have reported substantial heterogeneity in cutoff definitions, with some studies adopting the median value as the cutoff. Therefore, we adopted this approach in the present study [25]. The Kaplan-Meier method and log-rank test were used to estimate the cumulative OS rate. A Cox proportional hazard model was used for multivariate analysis of parameters with a P-value < 0.05 in the univariate analysis. The observation period was defined as the time interval between the date of initial chemotherapy and the date of death or the last date of confirmed survival. For data presentation, n (%) or median (range) was used unless stated otherwise. JMP ver. 15 (SAS Institute Inc., Cary, NC, USA) was used for statistical analysis, and a P value < 0.05 was considered statistically significant.
Results
Baseline patient characteristics
The baseline characteristics of all study participants (n=37, 20 men and 17 women, median (range) age =70 (49-86) years) are summarized in Table 1. The median (range) BMI was 20.0 (14.2-32.9) kg/m2. An ECOG PS of 0 was found in 11 patients (29.7%), 1 in 25 (67.6%), and 2 in 1 (2.7%). Twenty-six patients (70.3%) had no ascites, 8 (21.6%) had mild ascites, 2 (5.4%) had moderate ascites, and 1 (2.7%) had severe ascites. The median (range) FRPM was 2.55 (0.05-9.01) %. Twenty patients with FRPM ≥ 2.55% were categorized into the FRPM-high group, and the remaining 17 were in the FRPM-low group. The median (range) PMI in male and female patients was 3.92 (2.11-6.73) cm2/m2 and 3.57 (2.17-4.49) cm2/m2. Ten male patients with PMI ≥ 3.92 cm2/m2 and 8 female patients with PMI ≥ 3.57 cm2/m2 constituted the PMI-high group, and the remaining 19 patients were in the PMI-low group.
Baseline patient characteristics
| n (%) or Median (range) | |
|---|---|
| Age (years) | 70 (49-86) |
| Sex | |
| Male | 20 (54%) |
| Female | 17 (46%) |
| ECOG-PS | |
| 0 | 11 (30%) |
| 1 | 25 (67%) |
| 2 | 1 (3%) |
| Body mass index (kg/m2) | 20.0 (14.2-32.9) |
| Ascites | |
| none | 26 (70%) |
| mild | 8 (22%) |
| moderate | 2 (5%) |
| severe | 1 (3%) |
| Alanine aminotransferase (IU/L) | 22 (9-244) |
| C reactive protein (mg/dL) | 0.41 (0.02-17) |
| eGFR (mL/min/1.73 m2) | 77 (18-112) |
| Serum albumin (g/dL) | 3.7 (2.3-4.3) |
| Neutrophil count (/μL) | 3887 (1860-21672) |
| Total lymphocyte count (/μL) | 1346 (490-2961) |
| Glasgow Prognostic Score | |
| 0 | 8 (22%) |
| 1 | 17 (46%) |
| 2 | 12 (32%) |
| Neutrophil to lymphocyte ratio | 3.25 (1.31-21.76) |
| FRPM (%) | 2.55 (0.05-9.01) |
| PMI (cm2/m2) | |
| Male | 3.92 (2.11-6.73) |
| Female | 3.57 (2.17-4.49) |
ECOG-PS, Eastern Cooperative Oncology Group performance status; eGFR, estimated glomerular filtration rate; PMI, psoas muscle index; FRPM, fat ratio within the psoas muscle.
Initial systemic chemotherapy
In terms of initial chemotherapy, GnP was administered in 37 patients, chemoradiotherapy in 3, oxaliplatin and irinotecan plus fluorouracil (FOLFIRINOX) in 2, and data were insufficient in 4 patients. The median duration of GnP therapy was 118 days, and the median initial treatment doses were 123 mg/m²/day for nab-paclitaxel and 996 mg/m²/day for gemcitabine.
Cumulative OS rate according to the PMI and FRPM
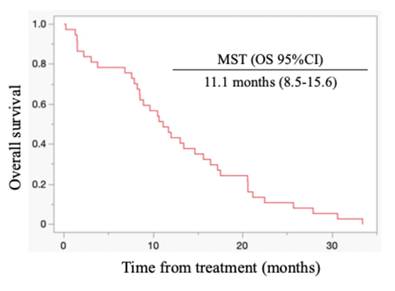
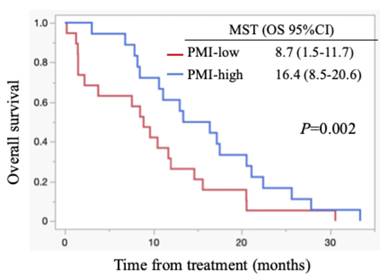
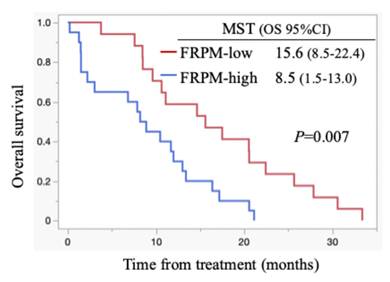
All patients died during the follow-up period, and these were PC-related deaths. The median OS for all cases was 11.1 months (95% confidence interval (CI): 8.5-15.6 months) (Figure 1). Regarding post-progression management, 24 patients (64.9%) received second-line chemotherapy after disease progression: 13 patients were treated with nanoliposomal irinotecan plus 5-fluorouracil, 2 with FOLFOX, 6 with S-1, and 3 with irinotecan monotherapy. The remaining 13 patients did not receive second-line therapy. Information on whether patients underwent nutritional counselling or rehabilitation during treatment was unavailable. The median progression-free survival (PFS) was 5.5 months (95% CI: 4.4-6.9 months), and the 6-month PFS rate was 45.9 %. The objective response rate (ORR) was 21.6 % (8/37). FRPM-high was significantly associated with shorter PFS (P = 0.0023), whereas no significant correlations were found between PMI and PFS (P = 0.2927), or between PMI/FRPM and ORR (P = 0.3743 and P = 0.5862, respectively). The median OS was 16.4 months in PMI-high and 8.7 months in PMI-low (HR: 0.45, 95% CI: 0.23-0.90, P = 0.002) (Figure 2). The median OS was 15.6 months in FRPM-low and 8.5 months in FRPM-high (HR: 0.36, 95% CI: 0.18-0.76, P = 0.007) groups (Figure 3). The 1-year cumulative OS rates of patients in PMI-high and PMI-low groups were 58% and 26%, respectively. The 1-year cumulative OS rates in the FRPM-high and FRPM-low groups were 43% and 55%, respectively.
Kaplan-Meier curves for all cases. MST: median survival time; OS: overall survival; CI: confidence interval.
Kaplan-Meier curves stratified by PMI for all cases. MST: median survival time; OS: overall survival; CI: confidence interval.
Kaplan-Meier curves stratified by FRPM for all cases. MST: median survival time; OS: overall survival; CI: confidence interval.
Survival according to FRPM and PMI in males and females
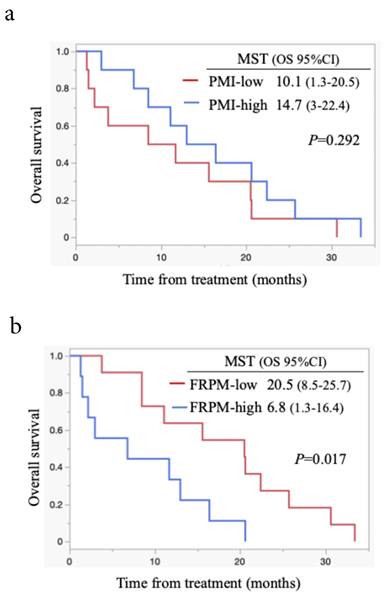
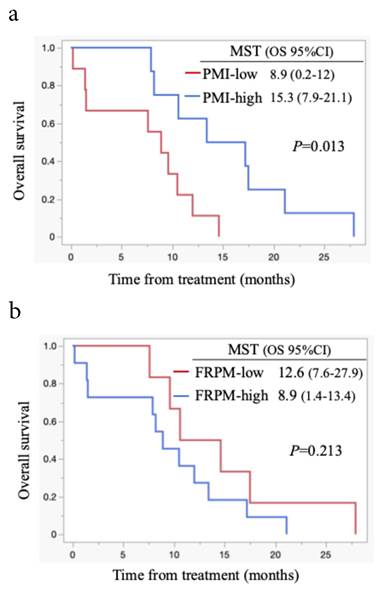
Survival analysis according to PMI and FRPM in males is shown in Figures 4a and 4b. In males, survival between the PMI-high and PMI-low groups did not differ significantly (P = 0.292, Figure 4a). Patients with FRPM-low showed better survival than those with FRPM-high (P = 0.017; Figure 4b). In females, although patients in the PMI-high group showed significantly better survival than those in the PMI-low group (P = 0.013, Figure 5a), the difference in survival did not reach statistical significance (P = 0.213, Figure 5b).
Kaplan-Meier curves stratified by PMI (4a) and FRPM (4b) in males. MST: median survival time; OS: overall survival; CI: confidence interval.
Kaplan-Meier curves stratified by PMI (5a) and FRPM (5b) in females. MST: median survival time; OS: overall survival; CI: confidence interval.
Uni- and multivariate analyses for OS
In univariate analysis for OS for all cases, presence of ascites (P = 0.010), GPS 0-1 (P = 0.001), NLR ≥ 3.44 mg/dl (P = 0.012), PMI-high (P = 0.002), and FRPM-high (P = 0.007) were significant factors (Table 4). In multivariate Cox regression analysis, the presence of ascites (P = 0.001), PMI-low (P = 0.021), and FRPM-high (P = 0.028) were independent adverse predictors of OS. HRs and 95% CIs for each parameter are listed in Table 4. In this model, the PMI-high was used as the reference for PMI, and the FRPM-low was used as the reference for FRPM.
Comparison of baseline data between the FRPM-high and FRPM-low groups
Comparison of baseline data between the FRPM-high and FRPM-low groups showed significant differences in BMI (P = 0.003), serum albumin level (P = 0.011), and GPS score (P = 0.028) (Table 2). Although CRP did not differ significantly between groups, serum albumin was lower and GPS was higher in the FRPM-high group, suggesting a trend toward greater systemic inflammation.
Comparison of baseline data between FRPM-high and FRPM-low groups
| n or median | P value | ||
|---|---|---|---|
| FRPM-high (n=20) | FRPM-low (n=17) | ||
| Age (years) | 66.5 | 73 | 0.639 |
| Sex, male/Female | 9/11 | 11/6 | 0.325 |
| ECOG-PS, 0/1/2 | 4/15/1 | 7/10/0 | 0.226 |
| Body mass index (kg/m2) | 21.7 | 18.6 | 0.003 |
| Ascites, none/mild/moderate/severe | 14/3/2/1 | 12/5/0/0 | 0.206 |
| Alanine aminotransferase (IU/L) | 20.5 | 28 | 0.939 |
| C reactive protein (mg/dL) | 1.07 | 0.21 | 0.134 |
| eGFR (mL/min/1.73 m2) | 70 | 78 | 0.126 |
| Serum albumin (g/dL) | 3.65 | 3.9 | 0.011 |
| Glasgow Prognostic Score, 0/1/2 | 3/7/10 | 5/10/2 | 0.028 |
| Neutrophil to lymphocyte ratio | 7.6 | 3.19 | 0.072 |
| PMI-high/low | 9/11 | 9/8 | 0.630 |
ECOG-PS, Eastern Cooperative Oncology Group performance status; eGFR, estimated glomerular filtration rate; PMI, psoas muscle index; FRPM, fat ratio within the psoas muscle.
Comparison of baseline data between PMI-high and PMI-low groups
In the comparison of baseline data between patients with high and low PMI, the distribution of ECOG-PS differed between the two groups (P = 0.006). The proportions of patients with ECOG-PS 0 with high and low PMI were 50.0% (9/18) and 10.5% (2/19), respectively. The proportions of patients with ECOG-PS 1 or 2 in FRPM-high and FRPM-low groups were 50.0% (9/18) and 89.5% (17/19), respectively (Table 3).
Comparison of baseline data between PMI-high and PMI-low groups
| n or median | P value | ||
|---|---|---|---|
| PMI-high (n=18) | PMI-low (n=19) | ||
| Age (years) | 68.5 | 71 | 0.679 |
| Sex, Male/Female | 10/8 | 10/9 | 0.858 |
| ECOG-PS, 0/1/2 | 9/9/0 | 2/16/1 | 0.006 |
| Body mass index (kg/m2) | 20.3 | 20.0 | 0.419 |
| Ascites, none/mild/moderate/severe | 15/2/1/0 | 11/6/1/1 | 0.137 |
| Alanine aminotransferase (IU/L) | 21.5 | 23 | 0.318 |
| C reactive protein (mg/dL) | 0.47 | 0.41 | 0.620 |
| eGFR (mL/min/1.73 m2) | 79.5 | 68 | 0.140 |
| Serum albumin (g/dL) | 3.7 | 3.6 | 0.166 |
| Glasgow Prognostic Score, 0/1/2 | 2/11/5 | 6/6/7 | 0.645 |
| Neutrophil to lymphocyte ratio | 3.45 | 3.24 | 0.564 |
| FRPM-high/low | 9/9 | 10/9 | 0.630 |
ECOG-PS, Eastern Cooperative Oncology Group performance status; eGFR, estimated glomerular filtration rate; PMI, psoas muscle index; FRPM, fat ratio within the psoas muscle.
Univariable and multivariable analyses for overall survival with Cox proportional hazards models
| Covariate | n | Univariable analyses | Multivariable analysis | ||||
|---|---|---|---|---|---|---|---|
| HR | 95% CI | P-value | HR | 95% CI | P-value | ||
| Age ≧ 69 (years), yes/no | 20/17 | 1.048 | 0.541, 2.030 | 0.890 | |||
| Sex, Male/Female | 20/17 | 1.499 | 0.764, 2.940 | 0.239 | |||
| ECOG-PS 0, yes/no | 11/26 | 1.714 | 0.819, 3.587 | 0.152 | |||
| Presence of ascites, yes/no | 11/26 | 0.396 | 0.189, 0.827 | 0.014 | 0.243 | 0.100, 0.587 | 0.001 |
| BMI > 20 kg/m2, yes/no | 18/19 | 0.581 | 0.288, 1.175 | 0.131 | |||
| GPS 0-1, yes/no | 25/12 | 3.284 | 1.532, 7.039 | 0.002 | 2.390 | 0.894, 6.387 | 0.082 |
| NLR ≧ 3.44, yes/no | 17/20 | 0.400 | 0.195, 0.818 | 0.012 | 0.559 | 0.199, 1.572 | 0.270 |
| eGFR≧60 ml/min/1.73m2, yes/no | 30/7 | 1.714 | 0.735, 3.994 | 0.212 | |||
| PMI-high/low | 19/18 | 0.450 | 0.231-0.902 | 0.002 | 2.374 | 1.141, 4.939 | 0.021 |
| FRPM-high/low | 20/17 | 0.365 | 0.175, 0.760 | 0.007 | 0.537 | 0.143, 0.896 | 0.028 |
ECOG-PS, Eastern Cooperative Oncology Group performance status; BMI, body mass index; GPS, Glasgow prognostic score; NLR, neutrophil-to-lymphocyte ratio; eGFR, estimated glomerular filtration rate; PMI, psoas muscle index; FRPM, fat ratio within the psoas muscle; HR, hazard ratio; CI, confidence interval.
Reference categories: PMI-high; FRPM-low. HRs indicate risk category vs. reference category.
Discussion
We aimed to clarify the prognostic significance of sarcopenia and intramuscular fat infiltration in patients with unresectable PC who received GnP as the first-line chemotherapy. Our findings demonstrated that both lower PMI and higher FRPM were independently associated with shorter OS. Ascites was a significant adverse prognostic factor. Thus, muscle mass and quality, which can be readily evaluated from routine CT scans, are critical determinants of treatment outcomes and survival in patients with advanced PC receiving GnP as the first-line systemic chemotherapy.
Our data align with mounting evidence underscoring the negative prognostic role of sarcopenia in various malignancies. Lisa Lellouche et al. reported the association of sarcopenia with poor survival in patients with advanced PC receiving FOLFIRINOX [26]. Similarly, Wan et al. demonstrated that, in patients with gastrointestinal cancer, decreased skeletal muscle mass predicted worse chemotherapeutic tolerance and overall prognosis [27]. Recent meta-analyses restricted to PDAC found that CT-defined sarcopenia is significantly associated with poorer overall survival across resectable and advanced disease settings [28]. Our results support these observations by incorporating a measure of muscle quality (i.e., FRPM) into the analysis and confirming its prognostic effect.
Patients with a higher FRPM had a significantly shorter OS, highlighting the emerging role of myosteatosis as a clinically meaningful parameter for cancer prognosis. Interestingly, although the low-FRPM group showed a lower BMI, their overall prognosis was better than that of the high-FRPM group. This finding suggests that low FRPM may represent a relatively preserved muscle phenotype with limited intramuscular fat infiltration, reflecting an earlier or less metabolically impaired stage of cancer progression. In contrast, high FRPM may indicate advanced myosteatosis associated with systemic inflammation and insulin resistance, which are known to worsen survival in cancer patients. Myosteatosis, defined as pathological fat infiltration into the skeletal muscle, is increasingly being recognized as a biomarker of systemic metabolic dysfunction, chronic inflammation, and impaired physical resilience, which are known to contribute to cancer progression and poor treatment outcomes. Tweed et al. reported that increased intramuscular fat, measured from CT, is an independent predictor of poor prognosis in patients with stage IV gastric cancer undergoing systemic chemotherapy [29]. Although PDAC-specific meta-analyses on myosteatosis are still scarce, our results extend the PDAC sarcopenia literature by incorporating a CT-based marker of muscle quality (FRPM) and suggest that FRPM may be more sensitive than PMI; accordingly, validation in larger, prospective PDAC cohorts is warranted. Consistent with these findings, our study suggests that the FRPM may be a more sensitive marker of cancer-related frailty than PMI alone, reflecting both structural muscle degradation and the metabolic milieu underpinning cancer cachexia and adverse clinical outcomes [30].
Mechanisms linking sarcopenia and myosteatosis to poor cancer outcomes are multifactorial. First, the skeletal muscle is essential for protein storage, energy metabolism, and cytokine regulation, which contribute to host defense and treatment resilience [31]. Second, patients with sarcopenia or a higher FRPM are more likely to experience dose-limiting toxicities, early treatment discontinuation, and reduced quality of life [32]. Third, both conditions are closely associated with systemic inflammation, as reflected by their correlation with high GPS and low serum albumin [33]. These inflammatory and nutritional derangements may fuel a vicious cycle of cachexia, impaired immunity, and tumor progression.
Furthermore, our analysis revealed a significant association between low PMI and poor ECOG-PS scores. This finding supports the notion that imaging-based assessments may provide objective metrics to complement clinician-assigned PS, which can be subjective and less sensitive to subtle declines in functional reserve. Similarly, patients with higher FRPM had lower albumin levels and showed higher systemic inflammation, suggesting that FRPM reflects localized muscle pathology and, broadly, metabolic stress.
The integration of body composition analysis into routine cancer care is becoming increasingly feasible with the advent of automated software tools, such as SYNAPSE VINCENT®. This allows for rapid, reproducible, and standardized measurements of muscle mass and fat infiltration from standard-of-care CT images, thus offering promising avenues for improving prognosis, risk stratification, and personalized treatment planning. Given an aging cancer patient population, sarcopenia before treatment initiation is increasingly emerging as a critical factor in oncology. Older patients are particularly vulnerable to skeletal muscle depletion owing to age-related changes, comorbidities, and decreased physical activity. As such, pretreatment evaluation of sarcopenia using imaging-based metrics, such as PMI and FRPM, can offer valuable insights into a patient's functional reserve and treatment tolerance. Identifying sarcopenia before starting systemic therapy may allow early implementation of supportive interventions, such as nutritional therapy and exercise programs, potentially improving treatment outcomes and preserving quality of life [34]. Beyond muscle-related indices, such as PMI and FRPM, systemic inflammatory markers, including GPS and NLR, are significant prognostic indicators in PC. These biomarkers reflect the host's inflammatory and nutritional status and are critically involved in cancer cachexia and mediating treatment responses. GPS, derived from serum CRP and albumin levels, is correlated with survival in patients with advanced PC. Akazawa et al. reported the association of elevated GPS with shorter OS in patients undergoing chemotherapy, independent of the tumor burden [33]. This suggests that systemic inflammation and malnutrition, captured by the GPS, may be better indicators of host vulnerability than tumor characteristics alone. Because the study by Akazawa et al. involved patients with non-small cell lung cancer (NSCLC), the findings may not be directly comparable to pancreatic cancer. Similarly, NLR, calculated as the ratio of neutrophils to lymphocytes in peripheral blood, is a simple yet powerful predictor of poor prognosis. García-Herrera et al. demonstrated that a high NLR could independently predict reduced survival in patients with PC, even after adjusting for ECOG-PS and disease stage [35]. A high NLR can reflect the imbalance between pro-tumor inflammatory responses and weakened antitumor immunity. Consistent with these findings, our study demonstrated the association of a higher GPS and an elevated NLR with inferior OS, underscoring the clinical relevance of systemic inflammation in PC. Integrating these easily accessible biomarkers with imaging-based assessments, such as PMI and FRPM, may enhance prognostic accuracy and support personalized treatment strategies. Future studies should investigate composite prognostic models that combine these indices in prospective cohorts.
These findings have potential implications for the development of future therapeutic strategies. Patients identified as sarcopenic or with a high FRPM may benefit from early intervention with nutritional supplementation, resistance exercises, and anti-inflammatory therapies. Anamorelin, a ghrelin receptor agonist, holds promise for improving appetite and lean body mass in patients with cancer cachexia [30,36], and its use in conjunction with systemic chemotherapy merits further exploration in patients with PC and sarcopenia. Clinical trials evaluating chemotherapy or novel agents for PC should consider stratifying patients by PMI or FRPM to control for host-related factors that may confound treatment efficacy. Incorporating body composition parameters into the trial design can enhance the interpretability of the results and help identify patient subgroups most likely to benefit from specific interventions.
This study has some limitations. First, its retrospective design introduces inherent risks of selection bias and limits the ability to establish causality. The decision to initiate GnP therapy and assessment of sarcopenia was not standardized across patients and may have been influenced by clinical judgment. Second, the sample size was small (n = 37), restricting the statistical power to detect subtle associations and limiting the generalizability of the findings. Despite the significance of the findings, they should be interpreted with caution and validated in larger prospective cohorts. Third, PMI and FRPM thresholds were determined based on the median values within the cohort. Although this approach is commonly used in exploratory studies, it may lead to information loss and limit generalizability. Nevertheless, it was selected to enhance clinical interpretability and maintain model stability given the limited sample size. Although ROC curve- or Youden index-derived cutoffs may be informative, such data-driven approaches can be unstable in small heterogeneous cohorts and were therefore not adopted. Consequently, the cutoff values used in this study should be regarded as exploratory, and the lack of external validation or standardized cutoff values may reduce comparability with other studies and limit clinical applicability. The median-based thresholds yielded in our cohort are comparable to those reported in previous Japanese studies supporting internal consistency across domestic cohorts [20]. However, international studies have applied different imaging definitions and cutoff strategies for both skeletal muscle quantity and quality, reflecting variability in population characteristics and CT acquisition protocols [29]. Therefore, multicenter and international validation using harmonized CT-based methodologies will be essential to establish standardized and broadly applicable reference ranges for these muscle-related parameters. Future studies with larger cohorts should validate our findings using continuous modeling or spline-based analyses. Fourth, although we analyzed imaging-based indices of sarcopenia, direct measures of physical function (e.g., grip strength and gait speed) were not included in our evaluation. The absence of these functional assessments limited our ability to correlate imaging-based indices with objective measures of muscle function. Future prospective studies should incorporate both functional and imaging-based evaluations to provide a more comprehensive assessment of sarcopenia and muscle quality. Fifth, PMI and FRPM were evaluated only at baseline prior to the initiation of chemotherapy, and longitudinal changes were not analyzed because of the retrospective design and limited availability of serial imaging. Future prospective studies with repeated body composition assessments are warranted to elucidate the prognostic impact of temporal changes in muscle mass and quality. Sixth, reproducibility of FRPM measurements was not assessed because all analyses were conducted by a single well-trained researcher. However, the segmentation protocol followed previously validated methods, and representative CT images illustrating the measurement procedure have been added to Figure 6. Seventh, the limited sample size restricted the number of covariates that could be included in the multivariate model. Although key clinical factors such as ECOG performance status, disease stage, relative dose intensity, and second-line therapy are important potential confounders, they were not included because of the small cohort size. Future studies with larger populations are needed to incorporate these variables and validate our findings. Finally, the impact of second-line treatment or best supportive care on survival outcomes is unclear. Variability in subsequent treatments could influence OS and may interact with baseline sarcopenia status.
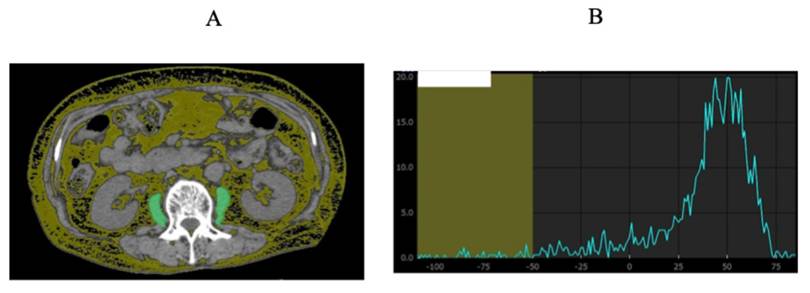
Representative CT images illustrating FRPM measurement and segmentation procedure at the level of the third lumbar vertebra (A). The sum of the areas within the left and right psoas muscles corresponding to fat (CT density: -200 to -50 HU) was quantified using Vincent®. The area under the curve corresponding to CT densities below -50 HU and the total area under the curve were calculated, and the fat ratio of the psoas muscle (FRPM) was derived as the proportion of fat area to the total psoas muscle area (B).
In conclusion, lower skeletal muscle mass and higher intramuscular fat infiltration were independently associated with poorer OS in patients with unresectable PC treated with GnPs. PMI and FRPM, assessed from routine CT imaging, serve as objective indicators of a patient's nutritional and metabolic conditions. As the cancer patient population continues to age, early identification of sarcopenia and myosteatosis is becoming increasingly important for optimizing treatment strategies. Incorporating body composition analyses into clinical practice may improve risk stratification and guide supportive interventions. Further prospective studies are warranted to validate these findings and assess whether targeting sarcopenia and muscle quality can improve clinical outcomes in this vulnerable population.
Abbreviations
PC: pancreatic cancer; OS: overall survival; GnP: gemcitabine plus nab-paclitaxel; PMI: psoas muscle mass index; FRPM: fat ratio within the psoas muscle; GPS: Glasgow Prognostic Score; NLR: neutrophil-to-lymphocyte ratio; ECOG-PS: Eastern Cooperative Oncology Group performance status; PD: progressive disease; BMI: body mass index; CI: confidence interval; HR: hazard ratio.
Acknowledgements
The authors thank all study participants, their families, physicians, nurses, medical writers, proofreaders, editors, and staff members who supported this research.
Author contributions
DO: Drafting of the manuscript; NM and TY: Conception, Design, and Formal Analysis. NM and TY: Collected data. KS and HH: Investigation and Resources. All Authors: Writing, review, and final approval of the manuscript.
Data availability statement
Research data supporting this study are not available in a specific repository. For data access, please contact the corresponding author. The data supporting the findings of this study are not publicly available because they contain information that could compromise the privacy of research participants, but are available from the co-author, T. Y., upon reasonable request.
Competing Interests
The authors have declared that no competing interest exists.
References
1. Stoffel EM, Brand RE, Goggins M. Pancreatic Cancer: Changing Epidemiology and New Approaches to Risk Assessment, Early Detection, and Prevention. Gastroenterology. 2023;164(5):752-765
2. Bray F, Laversanne M, Sung H. et al. Global cancer statistics 2022: GLOBOCAN estimates of incidence and mortality worldwide for 36 cancers in 185 countries. CA Cancer J Clin. 2024;74(3):229-263
3. Cai J, Chen H, Lu M. et al. Advances in the epidemiology of pancreatic cancer: trends, risk factors, screening, and prognosis. Cancer Lett. 2021;520:1-11
4. Hu JX, Zhao CF, Chen WB. et al. Pancreatic cancer: a review of epidemiology, trend, and risk factors. World J Gastroenterol. 2021;27(27):4298-4321
5. Ren S, Song L, Tian Y. et al. Emodin-conjugated PEGylation of Fe3O4 nanoparticles for FI/MRI dual-modal imaging and therapy in pancreatic cancer. Int J Nanomed. 2021;16:7463-7478
6. Shao Z, Zheng S, Chen C, Lyu J. Evaluation and prediction analysis of 3- and 5-year survival rates of patients with cecal adenocarcinoma based on period analysis. Int J Gen Med. 2021;14:7317-7327
7. Von Hoff DD, Ervin T, Arena FP. et al. Increased survival in pancreatic cancer with nab-paclitaxel plus gemcitabine. N Engl J Med. 2013;369(18):1691-1703
8. Cruz-Jentoft AJ, Baeyens JP, Bauer JM. et al. Sarcopenia:European consensus on definition and diagnosis:Report of the European Working Group on Sarcopenia in Older People. Age Ageing. 2010;39:412-423
9. Anjanappa M, Corden M, Green A. et al. Sarcopenia in cancer:Risking more than muscle loss. Tech Innov Patient Support Radiat Oncol. 2020;16:50-57
10. Chen LK, Woo J, Assantachai P. et al. Asian Working Group for Sarcopenia:2019 Consensus Update on Sarcopenia Diagnosis and Treatment. J Am Med Dir Assoc. 2020;21:300-307.e2
11. Williams GR, Rier HN, McDonald A, Shachar SS. Sarcopenia & aging in cancer. J Geriatr Oncol. 2019;10:374-377
12. Surov A, Wienke A. Prevalence of sarcopenia in patients with solid tumors:A meta-analysis based on 81,814 patients. JPEN J Parenter Enteral Nutr. 2022;46:1761-1768
13. Davis MP, Panikkar R. Sarcopenia associated with chemotherapy and targeted agents for cancer therapy. Ann Palliat Med. 2019;8:86-101
14. van Rijn-Dekker MI, van den Bosch L, van den Hoek JGM. et al. Impact of sarcopenia on survival and late toxicity in head and neck cancer patients treated with radiotherapy. Radiother Oncol. 2020;147:103-110
15. Vega MC, Laviano A, Pimentel GD. Sarcopenia and chemotherapy-mediated toxicity. Einstein (Sao Paulo). 2016;14(4):580-584
16. Huillard O, Mir O, Peyromaure M, Tlemsani C, Giroux J, Boudou-Rouquette P. et al. Sarcopenia and body mass index predict sunitinib-induced early dose-limiting toxicities in renal cancer patients. Br J Cancer. 2013;108(5):1034-1041
17. Sciorati C, Clementi E, Manfredi AA. Fat deposition and accumulation in the damaged and inflamed skeletal muscle: cellular and molecular players. Cell Mol Life Sci. 2015;72(11):2135-2156
18. Kitajima Y, Hyogo H, Sumida Y. et al. Severity of non-alcoholic steatohepatitis is associated with substitution of adipose tissue in skeletal muscle. J Gastroenterol Hepatol. 2013;28:1507-1514
19. Dolan RD, Almasaudi AS, Dieu LB. et al. The relationship between computed tomography-derived body composition, systemic inflammatory response, and survival in patients undergoing surgery for colorectal cancer. J Cachexia Sarcopenia Muscle. 2019;10:111-122
20. Ikegami T, Nishikawa H, Goto M, Shimamoto F, Terazawa T, Yamaguchi T, Yamasaki E, Asaishi K, Nakamura S, Higuchi K. Prognostic Impact of Ectopic Fat Deposition within Psoas Muscle in Stage IV Gastric Cancer Patients Undergoing Systemic Chemotherapy. J Cancer. 2022;13(13):3477-3484
21. Nishikawa H, Shiraki M, Hiramatsu A, Moriya K, Hino K, Nishiguchi S. Japan Society of. Hepatology guidelines for sarcopenia in liver disease (1st edition): Recommendation from the working group for creation of sarcopenia assessment criteria. Hepatol Res. 2016;46(10):951-963
22. McMillan DC. The systemic inflammation-based Glasgow Prognostic Score: a decade of experience in patients with cancer. Cancer Treat Rev. 2013;39(5):534-540
23. Aro R, Meriläinen S, Sirniö P. et al. Sarcopenia and Myosteatosis Are Associated with Neutrophil to Lymphocyte Ratio but Not Glasgow Prognostic Score in Colorectal Cancer Patients. J Clin Med. 2022;11(9):2656
24. Heshmat-Ghahdarijani K, Sarmadi V, Heidari A, Falahati Marvasti A, Neshat S, Raeisi S. The neutrophil-to-lymphocyte ratio as a new prognostic factor in cancers: a narrative review. Front Oncol. 2023;13:1228076
25. Bowen RC, Little NA, Harmer JR. et al. Neutrophil-to-lymphocyte ratio as prognostic indicator in cancer: systematic review and meta-analysis. Oncotarget. 2017;8(8):12351-12366
26. Lellouche L, Barat M, Pellat A, Leroux J, Corre F, Hallit R, Assaf A, Brezault C, Dhooge M, Soyer P, Coriat R. Impact of Sarcopenia on Survival in Patients Treated with FOLFIRINOX in a First-Line Setting for Metastatic Pancreatic Carcinoma. J Clin Med. 2023;12(6):2211
27. Wan Q, Wang Z, Zhao R, Tu T, Shen X, Shen Y, Li T, Chen Y, Song Y. CT-determined low skeletal muscle mass predicts worse overall survival of gastric cancer in patients with cachexia. Cancer Med. 2023;12(2):1492-1500
28. Láinez Ramos-Bossini AJ, Gámez Martínez A, Luengo Gómez D. et al. Computed Tomography-Based Sarcopenia and Pancreatic Cancer Survival — A Comprehensive Meta-Analysis Exploring the Influence of Definition Criteria, Prevalence, and Treatment Intention. Cancers. 2025;17(4):607
29. Tweed TTT, van der Veen A, Tummers S. et al. Body Composition Is a Predictor for Postoperative Complications After Gastrectomy for Gastric Cancer: a Prospective Side Study of the LOGICA Trial. J Gastrointest Surg. 2022;26(7):1373-1387
30. Nishikawa H, Goto M, Fukunishi S, Asai A, Nishiguchi S, Higuchi K. Cancer Cachexia: Its Mechanism and Clinical Significance. Int J Mol Sci. 2021;22(16):8491
31. Bilski J, Pierzchalski P, Szczepanik M, Bonior J, Zoladz JA. Multifactorial Mechanism of Sarcopenia and Sarcopenic Obesity. Role of Physical Exercise, Microbiota and Myokines. Cells. 2022;11(1):160
32. Lewis L, Thompson B, Stellmaker R, Koelmeyer L. Body composition and chemotherapy toxicities in breast cancer: a systematic review of the literature. J Cancer Surviv. 2025;19(3):914-929
33. Akazawa Y, Igawa S, Yamada K. et al. The Glasgow Prognostic Score Predicts Survival in Patients with Advanced Non-Small Cell Lung Cancer Harboring Sensitive Epidermal Growth Factor Receptor Mutations Who Are Treated with Epidermal Growth Factor Receptor-Tyrosine Kinase Inhibitors. Oncology. 2023;101(11):685-694
34. Stout NL, Santa Mina D, Lyons KD, Robb K, Silver JK. A systematic review of rehabilitation and. exercise recommendations in oncology guidelines. CA Cancer J Clin. 2021;71(2):149-175
35. García-Herrera JS, Muñoz-Montaño WR, López-Basave HN. et al. Combination of neutrophil-to-lymphocyte ratio and serum CA 19-9 as a prognostic factor in pancreatic cancer. J Gastrointest Oncol. 2024;15(4):1805-1819
36. Fujii H, Yamada Y, Iihara H, Kobayashi R, Suzuki A. Anamorelin in the Management of Cancer Cachexia: Clinical Efficacy, Challenges, and Future Directions. Anticancer Res. 2025;45(3):865-881
Author contact
![]() Corresponding author: Dr. Toshifumi Yamaguchi, Cancer Chemotherapy Center, Osaka Medical and Pharmaceutical University Hospital, 2-7, Daigaku-machi, Takatsuki, Osaka, 659-8686 Japan. Telephone: +81-6-72-683-1221; E-mail: toshifumi.yamaguchiac.jp
Corresponding author: Dr. Toshifumi Yamaguchi, Cancer Chemotherapy Center, Osaka Medical and Pharmaceutical University Hospital, 2-7, Daigaku-machi, Takatsuki, Osaka, 659-8686 Japan. Telephone: +81-6-72-683-1221; E-mail: toshifumi.yamaguchiac.jp