Impact Factor ISSN: 1837-9664

 Global reach, higher impact
J Cancer 2025; 16(9):2812-2821. doi:10.7150/jca.111548 This issue Cite
Research Paper
Diagnostic Value of Serum D-dimer, CA19-9, and CT Imaging Features in Pancreatic Ductal Adenocarcinoma and Benign Pancreatic Lesions
Yuan Li†, Yingying Cao†, Yaping Zhang†, Tao Zhou, Fan Xia, Shuai Ren ![]() , Zhongqiu Wang
, Zhongqiu Wang ![]()
Department of Radiology, Affiliated Hospital of Nanjing University of Chinese Medicine, Nanjing 210029, China.
†Yuan Li, Yingying Cao, and Yaping Zhang contributed equally to this work.
Received 2025-2-5; Accepted 2025-5-15; Published 2025-6-12
Abstract

Background: The distinction between pancreatic ductal adenocarcinoma (PDAC) and benign pancreatic lesions remains challenging. This study aimed to evaluate the utility of computed tomography (CT) imaging features and clinical characteristics in differentiating PDAC from benign pancreatic lesions.
Methods: In this retrospective study, a total of 97 patients with PDAC and 90 patients with benign pancreatic lesions were included. Various imaging features and clinical characteristics were assessed. Univariable and multivariable logistic regression analyses were conducted, and receiver operating characteristic (ROC) curves and their corresponding areas under the curve (AUCs) were assessed. The optimal cut-off value for D-dimer was determined using the Youden index. The DeLong test was employed to compare the AUCs of the ROC curves between different prediction models.
Results: The clinical and radiologic models achieved AUCs of 0.86 and 0.85, respectively. Moreover, the combined model demonstrated superior predictive performance compared to either model alone. This overall model included two significant clinical predictors (D-dimer and CA19-9) and three radiological predictors (lymph node enlargement, pancreatic atrophy, and cystic components). It yielded an AUC of 0.92 (95% CI: 0.88-0.95), with a sensitivity of 83.5% and specificity of 82.2%. In addition, the optimal cut-off value of D-dimer for differentiating PDAC from benign pancreatic lesions was found to be 0.84 mg/L.
Conclusions: The overall model including clinical and radiologic variables (e.g., serum D-dimer, CA19-9, lymph node enlargement, pancreatic atrophy, and cystic components) demonstrated higher sensitivity and specificity in differentiating PDAC from benign pancreatic lesions. Serum D-dimer may serve as a valuable adjunctive biomarker in the diagnosis of pancreatic cancer and may further enhance the diagnostic performance of CA19-9 when used in combination.
Keywords: computed tomography, pancreatic ductal adenocarcinoma, D-dimer, carbohydrate antigen 19-9
Introduction
Pancreatic cancer remains one of the most lethal malignancies of the digestive system, with pancreatic ductal adenocarcinomas (PDAC) accounting for approximately 90% of all cases. The 5-year survival rate for pancreatic cancer is only 13%, making it the third-leading cause of cancer death in both men and women [1]. Unfortunately, the incidence of pancreatic cancer continues to rise annually. A recent report predicts that, based on current trends, pancreatic cancer will become the second leading cause of cancer-related deaths by 2040 [2]. Although surgical resection remains the only potential curative treatment, most patients (> 80%) are diagnosed at an advanced stage, thus missing the opportunity for intervention [3]. Due to the absence of specific symptoms, early and accurate diagnosis of pancreatic cancer is challenging, not only for improving prognosis but also for preventing unnecessary invasive procedures in patients with benign pancreatic lesions.
Imaging evaluation plays a crucial role in the initial decision-making process for patients with PDAC. Multidetector computed tomography (MDCT) is the primary imaging modality for suspected cases, providing excellent spatial and temporal resolution, along with widespread accessibility [4]. The hallmark CT feature of PDAC is a hypoattenuating pancreatic mass. Secondary findings, including pancreatic duct dilatation, common bile duct dilatation, and pancreatic parenchymal changes, further support the diagnosis. When located in the pancreatic head, PDAC may obstruct both the pancreatic duct and the common bile duct, a phenomenon known as the “double duct” sign [5, 6]. However, certain benign pancreatic lesions can exhibit imaging features like those of PDAC. Chronic mass-forming pancreatitis can present as a hypoattenuating, mildly enhancing mass in the pancreatic head, making it difficult to distinguish from PDAC, especially when calcifications are present. Additionally, pancreatic neuroendocrine tumors (pNETs) display variable imaging features and may mimic PDAC when appearing hypovascular or exhibiting rim enhancement [7]. Moreover, PDAC with cystic degeneration and necrosis may exhibit imaging features that overlap with those of benign cystic-solid lesions, including intraductal papillary mucinous neoplasms (IPMNs), cystadenomas, and solid pseudopapillary tumors.
Serum carbohydrate antigen 19-9 (CA19-9) is a Lewis antigen belonging to the MUC1 protein family, expressed on the surface of cancer cells [8]. Currently, CA19-9 is recognized as the most prominent serological biomarker for diagnosing PDAC. However, studies evaluating its use as an auxiliary diagnostic tool have demonstrated that CA19-9 lacks sufficient specificity and sensitivity for effective screening [9]. CA19-9 is not exclusively expressed in PDAC; its level is also elevated in benign conditions, including liver cirrhosis, chronic pancreatitis, cholangitis, and bile duct obstruction [10]. Moreover, external factors, such as jaundice and other inflammatory conditions, can affect the accuracy of CA19-9. To enhance its diagnostic performance, CA19-9 has been evaluated in combination with various other biomarkers in research studies [11, 12].
Since Trousseau et al first identified the association between cancer and thrombosis in 1865, the interplay between cancer and the coagulation pathway has been the focus of extensive investigation [13]. Venous thrombosis has been recognized as the second leading cause of death in cancer patients, surpassed only by cancer progression [13]. It has been established that PDAC has a distinct ability to induce a hypercoagulable state, often presenting as subclinical abnormalities in conventional coagulation tests [14, 15]. D-dimer is a specific degradation product generated when crosslinked fibrin is degraded by plasmin, which plays a role in decomposing thrombus and maintaining vascular smoothness. It serves as a biomarker indicating the activation of coagulation and fibrinolysis. Elevated D-dimer levels have been reported in patients with pancreatic cancer [16]. Its value as an independent prognostic marker for PDAC is well-established, although few studies have explored its diagnostic accuracy in PDAC [17].
In this study, we aimed to develop a predictive model that combines clinical and imaging features to provide a valuable tool for the early screening and adjunctive diagnosis of PDAC.
Materials and Methods
Study patients
This study was approved by the institutional review board of the Affiliated Hospital of Nanjing University of Chinese Medicine, and patient informed consent was waived due to its retrospective design. The study comprised 97 patients with PDAC who were diagnosed through surgery or biopsy at the Affiliated Hospital of Nanjing University of Chinese Medicine from January 2016 to June 2022 (PDAC group). This group consisted of 48 males and 49 females, with a median age of 65.6 years (range: 47-83). Inclusion criteria were as follows: (1) patients with complete clinicopathological data, (2) patients with complete CT imaging data within 30 days before treatment, and (3) patients without distant metastasis. The exclusion criteria were: (1) patients with concurrent or prior malignant tumors, (2) patients with severe cardiovascular and cerebrovascular diseases, severe liver and kidney dysfunction, severe hematological and rheumatic immune system diseases, (3) a history of anticoagulant or antiplatelet drug use within 2 weeks before admission (Figure 1).
Flow diagram of patients' selection.
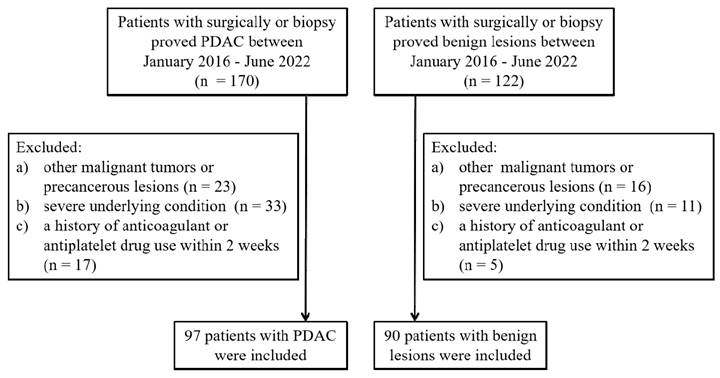
A total of 90 patients diagnosed with benign pancreatic diseases through surgery or biopsy (control group) were selected in the same period, consisting of 46 males and 44 females, with a median age of 63.0 years (range: 45-88). Among them, there were 17 chronic mass-forming pancreatitis, 23 pancreatic neuroendocrine tumors, 26 pancreatic cystadenomas, 19 intraductal papillary mucinous neoplasms, and 5 solid pseudopapillary tumors. Inclusion criteria were as follows: complete blood routine, coagulation function tests, and CT imaging examinations. Exclusion criteria were identical to those for PDAC (Figure 1).
Clinical variables
Basic information and clinical variables of the subjects in the two groups were collected, including age, sex, hypertension, diabetes, smoking, drinking, platelet count (PLT), activated partial thromboplastin time (APTT), prothrombin time (PT), thrombin time (TT), fibrinogen (FIB), serum D-dimer, and CA19-9.
All patients were hospitalized, and blood samples were obtained from both PDAC and benign pancreatic lesion patients during their initial visit. Five milliliters of peripheral blood were drawn into a citrate test tube for the measurement of APTT, PT, TT, and FIB. The samples were stored at -20℃ for up to 1 day and measured using an automatic coagulation analyzer. Serum D-dimer levels were determined by a latex-enhanced immunoturbidimetric assay using a Sysmex CA 7000 (Sysmex Corp, Kobe, Japan) analyzer. CA19-9 levels were measured using an automated electrochemical luminescence immunoassay. Levels exceeding 37 U/mL were considered elevated for CA19-9.
CT examination
All CT examinations were conducted using the Philips Brilliance 64 (Philips Healthcare, DA Best, the Netherlands) and Discovery HD750 (GE Healthcare, Milwaukee, Wisconsin, USA) following a standardized protocol. The CT scan parameters were as follows: tube voltage, 120 kVp; current, 200-400 mAs; pitch, 1.375; rotation speed, 0.75 s; slice thickness, 3.0 mm; slice interval, 3.0 mm; and a reconstruction interval of 1.25 mm. An initial cross-sectional nonenhanced CT scan was obtained, followed by a dynamic contrast-enhanced CT scan. The non-ionic contrast media Ultravist 300 (Bayer Schering Pharma AG, Berlin, Germany) was administrated intravenously (1.2-1.5 ml/kg) at a rate of 3.0 ml/s followed by 40 ml saline solution, using a power injector (Ulrich Medical, Ulm, Germany). After contrast agent injection, contrast-enhanced CT was performed in the arterial (35-40 seconds), portal venous (60-70 seconds), and delayed (110-130 seconds) phases. The scanning range extended from the level of the diaphragm to the pelvis.
CT image analysis
Two board-certified abdominal radiologists (Y.L. and Y.C., with more than 5 years of experience in abdominal radiology) blinded to the clinicopathologic data independently reviewed the anonymized CT images. In case of any disagreement, a consensus was reached through discussion or referral to a third radiologist (Y.Z., with 10 years of abdominal radiology experience). The following CT imaging features were evaluated: tumor location, tumor size, pancreatic duct dilatation, common bile duct dilatation, calcification, tumor margin (well-defined or ill-defined margin), vascular invasion, lymph node enlargement, pancreatic atrophy, cystic components, and enhancement degree.
The tumor location was classified as head, neck, body, or tail. Pancreatic duct dilatation was defined as a maximal diameter of the main duct greater than 3 mm or a dilatation exceeding 2 mm larger than the narrowest visible portion. Common bile duct dilatation was confirmed when the maximum diameter of the common bile duct was 8 mm or larger. The longest tumor diameter was measured on axial images. Calcification was identified on unenhanced phase images, with CT values exceeding 100 Hounsfield units. A well-defined margin was characterized by a smooth and clearly visible boundary, while an ill-defined margin was indicated by spiculation or infiltration along more than 90% of the tumor perimeter [18]. The criteria for vascular invasion included the presence of tumor thrombus, vessel occlusion, stenosis, or contour deformity, with more than half of the vessel perimeter in contact with the tumor [19]. Lymph node enlargement was defined as a short-axis diameter greater than 10 mm [20]. Parenchymal atrophy was considered present when the width of the upstream parenchyma was smaller than that of the normal pancreas [21]. Cystic components within the tumor were identified if unenhanced tissue comprised more than 50% of the tumor volume [19]. The degree of enhancement was classified into four levels: No enhancement was defined as an increase in CT value of less than 10 Hounsfield units; mild enhancement was defined as an increase between 10 and 30 Hounsfield units; moderate enhancement was defined as an increase between 30 and 50 Hounsfield units; and obvious enhancement was defined as an increase greater than 50 Hounsfield units.
Statistical analysis
The data were analyzed using SPSS 26.0 and MedCalc 20.0.27. Descriptive statistics were computed for all variables. Continuous data were presented as the mean ± standard deviation. Categorical variables were presented as the number of cases (percentage). The Shapiro-Wilk test was used to test normally distributed continuous variables. Student's t-test or U test was applied to analyze continuous variables, depending on the normality of data distribution, while the χ2 or Fisher's exact test was used for categorical variables. The receiver operating characteristic (ROC) curve was generated to determine the area under the curve (AUC), sensitivity, specificity, accuracy, positive predictive value (PPV), and negative predictive value (NPV). The optimal cut-off value was calculated using the Youden index (sensitivity+specificity-1). Logistic regression analysis was performed to evaluate the performance of the features in differentiating benign pancreatic lesions from PDAC and to establish a prediction model based on the results of multivariate logistic regression analysis. The DeLong test was used to assess the statistical difference between the AUCs of the two models. A two-sided P value <0.05 was considered statistically significant for all tests.
Results
Patient characteristics
The clinical characteristics of the PDAC and control cohorts are summarized in Table 1. A total of 97 patients with pathologically confirmed PDAC and 90 patients with pathologically confirmed benign pancreatic lesions were included and compared in this study. The results are as follows: no significant differences were found between the two groups in terms of age, sex, PLT, APTT, PT, TT, hypertension, diabetes, smoking, or drinking. The levels of D-dimer (2.96 vs. 0.94 mg/L) and FIB (4.26 vs. 3.66 g/L) were significantly higher in the PDAC group than in the control group. Additionally, the PDAC group tended to have elevated CA19-9 levels compared with the control group (70.1% vs. 17.8%). Multivariate logistic regression analysis of the clinical variables showed that D-dimer and CA19-9 are independent predictors for differentiating PDAC from benign pancreatic lesions (P = 0.002, P < 0.001, respectively) (Table S1).
Clinical characteristics
| Variables | PDAC group (n=97) | Control group (n=90) | p value |
|---|---|---|---|
| Age (years)* | 65.6 ± 9.77 | 63.0 ± 10.2 | 0.083 |
| Sex | 0.824 | ||
| Male | 48 (49.5) | 46 (51.1) | |
| Female | 49 (50.5) | 44 (48.9) | |
| Serum D-dimer (mg/L)* | 2.96 ± 3.45 | 0.94 ± 0.98 | < 0.001 |
| FIB (g/L) | 4.26 ± 0.91 | 3.66 ± 1.06 | < 0.001 |
| CA19-9 level (U/mL)* | < 0.001 | ||
| ≥37 | 68 (70.1) | 16 (17.8) | |
| <37 | 29 (29.9) | 74 (82.2) | |
| PLT (10^9/L)* | 186.7 ± 61.2 | 184.8 ± 62.7 | 0.839 |
| APTT (s)* | 37.1 ± 4.99 | 37.8 ± 4.51 | 0.336 |
| PT (s)* | 13.7 ± 1.33 | 13.7 ± 2.02 | 0.827 |
| TT (s)* | 17.0 ± 1.47 | 17.2 ± 1.34 | 0.280 |
| Hypertension | 0.772 | ||
| Yes | 31 (32.0) | 27 (30.0) | |
| No | 66 (68.0) | 63 (70.0) | |
| Diabetes | 0.267 | ||
| Yes | 11 (11.3) | 6 (6.7) | |
| No | 86 (88.7) | 84 (93.3) | |
| Smoking | 0.545 | ||
| Yes | 16 (16.5) | 12 (13.3) | |
| No | 81 (83.5) | 78 (86.7) | |
| Drinking | 0.890 | ||
| Yes | 25 (25.8) | 24 (26.7) | |
| No | 72 (74.2) | 66 (73.3) |
Note: Data are numbers of lesions with percentages. FIB fibrinogen, CA19-9 carbohydrate antigen 19-9, PLT platelet, APTT activated partial thromboplastin time, PT prothrombin time, TT thrombin time
*Data are mean ± standard deviation
Comparison of imaging features between PDAC and benign pancreatic lesions
Imaging findings between PDAC and benign pancreatic lesions are summarized in Table 2. Descriptive statistics showed that cystic components (63.3% vs. 24.7%), a well-defined margin (67.8% vs. 33.0%), and moderate to significant enhancement (30.0% vs. 14.4%) were more common in benign pancreatic lesions than in PDAC. Pancreatic duct dilatation (63.9% vs. 35.6%), common bile duct dilatation (36.1% vs. 14.4%), vascular invasion (43.3% vs. 27.8%), lymph node enlargement (33.0% vs. 6.7%), and pancreatic atrophy (34.0% vs. 7.8%) were significantly more frequent in PDAC than in benign pancreatic lesions. No significant differences were found in tumor location, tumor size, or calcification between the two groups. Multivariate logistic regression analysis of the imaging variables showed that tumor margin, lymph node enlargement, pancreatic atrophy, cystic components, and enhancement degree are potential independent predictors for differentiating PDAC from benign pancreatic lesions (P = 0.006, P = 0.001, P = 0.001, P = 0.002, P = 0.047, respectively) (Table S2).
Imaging variables
| Variables | PDAC group (n=97) | Control group (n=90) | p value |
|---|---|---|---|
| Location | 0.934 | ||
| Head/neck | 62 (63.9) | 57 (63.3) | |
| Body/tail | 35 (36.1) | 33 (36.7) | |
| Diameter (mm)* | 35.5 ± 17.5 | 31.1 ± 16.8 | 0.079 |
| Calcification | 0.052 | ||
| Yes | 5 (5.2) | 12 (13.3) | |
| No | 92 (94.8) | 78 (86.7) | |
| PD dilatation | < 0.001 | ||
| Yes | 62 (63.9) | 32 (35.6) | |
| No | 35 (36.1) | 58 (64.4) | |
| CBD dilatation | 0.001 | ||
| Yes | 62 (63.9) | 13 (14.4) | |
| No | 35 (36.1) | 77 (85.6) | |
| Tumor margin | < 0.001 | ||
| well-defined | 32 (33.0) | 61 (67.8) | |
| ill-defined | 65 (67.0) | 29 (32.2) | |
| Vascular invasion | 0.027 | ||
| Yes | 42 (43.3) | 25 (27.8) | |
| No | 55 (56.7) | 65 (72.2) | |
| Lymph node enlargement | < 0.001 | ||
| Yes | 65 (67.0) | 6 (6.7) | |
| No | 32 (33.0) | 84 (93.3) | |
| Pancreatic atrophy | < 0.001 | ||
| Yes | 33 (34.0) | 7 (7.8) | |
| No | 64 (66.0) | 83 (92.2) | |
| Cystic components | < 0.001 | ||
| Yes | 24 (24.7) | 57 (63.3) | |
| No | 73 (75.3) | 33 (36.7) | |
| Enhancement degree | 0.010 | ||
| No/Mild | 83 (85.6) | 63 (70.0) | |
| Moderate/Significant | 14 (14.4) | 27 (30.0) |
Note: Data are numbers of lesions with percentages. PD pancreatic duct, CBD common bile duct
*Data are mean ± standard deviation
Clinical model
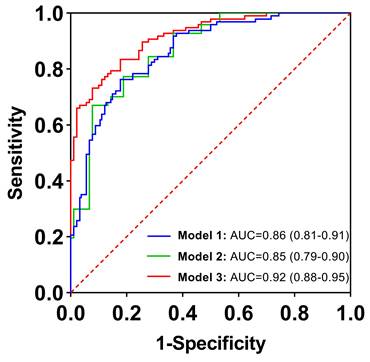
Among the 13 clinical features assessed, two independent predictors, CA19-9 and serum D-dimer, were identified. The AUC values for CA19-9 and serum D-dimer were 0.76 (95% CI: 0.69-0.83) and 0.76 (95% CI: 0.69-0.83), respectively. The sensitivities were 70.1% and 72.2%, while the specificities were 82.2% and 71.1%, respectively. The accuracies were 75.9% and 71.7%, with positive predictive values (PPVs) of 80.9% and 72.9%, and negative predictive values (NPVs) of 71.8% and 70.4%. The optimal cut-off value for serum D-dimer to differentiate benign pancreatic lesions from PDAC was 0.84 mg/L, according to the Youden index. The combined model, referred to as Model 1, incorporating these two indicators, yielded an AUC value of 0.86 (95% CI: 0.81-0.91), with 76.3% sensitivity, 82.2% specificity, 79.1% accuracy, 82.2% PPV, and 76.3% NPV, respectively.
Radiologic model
Among the imaging variables assessed, five independent predictors for the risk of PDAC were identified: tumor margin, lymph node enlargement, pancreatic atrophy, cystic components, and enhancement degree. The AUC values for these predictors were 0.67 (95% CI: 0.60-0.75), 0.63 (95% CI: 0.55-0.71), 0.63 (95% CI: 0.55-0.71), 0.69 (95% CI: 0.62-0.77), and 0.58 (95% CI: 0.50-0.66), respectively. Sensitivities ranged from 33.0% to 85.6%, while specificities ranged from 30.0% to 93.3%. The accuracies varied from 58.8% to 69.5%, with PPVs ranging from 56.9% to 84.1% and NPVs ranging from 56.4% to 70.4%. When these five indicators were combined to differentiate PDAC from benign pancreatic lesions, the AUC reached a maximum value of 0.85 (95% CI: 0.79-0.90). The sensitivity, specificity, accuracy, PPV, and NPV of the combined model, referred to as Model 2, were 70.1%, 85.6%, 77.6%, 84.0%, and 72.6%, respectively. These values were all higher than those of each single indicator.
Overall model (combined clinical and radiologic models)
When clinical and imaging indicators were combined, five indicators were identified as independent predictors based on the results of multivariable logistic regression in Table 3: CA19-9, serum D-dimer, lymph node enlargement, pancreatic atrophy, and cystic components. The combined model, incorporating these five indicators, was named Model 3. The AUC value was 0.92 (95% CI: 0.88-0.95), the sensitivity was 83.5%, the specificity was 82.2%, the accuracy was 82.9%, the PPV was 83.5%, and the NPV was 82.2%. There was a significant difference in AUCs between Model 3 and the other two models according to the DeLong test (P = 0.0067, P = 0.0038, respectively) (Table 4; Figure 2). The clinical applications of Model 3 were illustrated in Figure 3 and Figure 4, with the predicted results of the model aligning with the pathological findings.
Univariable and multivariable logistic regression analysis of potential predictors
| Univariable | Multivariable | |||
|---|---|---|---|---|
| OR (95% CI) | p value | OR (95% CI) | p value | |
| Clinical variables | ||||
| Serum D-dimer (mg/L) | 1.79 (1.36, 2.36) | <0.001 | 1.67 (1.18, 2.36) | 0.004 |
| FIB (g/L) | 1.93 (1.37, 2.72) | <0.001 | 1.38 (0.86, 2.21) | 0.184 |
| CA19-9 level (U/mL) | 10.9 (5.40, 21.7) | <0.001 | 9.38 (3.58, 24.6) | <0.001 |
| Imaging variables | ||||
| PD dilatation | 3.21 (1.77, 5.84) | <0.001 | 2.67 (0.97, 7.37) | 0.057 |
| CBD dilatation | 3.34 (1.63, 6.86) | 0.001 | 2.74 (0.91, 8.29) | 0.074 |
| Tumor margin | 4.27 (2.32, 7.88) | <0.001 | 1.66 (0.65, 4.24) | 0.292 |
| Vascular invasion | 1.99 (1.08, 3.66) | 0.028 | 0.64 (0.23, 1.81) | 0.402 |
| Lymph node enlargement | 6.89 (2.72, 17.5) | <0.001 | 3.82 (1.06, 13.8) | 0.041 |
| Pancreatic atrophy | 6.11 (2.54, 14.7) | <0.001 | 7.06 (1.93, 25.8) | 0.003 |
| Cystic components | 0.19 (0.10, 0.36) | <0.001 | 0.23 (0.08, 0.63) | 0.004 |
| Enhancement degree | 0.39 (0.19, 0.81) | 0.012 | 0.34 (0.10, 1.20) | 0.095 |
Note: FIB fibrinogen, CA19-9 carbohydrate antigen 19-9, PD pancreatic duct, CBD common bile duct, OR odds ratio, CI confidence interval
Diagnostic performance of prediction models
| AUC* | Sensitivity | Specificity | Accuracy | PPV | NPV | |
|---|---|---|---|---|---|---|
| Model 1 | 0.86 (0.81, 0.91) | 76.3 | 82.2 | 79.1 | 82.2 | 76.3 |
| Model 2 | 0.84 (0.79, 0.90) | 70.1 | 85.6 | 77.6 | 84.0 | 72.6 |
| Model 3 | 0.92 (0.88, 0.95) | 83.5 | 82.2 | 82.9 | 83.5 | 82.2 |
Note: Except where indicated, data are percentages, with numbers of patients in parentheses. Performance is presented as AUC, sensitivity, and specificity values according to the optimal selected cut-off. AUC = area under the receiver operating characteristic curve, PPV = positive predictive value, NPV = negative predictive value.
* Data are AUCs, with 95% CIs in parentheses.
Receiver operating characteristic curves for diagnostic performance in distinguishing between benign pancreatic lesions and pancreatic cancer with clinical (Model 1), imaging (Model 2), and combination of clinical and imaging features (Model 3). The areas under the curve were 0.86, 0.85, and 0.92, respectively.
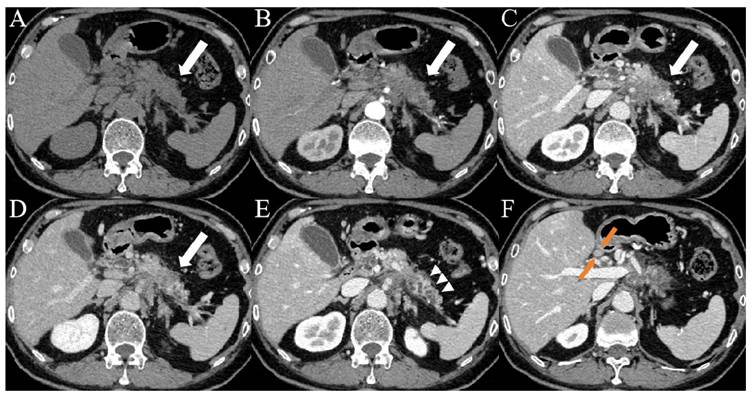
Images from a patient with PDAC. (A-D) CT images showed patchy areas of low density within the body of the pancreas (white arrows) with a hypovascular pattern, the margin of which was ill-defined. (E) Contrast-enhanced CT images during the portal venous phase showed duct dilatation and marked tail atrophy (arrowheads). (F) CT imaging showed a significantly enlarged lymph node (orange arrows) in the hepatogastric space, with a short axis measuring approximately 1.1 cm. The patient's CA19-9 level was 78.3 U/mL (> 37 U/mL), and the D-dimer level was 14.7 mg/L (> 0.84 mg/L).
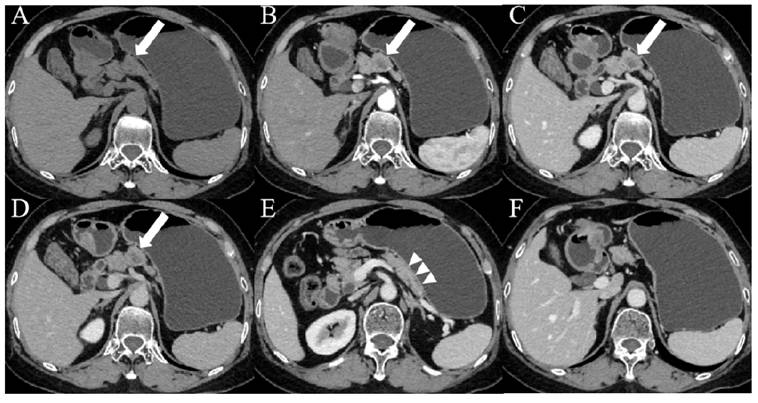
Images from a patient with pNET G2. (A-D) CT images showed a nodular, slightly enhanced area (white arrows) in the body of the pancreas, with internal cystic non-enhancing regions and an indistinct margin. (E) CT imaging showed a normal pancreatic tail without atrophy (arrowheads). (F) The fat spaces around the pancreas were clear, with no markedly enlarged lymph nodes. The patient's CA19-9 level was 19.6 U/mL (< 37 U/mL), and the D-dimer level was 0.23 mg/L (< 0.84 mg/L).
Discussion
Early detection of surgically resectable neoplasms remains the most effective strategy for improving PDAC survival rates and achieving potential cure. Most long-term survivors are typically diagnosed at Stage I through incidental imaging findings, often presenting with smaller tumors that are associated with better survival outcomes [3, 22]. However, the relatively low prevalence of pancreatic cancer compared to other lethal malignancies has limited the widespread implementation of pancreas surveillance programs [23]. Therefore, there is an urgent need for more efficient, accurate, and less invasive diagnostic methods to expedite treatment initiation and minimize unnecessary interventions [24].
Our study demonstrated that CA19-9, serum D-dimer, lymph node enlargement, pancreatic atrophy, and cystic components are statistically significant independent variables for distinguishing PDAC from benign pancreatic lesions. The clinical-radiologic model incorporating these five indicators exhibits superior diagnostic performance compared to standalone clinical or imaging models, as reflected by the AUC values. Additionally, we found that serum D-dimer holds significant clinical value in the differential diagnosis of PDAC, with an optimal diagnostic cut-off of 0.84 mg/L, a novel finding not reported in previous studies. In addition, the combined use of D-dimer and CA19-9 can enhance the diagnostic value of CA19-9.
CA19-9 is widely used as a serum biomarker for pancreatic cancer detection, but its utility is limited by several factors. Its sensitivity is low, as elevated levels are typically observed in the later stages of the disease. Furthermore, its specificity is suboptimal, as CA19-9 levels can also rise in non-pancreatic cancers and benign conditions. Additionally, approximately 10% of the population is genetically negative for CA19-9 [25]. However, recent studies have demonstrated that setting cutoff levels of CA19-9 based on single nucleotide polymorphisms (SNPs) improves CA19-9's diagnostic sensitivity for resectable-stage pancreatic cancer, increasing it from 53% to 61% at 99% specificity [26]. To further enhance the diagnostic accuracy of CA19-9, its combined use with imaging factors has been investigated in several studies [27].
Durczynski et al compared plasma D-dimer levels in portal and peripheral blood from pancreatic cancer patients without venous thromboembolism, and found that the mean D-dimer values were higher in portal than in peripheral blood. Their findings showed a close association between the activation of hemostasis, reflected by elevated D-dimers in portal blood, and the presence of pancreatic cancer. Moreover, measuring D-dimer levels in portal blood may represent a promising approach for pancreatic cancer screening [28]. Li et al conducted a comprehensive analysis of conventional coagulation and thromboelastography indicators in benign and malignant pancreatic diseases. They found that FIB, D-dimer, maximum amplitude, Angle, and coagulation index were effective in the early diagnosis of PDAC. Furthermore, they discovered that combining CA19-9 with coagulation indicators could significantly improve the early diagnostic performance of CA19-9 [29].
Pancreatic cancer is highly malignant and prone to early metastasis, with the lymphatic system serving as a major route for metastasis. Lymph node metastases are observed in 50-70% of pancreatic cancer patients, likely due to the dense lymphatic networks surrounding the pancreas [30]. This is commonly manifested as enlarged lymph nodes around the pancreas on imaging. In addition, the pancreas distal to the tumor often shows signs of atrophy. PDAC triggers a process in which the acinar cell layer thins due to disrupted flow within the pancreatic duct. This thinning results in cell death, either by apoptosis or necrosis. The loss of acinar cells then leads to fibrotic changes and immune cell infiltration. These alterations collectively manifest as pancreatic parenchymal atrophy [31]. Miura et al examined 20 patients who had undergone pancreatectomy for a single localized stricture of the main pancreatic duct, with no identifiable masses on imaging. The cohort was divided into two groups: 10 patients diagnosed with pancreatic ductal adenocarcinoma (cancer group) and 10 patients with benign strictures (benign group). Computed tomography revealed that focal parenchymal atrophy and fat replacement were more frequently observed in the cancer group (7/10) compared to the benign group (1/10) (P = 0.02). These findings suggest that focal parenchymal atrophy and fat replacement may serve as indicators for the early detection of pancreatic cancer [32]. Yamao K et al assessed the CT findings associated with small pancreatic cancer (≤10 mm in diameter), including carcinoma in situ (CIS), and compared them to benign main pancreatic duct (MPD) stenosis. They found that partial pancreatic parenchymal atrophy (PPA), upstream PPA, and MPD abrupt stenosis on CT images were highly suggestive of small pancreatic cancers, including CIS [33].
PDAC is one of the most aggressive solid tumors in humans. Histologically, it is characterized by a dense stromal matrix composed of various cellular and acellular components. This stromal matrix, often referred to as a desmoplastic reaction or tumor microenvironment, is relatively dense and lacks a cystic structure, making cystic changes less likely [34]. Therefore, on CT scans, PDAC typically appears as a mildly enhancing mass with soft tissue density.
PDAC is frequently located in the head of the pancreas, where mass compression often results in ductal obstruction and secondary dilation of both the common bile duct and pancreatic duct [5, 6]. In our study, bile duct and pancreatic duct dilation were significantly more common in pancreatic cancer compared to benign pancreatic lesions (36.1% vs. 14.4%, 63.9% vs. 35.6%, respectively). Given the strong potential correlation between the bile duct and pancreatic duct dilation, both variables were excluded from the multifactorial regression analysis.
There are some limitations to our study. Due to its retrospective nature, selection bias was inevitable. Moreover, in comparing benign and malignant pancreatic lesions, we included only pancreatic ductal adenocarcinoma in the malignant group, as other pathological types of pancreatic cancer are relatively rare. In future studies, we plan to expand the sample size and incorporate other types of pancreatic cancer for more comprehensive analyses. Finally, we did not include CT data from normal tissues. Incorporating normal tissues as a comparison group would enhance the comprehensive analysis of the imaging characteristics of pancreatic cancer for the differences between normal tissues and benign lesions. Therefore, our future studies will consider including normal tissues as a comparison group to further investigate the imaging differences among pancreatic cancer, normal tissues, and benign pancreatic lesions. Finally, a multicenter program involving more patients is needed, and external validation is required to confirm the robustness and generalizability of our model.
In conclusion, our study demonstrates that a combined clinical-radiologic model incorporating serum D-dimer, CA19-9, lymph node enlargement, pancreatic atrophy, and cystic components shows high sensitivity and specificity in differentiating between PDAC and benign pancreatic lesions. This predictive model holds potential as a valuable decision support tool for clinicians and radiologists, aiding in the early detection of pancreatic cancer and potentially improving patient prognosis.
Abbreviations
CT: computed tomography; PDAC: pancreatic ductal adenocarcinoma; CA19-9: carbohydrate antigen 19-9; ROC: receiver operating characteristic; AUC: area under the curve; pNET: pancreatic neuroendocrine tumor; PLT: platelet; APTT: activated partial thromboplastin time; PT: prothrombin time; TT: thrombin time; FIB: fibrinogen; PD: pancreatic duct; CBD: common bile duct; PPV: positive predictive value; NPV: negative predictive value; OR: odds ratio; CI: confidence interval.
Supplementary Material
Supplementary tables.
Acknowledgements
We would like to thank all participants of this study.
Funding
This research was funded by the National Natural Science Foundation of China (82371919, 82171925, 82202135), Young Elite Scientists Sponsorship Program by China Association of Chinese Medicine (2024-QNRC2-B16), Project funded by China Postdoctoral Science Foundation (2023M741808), Young Elite Scientists Sponsorship Program by Jiangsu Association for Science and Technology (JSTJ-2023-WJ027), Project funded by Nanjing Postdoctoral Science Foundation, Foundation of Excellent Young Doctor of Jiangsu Province Hospital of Chinese Medicine (2023QB0112), Natural Science Foundation of Nanjing University of Chinese Medicine (XZR2023036), and the Open Project of Jiangsu Provincial Science and Technology Resources (Clinical Resources) Coordination Service Platform (TC2023B003).
Ethics approval and consent to participate
This study was approved by the institutional review board of the Affiliated Hospital of Nanjing University of Chinese Medicine and patient informed consent was waived due to its retrospective nature.
Availability of data and materials
Datasets used in this analysis are available from the corresponding authors on a reasonable request.
Author contributions
(I) Conception and design: Zhongqiu Wang, Shuai Ren, and Yuan Li; (II) Provision of study materials or patients: Zhongqiu Wang, Shuai Ren, Yuan Li, and Yingying Cao; (III) Collection and assembly of data: Yuan Li, Yingying Cao, and Yaping Zhang; (IV) Run of experiments: Yuan Li, Yingying Cao, Tao Zhou, and Fan Xia; (V) Data analysis and interpretation: Yuan Li, Yingying Cao, and YaPing Zhang; (VI) Manuscript writing: All authors; (VII) Final approval of manuscript: All authors.
Competing Interests
The authors have declared that no competing interest exists.
References
1. Siegel RL, Giaquinto AN, Jemal A. Cancer statistics, 2024. CA Cancer J Clin. 2024;74(1):12-49
2. Rahib L, Wehner MR, Matrisian LM. et al. Estimated Projection of US Cancer Incidence and Death to 2040. JAMA Netw Open. 2021;4(4):e214708
3. Stoffel EM, Brand RE, Goggins M. Pancreatic Cancer: Changing Epidemiology and New Approaches to Risk Assessment, Early Detection, and Prevention. Gastroenterology. 2023;164(5):752-765
4. Al-Hawary MM, Francis IR, Chari ST. et al. Pancreatic ductal adenocarcinoma radiology reporting template: consensus statement of the Society of Abdominal Radiology and the American Pancreatic Association. Radiology. 2014;270(1):248-260
5. Mizrahi JD, Surana R, Valle JW. et al. Pancreatic cancer. Lancet. 2020;395(10242):2008-2020
6. Gonoi W, Hayashi TY, Okuma H. et al. Development of pancreatic cancer is predictable well in advance using contrast-enhanced CT: a case-cohort study. Eur Radiol. 2017;27(12):4941-4950
7. Miller FH, Lopes Vendrami C, Hammond NA. et al. Pancreatic Cancer and Its Mimics. Radiographics. 2023;43(11):e230054
8. Mayerle J, Kalthoff H, Reszka R. et al. Metabolic biomarker signature to differentiate pancreatic ductal adenocarcinoma from chronic pancreatitis. Gut. 2018;67(1):128-137
9. O'Neill RS, Stoita A. Biomarkers in the diagnosis of pancreatic cancer: Are we closer to finding the golden ticket? World J Gastroenterol. 2021;27(26):4045-4087
10. Kaur S, Smith LM, Patel A. et al. A Combination of MUC5AC and CA19-9 Improves the Diagnosis of Pancreatic Cancer: A Multicenter Study. Am J Gastroenterol. 2017;112(1):172-183
11. Xiao D, Dong Z, Zhen L. et al. Combined Exosomal GPC1, CD82, and Serum CA19-9 as Multiplex Targets: A Specific, Sensitive, and Reproducible Detection Panel for the Diagnosis of Pancreatic Cancer. Mol Cancer Res. 2020;18(2):300-310
12. Zhao B, Zhao B, Chen F. Diagnostic value of serum carbohydrate antigen 19-9 in pancreatic cancer: a systematic review and meta-analysis. Eur J Gastroenterol Hepatol. 2022;34(9):891-904
13. Campello E, Bosch F, Simion C. et al. Mechanisms of thrombosis in pancreatic ductal adenocarcinoma. Best Pract Res Clin Haematol. 2022;35(1):101346
14. Campello E, Ilich A, Simioni P. et al. The relationship between pancreatic cancer and hypercoagulability: a comprehensive review on epidemiological and biological issues. Br J Cancer. 2019;121(5):359-371
15. Willems RAL, Biesmans C, Campello E. et al. Cellular Components Contributing to the Development of Venous Thrombosis in Patients with Pancreatic Cancer. Semin Thromb Hemost. 2024;50(3):429-442
16. Nagy Z, Horváth O, Kádas J. et al. D-dimer as a potential prognostic marker. Pathol Oncol Res. 2012;18(3):669-674
17. Zhifei L, Yuexiang L, Shaofei C. et al. Elevated preoperative plasma D-dimer level was an independent prognostic factor for patients with PDAC after curative resection: a retrospective analysis. Jpn J Clin Oncol. 2023;53(11):1058-1067
18. Belousova E, Karmazanovsky G, Kriger A. et al. Contrast-enhanced MDCT in patients with pancreatic neuroendocrine tumours: correlation with histological findings and diagnostic performance in differentiation between tumour grades. Clin Radiol. 2017;72(2):150-158
19. Kim DW, Kim HJ, Kim KW. et al. Neuroendocrine neoplasms of the pancreas at dynamic enhanced CT: comparison between grade 3 neuroendocrine carcinoma and grade 1/2 neuroendocrine tumour. Eur Radiol. 2015;25(5):1375-1383
20. Choi SH, Kim HJ, Kim SY. et al. Computed Tomography Features Predictive of Lymph Node Involvement in Patients With a Nonfunctioning Pancreatic Neuroendocrine Tumor. Pancreas. 2017;46(8):1056-1063
21. Kim SW, Kim SH, Lee DH. et al. Isolated Main Pancreatic Duct Dilatation: CT Differentiation Between Benign and Malignant Causes. AJR Am J Roentgenol. 2017;209(5):1046-1055
22. Dbouk M, Katona BW, Brand RE. et al. The Multicenter Cancer of Pancreas Screening Study: Impact on Stage and Survival. J Clin Oncol. 2022;40(28):3257-3266
23. Force USPST, Owens DK, Davidson KW. et al. Screening for Pancreatic Cancer: US Preventive Services Task Force Reaffirmation Recommendation Statement. JAMA. 2019;322:438-444
24. Boyd LNC, Ali M, Comandatore A. et al. Prediction Model for Early-Stage Pancreatic Cancer Using Routinely Measured Blood Biomarkers. JAMA Netw Open. 2023;6(8):e2331197
25. Chan A, Prassas I, Dimitromanolakis A. et al. Validation of biomarkers that complement CA19.9 in detecting early pancreatic cancer. Clin Cancer Res. 2014;20(22):5787-5795
26. Abe T, Koi C, Kohi S. et al. Gene Variants That Affect Levels of Circulating Tumor Markers Increase Identification of Patients With Pancreatic Cancer. Clin Gastroenterol Hepatol. 2020;18(5):1161-1169.e5
27. Su J, Wang Y, Shao H. et al. Value of multi-detector computed tomography combined with serum tumor markers in diagnosis, preoperative, and prognostic evaluation of pancreatic cancer. World J Surg Oncol. 2022;20(1):323
28. Durczyński A, Szymański D, Nowicki M. et al. Very high concentration of D-dimers in portal blood in patients with pancreatic cancer. Pol Przegl Chir. 2012;84(10):521-525
29. Jiaao L, Wanli G, Kai Z. et al. Coagulation parameters for the differential diagnosis of pancreatic cancer in the early stage: a retrospective study. Eur J Med Res. 2023;28(1):436
30. Yamada M, Sugiura T, Okamura Y. et al. Clinical Implication of Node-negative Resectable Pancreatic Cancer. Ann Surg Oncol. 2021;28(4):2257-2264
31. Tomita Y, Azuma K, Nonaka Y. et al. Pancreatic fatty degeneration and fibrosis as predisposing factors for the development of pancreatic ductal adenocarcinoma. Pancreas. 2014;43(7):1032-1041
32. Miura S, Kume K, Kikuta K. et al. Focal Parenchymal Atrophy and Fat Replacement Are Clues for Early Diagnosis of Pancreatic Cancer with Abnormalities of the Main Pancreatic Duct. Tohoku J Exp Med. 2020;252(1):63-71
33. Yamao K, Takenaka M, Ishikawa R. et al. Partial Pancreatic Parenchymal Atrophy Is a New Specific Finding to Diagnose Small Pancreatic Cancer (≤10 mm) Including Carcinoma in Situ: Comparison with Localized Benign Main Pancreatic Duct Stenosis Patients. Diagnostics (Basel). 2020;10(7):445
34. Hessmann E, Buchholz SM, Demir IE. et al. Microenvironmental Determinants of Pancreatic Cancer. Physiol Rev. 2020;100(4):1707-1751
Author contact
![]() Corresponding authors: Zhongqiu Wang, zhongqiuwangedu.cn; Shuai Ren, shuairenedu.cn.
Corresponding authors: Zhongqiu Wang, zhongqiuwangedu.cn; Shuai Ren, shuairenedu.cn.