Impact Factor ISSN: 1837-9664

 Global reach, higher impact
J Cancer 2025; 16(5):1519-1537. doi:10.7150/jca.103523 This issue Cite
Research Paper
The Role of MATN3 in Cancer Prognosis and Immune Infiltration Across Multiple Tumor Types
Chongjiu Qin1, Haifei Qin1, Haixiang Xie1, Yuhua Li1, Aoyang Bi1, Xiwen Liao1, Kejian Yang1, Chunmiao Lu1, Tao Peng1,2 ![]() , Guangzhi Zhu1,2
, Guangzhi Zhu1,2 ![]()
1. Department of Hepatobiliary Surgery, The First Affiliated Hospital of Guangxi Medical University, Nanning, 530021, Guangxi Zhuang Autonomous Region, People's Republic of China.
2. Guangxi Key Laboratory of Enhanced Recovery after Surgery for Gastrointestinal Cancer, 530021, Nanning, People's Republic of China.
3. Key Laboratory of early Prevention & Treatment for regional High Frequency Tumor (Guangxi Medical University), Ministry of Education, Nanning, 530021, Guangxi Zhuang Autonomous Region, People's Republic of China.
#Chongjiu Qin and Haifei Qin contribute equally to this work.
Received 2024-9-11; Accepted 2025-1-8; Published 2025-1-27
Abstract

Background: MATN3 is a member of the matrix protein family and is involved in the regulation of osteoarthritis as well as the development of gastric cancer. We investigated the role of MATN3 in pan-cancer and validated this result by in vitro experiments.
Material and Methods: We applied multiple databases to explore the expression of MATN3 in 33 types of tumors. Kaplan-Meier survival analysis is performed to understand the effect of MATN3 on Prognostic value in patients with different cancer types. The TIMER database was applied to explore the relationship between MATN3 and immune checkpoint genes, immunomodulatory genes, and immune infiltration, the Sanger box was applied to explore the relationship between MATN3 and methylation, the Genomic Cancer Analysis database was utilized to explore the relationship between MATN3 expression and pharmacological sensitivity, and the STRING database was used to explore the co-expressed genes and to complete the Gene Ontology and Kyoto Encyclopedia of Genes and Genomes pathway enrichment analysis. Data from The Cancer Genome Atlas as well as Genotype-Tissue Expression databases were statistically analyzed and visualized using the R software. Immunohistochemistry and Western blotting for detection of MATN3 expression. CCK-8 and clone formation were used to detect cell proliferation, Wound-healing assay and transwell invasion were used to detect cell migration and invasion ability.
Results: MATN3 is overexpressed in most cancer types, indicating a poorer prognosis. It is closely linked to methylation, immunomodulatory genes, and immune checkpoint genes, contributing to immune infiltration in various cancer types. In vitro experiments showed that silencing MATN3 inhibited cell proliferation, migration, and invasion ability.
Conclusions: MATN3 is involved in the immune infiltration of cancer and affects the prognosis of many cancer types, and can be used as an immune as well as prognostic biomarker for pan-cancer.
Keywords: MATN3, pan-cancer, immunization, diagnosis, prognosis
Introduction
According to the World Health Organization's (WHO) annual report in 2022, there were an estimated 20 million new cancer cases and 9.7 million cancer deaths globally, making cancer the leading cause of human death[1]. Current tumor treatment primarily relies on surgical resection combined with radiotherapy, chemotherapy, immunotherapy, and targeted therapy, which has significantly improved patient survival rates and reduced recurrence rates[2]. However, the toxic side effects of drugs and the emergence of drug resistance pose significant challenges, highlighting the urgent need for new cancer diagnostic biomarkers to aid in early detection, diagnosis, and treatment. MATN3 belong to the extracellular matrix (ECM) protein family and encode components of the vascular hemophilia A structural domain[3]. Previous studies have implicated MATN3 in the development and progression of osteoarthritis and its potential role in gastric cancer invasion[4]. Nevertheless, previous studies have carried out preliminary exploration of gastric cancer, but there is still a lack of understanding at the pan-cancer level. We examined its association with cancer diagnosis, prognosis, molecular typing, immune subtyping, methylation, drug sensitivity, and immune infiltration, providing insights into the multifaceted role of MATN3 in cancer. In addition, we also knocked down MATN3 in liver cancer cell lines Huh7 and Hep3B to study the effect of MATN3 on the function of liver cancer cells.
Materials and Methods
Gene expression analysis of MATN3
TIMER 2.0 (http://timer.cistrome.org) is a free, open-access data sharing platform where users can explore immune infiltration in cancer types and examine the expression of target genes in tumor and normal tissues across various cancer types[5]. We acquired RNA-seq data for 33 types of cancer from The Cancer Genome Atlas (TCGA) database (http://cancergenome.nih.gov) and the Genotype-Tissue Expression (GTEx) database (http://commonfund.nih.gov/GTEx/). We utilized data from both databases to investigate the differential expression of MATN3 across various cancer types. The relationship between MATN3 expression and clinicopathological features of HCC in the TCGA database is shown in the table (Table S2). Box plots were employed to visualize the distribution of gene expression levels. Furthermore, we investigated the association between MATN3 expression and clinicopathological features (including T-stage, N-stage, M-stage, and histologic grading), with statistical significance evaluated using the Wilcoxon test. Additionally, we utilized the pROC software package in R language (version 4.2.1) to construct receiver operating characteristic (ROC) curves to assess the diagnostic value of MATN3 across 33 cancer types[6]. Statistical significance is indicated as (*: p-value < 0.05; **: p-value < 0.01; ***: p-value < 0.001), and normal data are shown in gray columns when available.
Prognostic analysis of pan-cancer in MATN3
We obtained information on the clinical characteristics of 33 cancer types in TCGA and evaluated the correlation between differential expression of MATN3 and prognosis. The data were categorized into MATN3 high-expression and MATN3 low-expression groups based on the median MATN3 expression value, one-way COX analysis and Kaplan-Meier curves were used to evaluate the significance of differential expression of MATN3 for the three aspects of survival (OS), disease-specific survival (DSS), and progression-free interval (PFI) for the 33 cancer types, and a forest plot was used to demonstrate the results of the one-way COX analysis[7].
Molecular and immunological subtyping
We explored the relationship between MATN3 expression and the molecular and immune subtypes of different tumors at TISIDB (http://cis.hku.hk/TISIDB/)[8].
Correlation of MATN3 expression with immune checkpoint genes, immunomodulatory genes, and drug sensitivity
Tumor treatment is closely related to the expression of immune checkpoint genes and immunomodulatory genes, and we applied the TIMER database to explore the correlation between MATN3 expression and immune checkpoint genes and immunomodulatory genes[9]. The GSCA database (https://guolab.wchscu.cn/GSCA/#/) was used to explore the MATN3 expression and drug sensitivity Relationship[10].
Association of MATN3 with immune infiltration and gene mutations
The TIMER database was used to explore the relationship between MATN3 expression and immune infiltrating cells in 33 cancer types. We explored the relationship between six types of cells (B cell, T cell CD4, T cell CD8, Neutrophil, Macrophage, and DC) and MATN3 expression, and the results are presented in the form of heatmaps, and Pearson's correlation coefficient was used to describe the correlation[9]. Additionally we explored the relationship between MATN3 and tumor purity, the ESTIMATE algorithm was used to calculate stromal scores, immune scores, and estimation scores for the relevant tumor samples and to assess the correlation between the level of MATN3 expression and these scores. Additionally pearson correlation was used to explore the correlation of MATN3 expression with for microsatellite instability (MSI)[11] as well as tumor mutational load (TMB)[12]. We also discussed MATN3 gene alterations in pan-cancer using the cBioPortal database[13].
Relationship between MATN3 expression and methylation
Promoter methylation is closely related to cancer development, and the level of promoter methylation is closely related to the clinical features and prognosis of tumors[14]. In addition to this, cancer development is also associated with m6A, m5C and m1A modifier genes[15]. We explored the expression of MATN3 promoter methylation levels in different cancer types by UALCAN (https://ualcan.path.uab.edu/cgi-bin/ualcan-res.pl)[16]. SAMRT (http://www.bioinfo-zs.com/smartapp/) was used to probe the distribution of chromosomal methylation probes[17]. We also explored the correlation between MATN3 mRNA expression and genes related to methylation modifications. MethSurv (https://Biit.cs.ut.ee/MethSurv/) was used to probe DNA methylation survival prognosis[18].
Enrichment analysis
We utilize the STRING database (https://cn.string-db.org/)[19]. We constructed a PPI network of MATN3 with 57 related genes PPI interaction network of MATN3 with 57 related genes was constructed, in addition, we also constructed GGI interaction network of MATN3 with 21 related genes from GeneMANIA database (http://genemania.org/)[20], and GO and KEGG enrichment analyses were performed based on the co-expressed genes of MATN3.
Cell lines and cell culture
Hep3B and Huh7 were purchased from the National Center for the Preservation of Certified Cell Cultures (https://www.cellbank.org.cn/), and Hep3B and Huh7 were cultured in MEM containing 10% FBS (Gibco, Shanghai, China).
Cell transfection
Small/short interfering RNAs (siRNAs) designed by Sangon Biotech (sangon.com) to interfere with MATN3, the sequence is shown in the table (Table S3). The siRNA was transfected into cells using the bio-engineering transfection reagent transmate, and the transfection efficiency was verified by WB experiments.
Western blot analysis
Proteins were extracted according to the instructions of the reagent supplier, protein concentration was measured by BCA method, proteins were bound to PVDF membrane after electrophoresis and membrane transfer operation, incubated with primary antibody at 4℃ overnight, and then incubated with corresponding goat anti-rabbit antibody. Primary antibody concentration: MATN3 (1:2000, Baijia, China).
Cell proliferation and colony formation assay
The corresponding hepatocellular carcinoma cells were planted into 96-well plates at a density of 3000 cells/well and tried with CCK-8 kit according to the instructions of the reagent supplier (HC0854, WILBER) In order to evaluate the effect of MATN3 on colony formation, we planted the cells into 6-well plates at a density of 6,000 cells per well, and the experiments were repeated three times.
Immunohistochemical analysis of MATN3 in hepatocellular carcinoma
To assess the disparity in MATN3 expression between tumor tissues and normal tissues, we recruited 30 hepatocellular carcinoma patients who underwent surgery at the Department of Hepatobiliary Surgery of the First Affiliated Hospital of Guangxi Medical University. Here are their detailed clinical parameters (Table S1). These patients were diagnosed with hepatocellular carcinoma based on postoperative pathology. We obtained informed consent from each patient, who then signed an informed consent form prior to collecting surgical specimens[21] with the authorization of the Ethical Review Committee of the First Affiliated Hospital of Guangxi Medical University (authorization code: 2024-E295-01). Inclusion criteria: 1. Patients with primary hepatocellular carcinoma treated for the first time; 2. Patients treated with partial hepatectomy; 3. Patients who have not undergone interventional therapy, targeted therapy and immunotherapy before surgery. Exclusion criteria: Patients with a history of other tumors besides hepatocellular carcinoma. The experimental process was carried out according to the instructions of the reagent supplier, and the specific operation details were described above[22]. The antibody used in the study was MATN3 (Solarbio, dilution concentration: 1:200). Five randomly selected fields of view were observed and semi-quantitatively scored for MATN3, with the score equal to the intensity of expression multiplied by the area of expression. Expression intensity scores ranging from 0-3 indicate negative, weak staining (light yellow), moderate staining (light brown), and strong staining (dark brown), respectively. Expression area scores ranging from 0-4 represent <5%, 6-25%, 26-50%, and 51-75% >75%, respectively. The degree of positive staining was defined as: 1-3 as weakly positive (+); 4-6 as moderately positive (+++); and 7-12 as strongly positive (++++)[23].
Wound healing assay
Cells were inoculated in 6-well plates and scratched with a 20ul lance tip when single cell confluence reached 90%. Photographs were taken at 0H, 24H and 48H for observation respectively. The experiment was repeated three times.
Cell migration assay
Experiments were performed using transwell chambers with 8 µm pore size. Serum-free DMEM medium containing 8×10⁴ cells was inoculated into the upper chamber, and the lower chamber was injected with DMEM containing 10% FBS for 24 h. After 24 h, paraformaldehyde fixation was performed, crystal violet staining was performed and the number of cells passing through the bottom of the chambers was recorded when placed under a microscope.
Results
Expression of MATN3
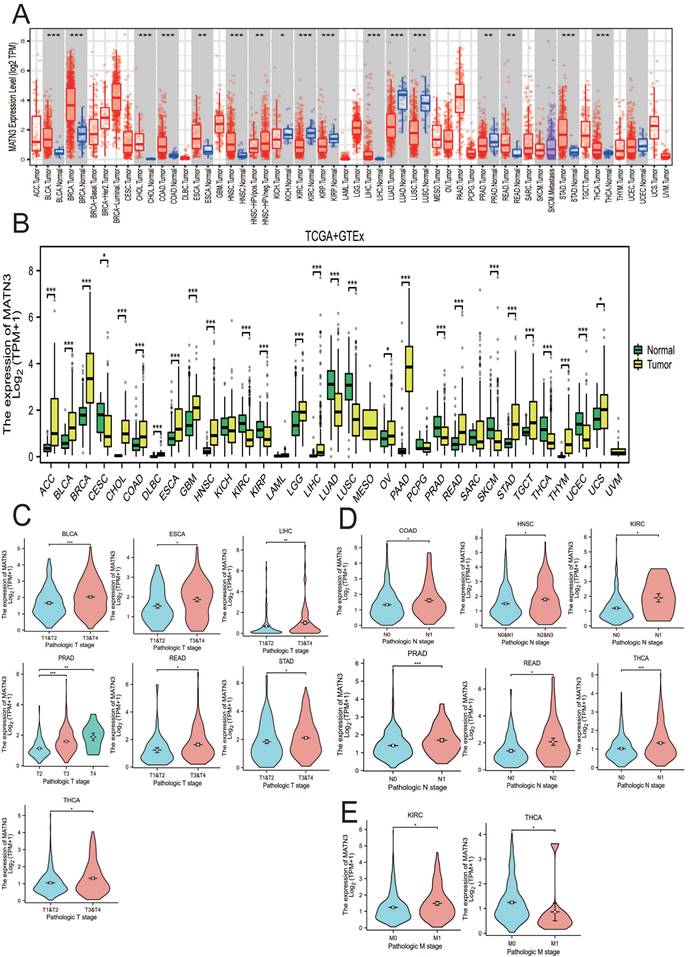
We obtained the expression of MATN3 in tumor tissues and normal tissues from TIMER2.0 in a variety of cancer types (Figure 1A), and combined the TCGA database + GTEx database to explore the expression of MATN3 in pan-cancer (Figure 1B). In addition, we also explored the expression of MATN3 in different clinicopathologic features (including T-stage, N-stage, M-stage, and histologic grading) (Figure 1C, Figure 1D). From (Figure 1A), it can be seen that bladder uroepithelial carcinoma (BLCA), breast invasive carcinoma (BRCA), cholangiocarcinoma (CHOL), colon adenocarcinoma (COAD), esophageal carcinoma (ESCA), head and neck squamous cell carcinoma (HNSC), hepatocellular carcinoma (LIHC), rectal carcinoma (READ), gastric carcinoma (STAD), thyroid carcinoma (THCA), and endometrioid carcinoma (UCEC) were significantly up-regulated compared to normal tissue expression next to the tumor, but DBF4B expression was down-regulated in renal smoky cell carcinoma (KICH), renal clear cell carcinoma (KIRC), renal papillary cell carcinoma (KIRP), lung adenocarcinoma (LUAD), lung squamous cell carcinoma (LUSC), and prostate adenocarcinoma (PRAD) (Figure 1B). Subsequently, we also explored the relationship between MATN3 expression and pathologic features; for T stage (Figure 1C), we found that MATN3 expression was expressed at high levels in the higher T stage of BLCA, ESCA, LIHC, PRAD, READ, STAD, and THCA as compared to the lower T stage. For N stage (Figure 1D), MATN3 expression was higher in the higher N stage of COAD, HNSC, KIRC, PRAD, READ, and THCA. For M stage (Figure 1E), MATN3 expression was higher in the higher staging of KIRC, but the opposite was true in THCA. We also found that MATN3 had high diagnostic value in all 15 cancer types (Figure S1) and could play a great role in cancer diagnosis. The names of the 33 cancer types along with their abbreviations are shown in the Abbreviations section. Univariate logistic regression analysis (Table S2) showed a strong correlation between MATN3 expression and some clinicopathological features in HCC, especially Age (OR=0.602, 95%CI = 0.400-0.907). p=0.015), Pathologic stage (OR=1.833, 95%CI =1.126-2.985, p=0.015) and Pathologic T stage (OR=1.723, 95%CI =1.069-2.777, p=0.025).
MATN3 expression in pan-cancer from different databases. (A) MATN3 expression in pan-cancer in TIMER2.0. (B) MATN3 expression in cancer types in TCGA + GTEx. (C) The relationship of MATN3 expression to T stage in BLCA, ESCA, LIHC, PRAD, READ, STAD and THCA. (D) The relationship of MATN3 expression to N stage in COAD, HNSC, KIRC, PRAD, READ, THCA. (E) The relationship of MATN3 expression to M stage in KIRC, THCA.
Prognostic analysis of pan-cancer in MATN3
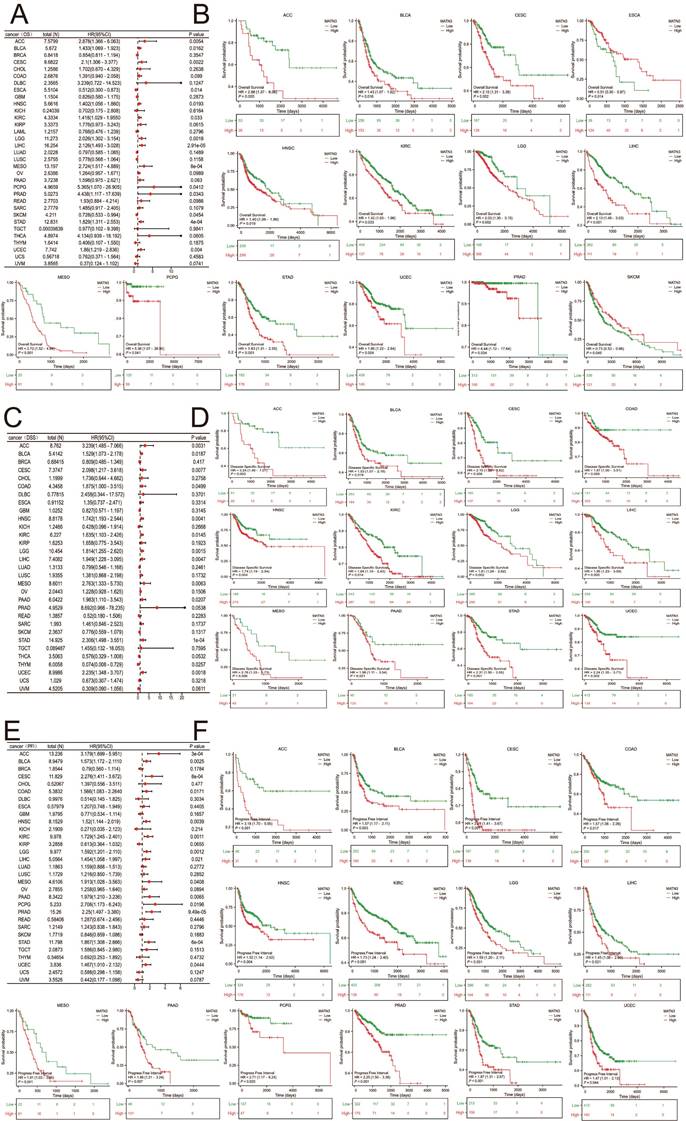
Three indicators, OS, DSS, and PFI, were used to evaluate MATN3 and cancer prognosis. The relationship between the differences in MATN3 expression and OS, DSS, and PFI was demonstrated in forest plots (Figure 2A, Figure 2C, and Figure 2E). For OS, high expression of MATN3 was associated with poor prognosis in ACC, BLCA, CESC, HNSC, KIRC, LGG, LIHC, MESO, PCPG, PRAD, STAD, UCEC. However, opposite results were presented in ESCA, SKCM (Figure 2B). For DSS, high expression of MATN3 was associated with poor prognosis in ACC, BLCA, CESC, COAD, HNSC, KIRC, LGG, LIHC, MESO, PAAD, STAD, UCEC (Figure 2D). For PFI, high expression of MATN3 was associated with poor prognosis in ACC, BLCA, CESC, COAD, HNSC, KIRC, LGG, LIHC, MESO, PAAD, PCPG, PRAD, STAD, UCEC (Figure 2F).
The univariate regression and Kaplan-Meier curves for OS (A, B), DSS (C, D), and PFI (E, F) in pan-cancer.
Molecular and immunological subtyping
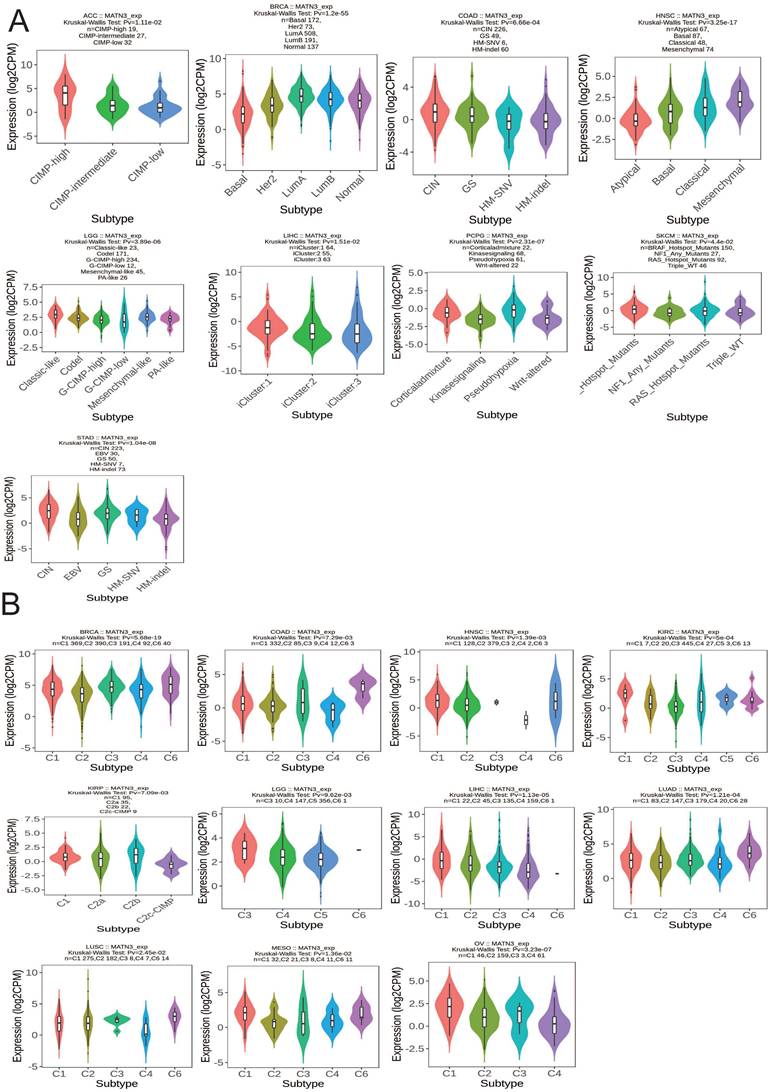
We observed that the molecular subtypes of these tumors in ACC, BRCA, COAD, HNSC, LGG, LIHC, PCPG, SKCM, and STAD were correlated with the expression of MATN3.MATN3 expression was higher in CIMP-high in ACC. For BRCA, MATN3 expression was highest in Luma molecular subtype. MATN3 expression was highest in CIN molecular subtype in COAD and Mesenchymal molecular subtype in HNSC. For LGG, MATN3 expression was higher in Classical-like molecular isoforms than in other isoforms. MATN3 expression was higher in the iCluster:1 molecular isoform of LIHC than in other molecular isoforms, in the Pseudohypoxia molecular isoform of PCPG than in other isoforms, and in the Hotspot-Mutans molecular isoform of SKCM than in other isoforms. MATN3 expression was highest in the CIN molecular isoform of COAD and in the Mesenchymal molecular isoform of HNSC. MATN3 expression was upregulated in the CIN molecular subtype of STAD (Figure 3A). The immune subtypes of cancer were closely related to the effect of immunotherapy, and MATN3 expression was significantly correlated with BRCA, COAD, HNSC, KIRC, KIRP, LGG, LIHC, LUAD, LUSC, MESO, and OV (Figure 3B). For BRCA, LUAD, and LUSC, MATN3 was expressed higher in immune subtype C6 than other immune subtypes. In HNSC, KIRC MATN3 expression was higher in immune subtype C1. For KIRP, the expression of MATN3 was higher in C2b than other immune subtypes. The expression of C3 in LGG was higher than other subtypes. For LIHC, MESO, and OV, MATN3 expression was highest in the C1 immunization subtype.
Correlations between MATN3 expression and (A) molecular subtypes and (B) immune subtypes across TCGA cancer types. CIN, chromosomal instability; GS, genomically stable; POLE, Polymerase ε; EBV, Epstein-Barr virus.C1: wound healing, C2: IFN-gamma dominant, C3: inflammatory, C4: lymphocyte depleted, C5: immunologically quiet, and C6: TGF-b dominant.
MATN3 expression and immune checkpoint genes, immunomodulatory genes, and drug sensitivity
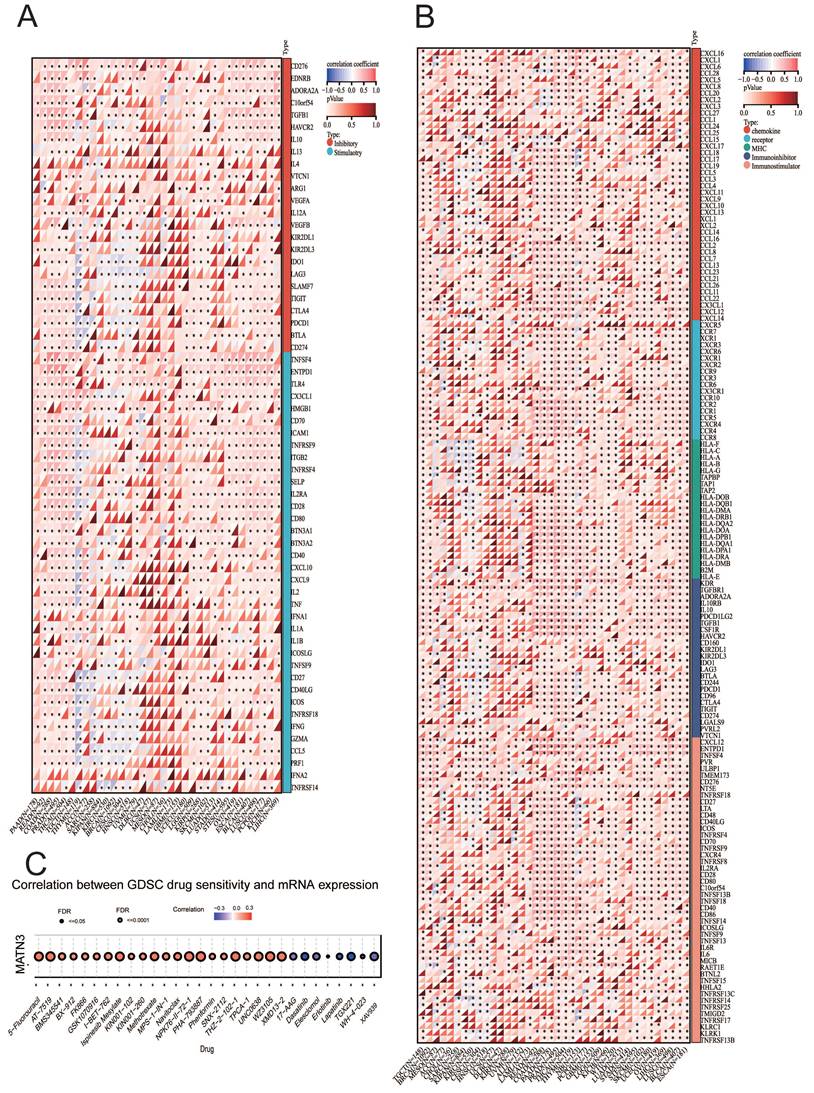
The expression of immune checkpoint genes is closely related to the efficacy of do immunotherapy for cancer, so we explored the correlation between immune checkpoint genes, immunoregulatory genes and MATN3 expression. The results showed that MATN3 expression was positively correlated with cytotoxic T lymphocyte antigen 4 (CTLA4), CD274 (PD-L1), programmed cell death 1 (PDCD1 or PD1), and lymphocyte activation gene 3 (LAG3) in the majority of cancer types, but the opposite was true for THYM, which was negatively correlated with most of the immune checkpoint genes (Figure 4A). We also found that MATN3 was positively correlated with the majority of immunomodulatory genes (Figure 4B). The expression of MATN3 was positively correlated with 5-Fluorouracil, Ispinesb Mesylate, Methotrexate, and Navitoclax, suggesting that high expression of MATN3 may lead to drug resistance. The expression of MATN3 was positively correlated with the expression of Dasatinib, Elesclomol, Erlotinib, and Lapatinib was negatively correlated, suggesting that MATN3 may promote sensitization to this group of drugs (Figure 4C).
Correlation between MATN3 and immune regulatory genes, immune checkpoints genes, drug sensitivity in pan-cancer. (A) Correlation between MATN3 and immune regulatory genes (B) Correlation between MATN3 and immune checkpoints (C) Association of GSCALite-based expression of MATN3 and related genes with drug sensitivity.
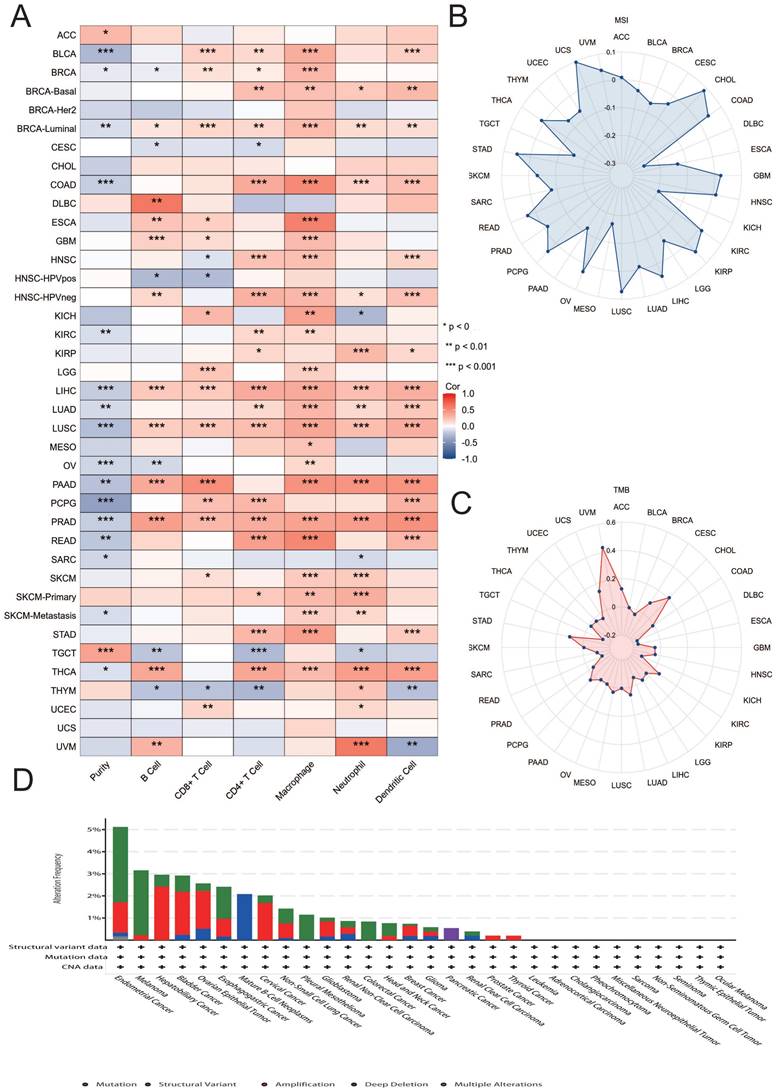
MATN3 and immune infiltration and gene mutations
We explored the correlation between MATN3 expression and 6 types of immune-related cells (B cells, CD4+ T cells, CD8+ T cells, neutrophils, macrophages, and dendritic cells) in 33 tumors in the TIMER database, and the results are presented in the form of heatmaps. The results showed that there was a correlation between the expression of MATN3 in BRCA-Luminal, LIHC, LUSC, PRAD and all six immune cells. Among them, the most obvious positive correlation between MATN3 expression and immune cells could be observed in DLBC, and the most obvious negative correlation between MATN3 expression and immune cells was observed in PCPG (Figure 5A). In addition, microsatellite instability (MSI) as well as tumor mutational load (TMB) can be used to predict tumor immunotherapy. we found that the expression of MATN3 in CHOL, COAD, GBM, HNSC, KIRC, KIRP, LIHC, LUSC, OV, PCPG, READ, STAD, THCA, UCS, UVM was positively correlated with MSI, and negatively correlated with BLCA, BRCA, CESC, DLBC, ESCA, KICH, LGG, MESO, PRAD, SARC, SKCM, TGCT, THYM, and UCEC (Figure 5B). The expression of MATN3 was found to be positively correlated in ACC, CESC, CHOL, KIRC, LUAD, MESO, PCPG, SATD, UCS, and TMB of UVM was positively correlated, and negatively correlated with ESCA, DLBC, GBM, HNSC, KICH, KIRP, LIHC, READ, SARC, TGCT, THYM, and UCEC (Figure 5C). We found that the mutation frequency was highest (>6%) in Endometrial cancer, which was dominated by Mutation, followed by Melanoma, whose mutation type was dominated by Mutation, and Hepatobliliary Cancer and Bladder Cancer, whose mutation frequency was similar, both of which were dominated by Amplification mutation type predominated (Figure 5D).
Correlation between MATN3 and immune cells, TMB, MSI, Genetic alterations in pan-cancer. (A) Heatmap of correlation between MATN3 expression and 6 tumor-infiltrating cells. (B) The correlation of MATN3 expression with TMB. (C) The correlation of MATN3 expression with MSI. (D) Genetic alterations of MATN3 in pan-cancer using the cBioPortal.
MATN3 and methylation
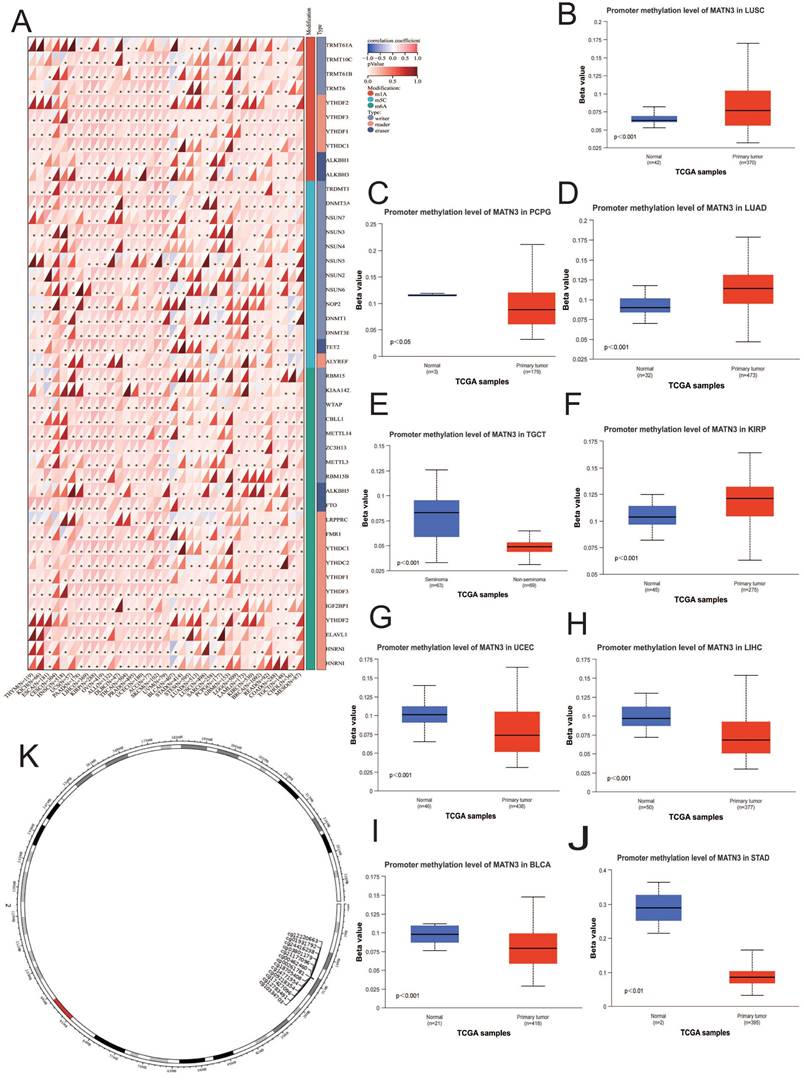
We observed that MATN3 expression at the promoter methylation level was higher in tumor tissues of KIRP (Figure 6F), LUAD (Figure 6D), and LUSC (Figure 6B) than in normal tissues of these cancer types, and was opposite in BLCA (Figure 6I), LIHC (Figure 6H), PCPG (Figure 6C), STAD (Figure 6J), TGCT (Figure 6E), and UCEC (Figure 6G). in which the opposite was true. The differences in the methylation levels of the MATN3 promoter explained, to some extent, the differences in MATN3 expression in some tumors. The correlation analysis of MATN3 expression with methylation modifier genes (m1A, m5C, m6A) showed that (Figure 6A): the OVs were positively correlated with methylation modifier genes in all of them, and the PAAD, LIHC, KIRP, PRAD, UCEC, ACC, and SKCM were positively correlated with the majority of methylation modification genes, and GBM, LAML, and LGG were less correlated with methylation modification genes. In addition, we explored the chromosomal distribution of MATN3-associated methylation probes (Figure 6K), and the 13 methylation probes were: cg21177096, cg00261781, cg00462460, cg01931792, cg03801179, cg09218354, cg10334703, cg12220663, cg12783491, cg14771954, cg17427096, cg18705408, cg21177096, cg24416238. we also explored the relationship between MATN3 methylation and survival (Table 1), which showed that hypermethylated cg21177096 showed worse prognosis in ACC, KIRP, LGG, UCEC, UCS, and good prognosis in COAD, KIRC, LUSC. Hypermethylated cg00261781 shows worse prognosis in KIRP, MESO and good prognosis in GBM, KIRC, LGG, SKCM. Hypermethylated cg00462460 shows worse prognosis in CESC, KIRP and good prognosis in BRCA, HNSC, KIRC, LGG. Hypermethylated cg01931792 shows worse prognosis in BLCA, LIHC and good prognosis in KIRC, KIRP, LGG, MESO, UVM. Hypermethylated cg03801179 shows worse prognosis in KIRP, SKCM and good prognosis in BRCA, HNSC, KIRC.
Relationship between MATN3 methylated CpG and survival.
| GCP | HR | P value | |||
|---|---|---|---|---|---|
| ACC | cg21177096 | 5.268(1.251;22.18) | 0.004003342 | ||
| cg12220663 | 0.445(0.207;0.958) | 0.033050964 | |||
| cg01931792 | 2.321(1.068;5.043) | 0.043290041 | |||
| BLCA | cg01931792 | 1.517(1.045;2.204) | 0.022453353 | ||
| cg24416238 | 1.501(1.019;2.211) | 0.031771102 | |||
| BRCA | cg12783491 | 0.563(0.36;0.881) | 0.008670634 | ||
| cg00462460 | 0.593(0.396;0.888) | 0.009793759 | |||
| cg14771954 | 0.543(0.33;0.894) | 0.010850188 | |||
| cg03801179 | 0.585(0.338;1.012) | 0.041261465 | |||
| cg09218354 | 0.66(0.44;0.991) | 0.041569449 | |||
| CESC | cg00462460 | 1.893(1.018;3.52) | 0.030931498 | ||
| cg18705408 | 1.603(1;2.57) | 0.04764151 | |||
| COAD | cg12220663 | 1.848(1.112;3.072) | 0.01457385 | ||
| cg21177096 | 0.571(0.347;0.938) | 0.023638182 | |||
| cg09218354 | 0.592(0.362;0.969) | 0.042481875 | |||
| GBM | cg00261781 | 0.53(0.349;0.806) | 0.002782668 | ||
| cg18705408 | 0.53(0.337;0.834) | 0.007945736 | |||
| cg09218354 | 0.575(0.365;0.906) | 0.02133314 | |||
| HNSC | cg03801179 | 0.545(0.384;0.773) | 0.000294804 | ||
| cg18705408 | 0.597(0.423;0.84) | 0.001854571 | |||
| cg10334703 | 1.683(1.19;2.38) | 0.001887737 | |||
| cg24416238 | 1.498(1.079;2.08) | 0.012185988 | |||
| cg17427096 | 0.698(0.519;0.938) | 0.01454275 | |||
| cg14771954 | 0.702(0.511;0.963) | 0.02396785 | |||
| cg09218354 | 0.711(0.516;0.979) | 0.031364099 | |||
| cg00462460 | 0.719(0.518;0.998) | 0.041659608 | |||
| KIRC | cg12220663 | 2.544(1.468;4.407) | 0.000221572 | ||
| cg00462460 | 0.475(0.299;0.754) | 0.000802375 | |||
| cg18705408 | 0.531(0.339;0.83) | 0.003596935 | |||
| cg21177096 | 0.575(0.389;0.851) | 0.005135328 | |||
| cg03801179 | 0.516(0.306;0.868) | 0.007512144 | |||
| cg01931792 | 0.544(0.327;0.904) | 0.012244874 | |||
| cg24416238 | 0.629(0.389;1.018) | 0.048748302 | |||
| cg00261781 | 0.678(0.459;1.002) | 0.049702631 | |||
| KIRP | cg12783491 | 2.669(1.433;4.969) | 0.002587075 | ||
| cg21177096 | 2.691(1.368;5.295) | 0.002621146 | |||
| cg01931792 | 0.379(0.204;0.706) | 0.00289106 | |||
| cg00462460 | 2.546(1.351;4.796) | 0.005755506 | |||
| cg24416238 | 2.337(1.238;4.413) | 0.007978722 | |||
| cg18705408 | 2.376(1.254;4.502) | 0.01074089 | |||
| cg00261781 | 2.236(1.177;4.247) | 0.018586969 | |||
| cg10334703 | 0.455(0.24;0.863) | 0.019813683 | |||
| cg12220663 | 0.309(0.095;1.007) | 0.021727231 | |||
| cg09218354 | 2.162(1.122;4.164) | 0.027707707 | |||
| cg03801179 | 1.97(1.035;3.747) | 0.035250812 |
Relationship of MATN3 with methylation and methyltransferase. (A) Chromosomal distribution of the methylation probes associated with MATN3.(B-J) Promoter methylation level of MATN3 in BLCA, KIRP, LIHC, LUAD, LUSC, PCPG, STAD, TGCT and UCEC. (K) The correlation between MATN3 expression and m1A, m5C, m6A regulatory genes. *: p < 0.05.
Hypermethylated cg09218354 shows worse prognosis in KIRP, LIHC, UCEC, UCS and good prognosis in BRCA, COAD, GBM, HNSC, LGG, UVM. Hypermethylated cg10334703 shows worse prognosis in HNSC, LUAD, UCEC, UVM and good prognosis in LGG, SKCM. Hypermethylated cg12220663 shows worse prognosis in COAD, KIRC, LUAD and good prognosis in ACC, KIRP, LGG, UVM. Hypermethylated cg12783491 shows worse prognosis in KIRP, SKCM, UCS and good prognosis in BRCA, PAAD. Hypermethylated cg14771954 showed worse prognosis in UCEC and good prognosis in BRCA, HNSC, LGG. Hypermethylated cg17427096 shows worse prognosis in UCEC, UVM and good prognosis in HNSC, LGG. Hypermethylated cg18705408 shows worse prognosis in CESC, KIRP, UCEC and good prognosis in GBM, HNSC, KIRC, LGG, SKCM. Hypermethylated cg21177096 shows worse prognosis in ACC, KIRP, UCS and good prognosis in COAD, KIRC, LGG, LUSC. Hypermethylated cg24416238 shows worse prognosis in BLCA, HNSC, KIRP and good prognosis in KIRC, LGG, UCS.
Enrichment analysis
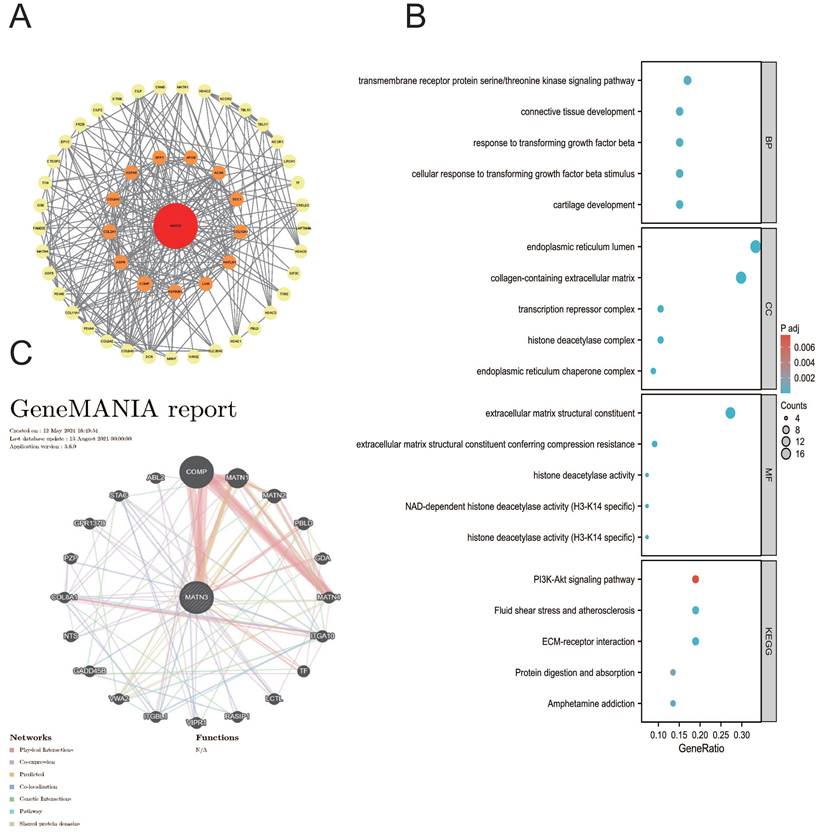
We found that MATN3 may be associated with prognosis and immunity in different cancer patients in our previous explorations, and we used the STRING database and the GeneMANIA database to construct the PPI interaction network (Figure 7A) as well as the GGI interaction network (Figure 7C) of MATN3. Based on these related genes we performed Gene Ontology (GO) and Kyoto Encyclopedia of Genes and Genomes (KEGG) enrichment analyses (Figure 7B), and Biological Process (BP) enrichment analyses showed: transmembrane receptor protein serine/threonine kinase signaling pathway, connective tissue development, response to transforming growth factor beta, cellular response to transforming growth factor beta stimulus, cartilage development; molecular function (MF) enrichment analysis showed: endoplasmic reticulum lumen, collagen-containing extracellular matrix, transcription repressor complex, histone deacetylase complex, endoplasmic reticulum chaperone complex; cellular component (CC) enrichment analysis showed: extracellular matrix structural constituent, Extracellular matrix structural constituent, extracellular matrix structural constituent conferring compression resistance, histone deacetylase activity, NAD-dependent histone deacetylase activity (H3-K14 specific), histone deacetylase activity (H3-K14 specific). KEGG pathway analysis revealed that PI3K-Akt signaling pathway, Fluid shear stress and atherosclerosis, ECM-receptor interaction, Protein digestion and absorption, and Amphetamine addiction. we found that MATN3 may be involved in the regulation of tumor development through its effect on the PI3K-Akt signaling pathway. We found that MATN3 may be involved in the regulation of tumor development through its effect on the PI3K-Akt signaling pathway.
Functional enrichment and co-expression networks of MATN3 at the gene and protein level. (A) PPI network. Colors are used to distinguish the relevance of MATN3 to other proteins, with red representing high relevance and green representing low relevance. (B) visual network of GO and KEGG analyses. (C) GGI network.
Immunohistochemical analysis
We obtained pathology specimens from 30 patients with hepatocellular carcinoma from the Department of Hepatobiliary Surgery at the First Affiliated Hospital of Guangxi Medical University for immunohistochemical analysis. Semi-quantitative scores were used to evaluate the immunohistochemistry results. The findings indicated that MATN3 protein was significantly overexpressed in hepatocellular carcinoma tissues compared to normal liver tissues (Figure 8A), and the difference in immunohistochemical staining scores between hepatocellular carcinoma tissues and normal liver tissues was statistically significant.
Downregulation of MATN3 can reduce the proliferation ability. (A) MATN3 protein expression in LIHC and normal tissues by immunohistochemistry. (B) The Cell Counting Kit-8 (CCK-8) assay showed that knockdown of MATN3 inhibited HCC cell proliferation. (C) Western blot analysis of MATN3 protein expression levels in the si-1406 and si-NC groups. (D) Representative images of colony in the si-NC and si-1406 groups of the indicated cells, with corresponding histogram.
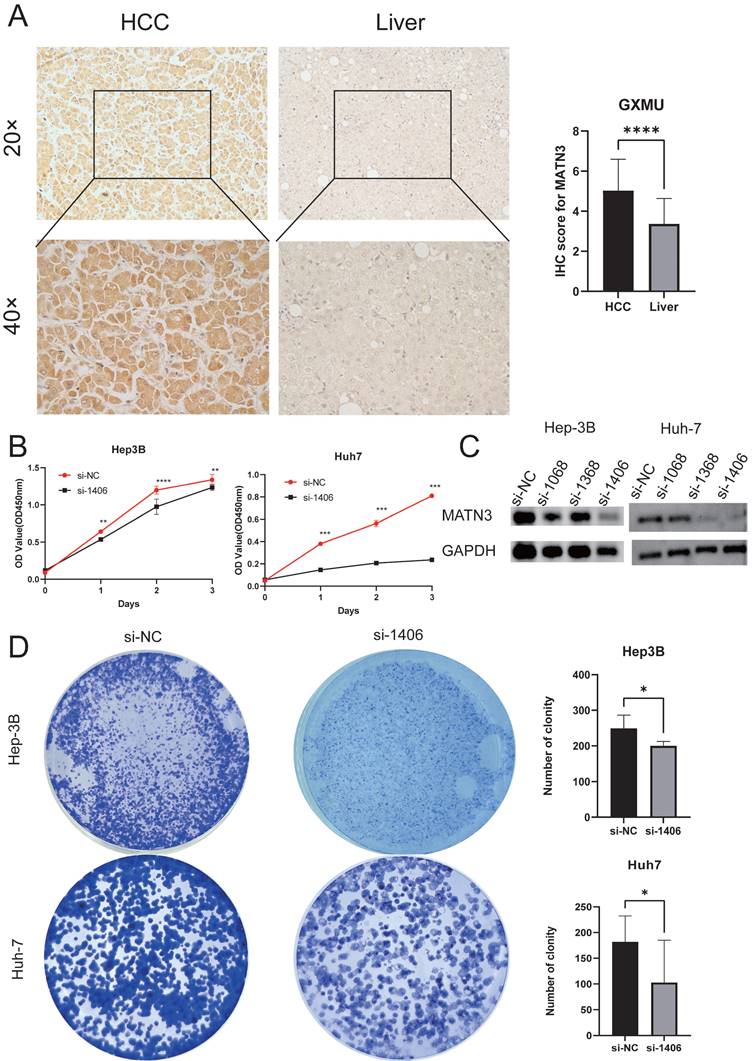
Downregulation of MATN3 can reduce the proliferation and migration ability of liver cancer cells
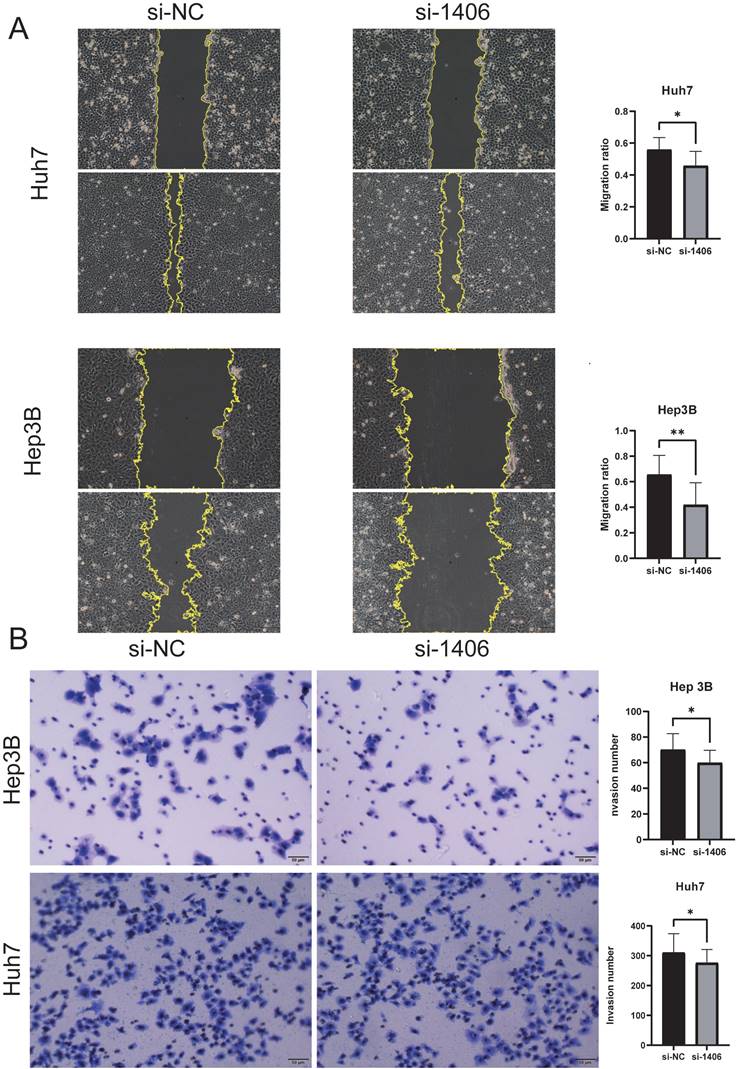
The knockdown efficiency was evaluated by western blotting (Figure 8C), and the proliferation assay CCK-8 (Figure 8B) and colony formation assay showed that the proliferation ability of si-MATN3 group was reduced compared with that of NC group (Figure 8D), and the Cell migration assay (Figure 9A) and wound healing assay (Figure 9B) showed that the migratory ability of si-MATN3 group was reduced compared with that of NC group.
Downregulation of MATN3 can reduce the migration ability. (A) Wound healing assay revealing that MATN3 overexpression promotes Hep3B and Huh7 cell migration. Data are presented as the mean ± SD of three independent experiments, ***P < 0.001, Student's t-test. (B) Transwell migration assays demonstrating that knockdown of MATN3 decreases the migratory abilities of HCC cells. The migrated cells were counted. Data are presented as the mean ± SD of three independent experiments, ***P < 0.001, Student's t-test.
Discussion
Currently, the rapid progress of multi-omics analysis technology enables people to understand the occurrence and development of cancer from more angles. mRNA, non-coding RNA, protein and other biomarkers[24] may be present in cancer tissues, normal tissues, blood, urine and other parts of the patient's body, and their stable and detectable nature is widely used in early diagnosis and prognosis of cancer patients[25]. MATN3 is a member of the matrilin protein family, which has received extensive attention in the field of bone and cartilage. MATN3 is a member of the matrilin family of proteins, which has received much attention in the skeletal as well as cartilage fields, where mutations may affect skeletal dysplasia[26] and may be a risk factor for arthritis of the hand[27]. MATN3 is still underexplored in the field of cancer, and it has been reported that MATN3 plays an important role in the development of gastric adenocarcinomas[28]. As a classical secretory protein, MATN3 can hinder immune cell infiltration and promote tumor progression, but there is still a lack of relationship between MATN3 expression and immune infiltration at pan-cancer level, so we have studied the relationship between MATN3 expression and immune infiltration, which is consistent with the previous conclusion. It is helpful to further understand the mechanism of immune infiltration and MATN3 expression in different tumors. Based on TCGA and GTEx databases, our work found that MATN3 was significantly up-regulated in 15 cancer types, and MATN3 expression was relatively high in a variety of cancer types in relatively high T stage, relatively high N stage, relatively high M stage, and higher histologic grading. We performed immunohistochemistry on hepatocellular carcinoma as a means of confirming MATN3 expression in tumor tissue and normal tissue samples. We found that MATN3 protein expression was significantly upregulated in tumor tissues of hepatocellular carcinoma compared to normal paracancerous tissues[29]. Survival analysis revealed that high expression of MATN3 was worse in OS, DSS, and PFI in ACC, BLCA, CESC, HNSC, KIRC, LGG, LIHC, MESO, PCPG, PRAD, STAD, and UCEC. High expression of MATN3 predicted poor prognosis in most cancer types. Our work also observed a close association of MATN3 expression in 9 different molecular subtypes[30] and 11 different immune subtypes[31], which may be an entry point for subsequent studies. In addition, we explored the correlation of MATN3 expression with immune checkpoint genes and immunomodulatory genes as well as the relationship between MATN3 expression and drug sensitivity. Immune checkpoint genes are important targets of immune checkpoint inhibitors for cancer treatment[32], and we found that MATN3 expression was significantly correlated with immune checkpoint genes (CTLA4, PD-L1, PD1). The expression of MATN3 was negatively correlated with Dasatinib[32], Elesclomol[33], Erlotinib[34], and Lapatinib[35], suggesting that MATN3 may promote the sensitivity of this part of drugs and play a positive role in cancer treatment.
We also explored the relationship between MATN3 and the infiltration of six types of immune cells, and we found that four types of cancer types, BRCA-Luminal, LIHC, LUSC, and PRAD, were significantly correlated with all six types of immune cells. Microsatellite instability (MSI)[35] as well as tumor mutational load (TMB)[36] are instructive for immunotherapy of cancer, and our work found that MSI and TMB are closely associated with most cancer types. We also explored the relationship between gene mutations and cancer, and the results showed that Amplification was the main mutation type[37]. In addition, methylation modification, as one of the most common epigenetic modifications, is also an important step in regulating cancer development[38], we explored the expression of MATN3 promoter methylation in different cancer types as well as the correlation between MATN3 expression and methylation-associated genes, and also explored the relationship between methylated water and prognosis, and the results showed that MATN3 promoter methylation may play a different roles, and MATN3 expression was positively correlated with most RNA methylation modification genes, which suggests that we MATN3 may be involved in methylation modification and thus in the regulation of tumor development[39]. Enrichment analysis showed that MATN3 was likely to regulate the occurrence and progression of tumors by participating in the PI3K-Akt signaling pathway. This may provide some entry points for subsequent studies to explore the regulatory pathways of MATN3 in cancer. In vitro experiments in hepatocellular carcinoma have verified that MATN3 knockdown can inhibit the proliferation and migration of hepatocellular carcinoma, but the specific regulatory mechanism of MATN3 in hepatocellular carcinoma remains to be further studied. In conclusion, this study analyzed the differential expression, diagnostic value, prognostic value, methylation, immune infiltration and enrichment pathway of MATN3 in various cancer types using multiple databases, and MATN3 is expected to be a prognostic and immune biomarker for pan-cancer.
Conclusion
Our work systematically explored the role of MATN3 in cancer in terms of MATN3 expression and clinical features, diagnostic value, prognosis, gene mutation, drug sensitivity, methylation and its prognosis, immune infiltration, immune checkpoints, TMB, and MSI, and the results showed that MATN3 was significantly correlated with these factors, which could provide a better tool for us to follow up and explore the potential value of MATN3 in cancer. In this study, multiple databases were used to analyze the differential expression, diagnostic value, prognostic value, methylation, immune infiltration and enrichment pathway of MATN3 in a variety of cancer types. Based on previous studies, our study explored the influence of MATN3 on cancer from a broader perspective. Knocking down MATN3 in liver cancer cell lines verified that MATN3 can reduce the proliferation and migration ability of liver cancer cells, which provided a certain basis for further exploration of the effects of MATN3 on cancer.
Supplementary Material
Supplementary figure and tables.
Abbreviations
ACC: adrenocortical carcinoma
BLCA: bladder urothelial carcinoma
BRCA: breast invasive carcinoma
CESC: cervical squamous cell carcinoma and endocervical adenocarcinoma
CHOL: cholangiocarcinoma
COAD: colon adenocarcinoma
DLBC: lymphoid neoplasm diffuse Large B-cell lymphoma
ESCA: esophageal carcinoma
GBM: glioblastoma multiforme
HNSC: head and neck squamous cell carcinoma
KICH: kidney chromophobe
KIRC: kidney renal clear cell carcinoma
KIRP: kidney renal papillary cell carcinoma
LAML: acute myeloid leukemia
LGG: brain lower grade glioma
LIHC: liver hepatocellular carcinoma
LUAD: lung adenocarcinoma
LUSC: lung squamous cell carcinoma
MESO: mesothelioma
OV: ovarian serous cystadenocarcinoma
PAAD: pancreatic adenocarcinoma
PCPG: pheochromocytoma and paraganglioma
PRAD: prostate adenocarcinoma
READ: rectum adenocarcinoma
SARC: sarcoma
SKCM: skin cutaneous melanoma
STAD: stomach adenocarcinoma
TGCT: testicular germ cell tumors
THCA: thyroid carcinoma
THYM: thymoma
UCEC: uterine corpus endometrial carcinoma
UCS: uterine carcinosarcoma
UVM: uveal melanoma
Acknowledgements
The authors are grateful to the contribution of TIMER2.0, HPA, TISIDB, UCSC, cBioPortal, Cancer SEA, UALCAN, MethSurv, GSCALite, STRING, Gene MANIA, GTEx and TCGA databases for sharing the pan cancer dataset as open access.
Funding
The research was funded by the National Natural Science Foundation of China No. 82360465 and 82060434.
Availability of data and materials
The datasets analyzed in this study are available by contacting the corresponding author.
Author contributions
Chongjiu Qin and Haifei Qin constructed the study design, Kejian Yang, Yuhua Li and Haixiang Xie made acquisition of data; Xiwen Liao, Yuhua Li, Aoyang Bi, Chunmiao Lu made acquisition of data and made data analysis. Chongjiu Qin wrote the manuscript, Tao Peng and Guangzhi Zhu guided and supervised the manuscript. All authors read and approved the final manuscript.
Ethics approval and consent to participate
This study had acquired the approval of the Ethics Committee of the first affiliated hospital of Guangxi Medical University before specimen collection, was conducted in line with the Declaration of Helsinki. Approval Number: 2024-E295-01. Written informed consent was provided by each patient.
Competing Interests
The authors have declared that no competing interest exists.
References
1. Bray F, Laversanne M, Sung H, Ferlay J, Siegel RL, Soerjomataram I. et al. Global cancer statistics 2022: GLOBOCAN estimates of incidence and mortality worldwide for 36 cancers in 185 countries. CA: a cancer journal for clinicians. 2024;74:229-63
2. Zhang C, Liu X, Jin S, Chen Y, Guo R. Ferroptosis in cancer therapy: a novel approach to reversing drug resistance. Molecular cancer. 2022;21:47
3. Long L, Zou G, Cheng Y, Li F, Wu H, Shen Y. MATN3 delivered by exosome from synovial mesenchymal stem cells relieves knee osteoarthritis: Evidence from in vitro and in vivo studies. Journal of orthopaedic translation. 2023;41:20-32
4. Li J, Xie B, Wang H, Wang Q, Wu Y. Investigating MATN3 and ASPN as novel drivers of gastric cancer progression via EMT pathways. Human molecular genetics. 2024;33:2035-50
5. Li T, Fu J, Zeng Z, Cohen D, Li J, Chen Q. et al. TIMER2.0 for analysis of tumor-infiltrating immune cells. Nucleic Acids Res. 2020;48:W509-W514
6. Mandrekar JN. Receiver operating characteristic curve in diagnostic test assessment. Journal of thoracic oncology: official publication of the International Association for the Study of Lung Cancer. 2010;5:1315-6
7. Liu X, Wu H, Liu Z. An Integrative Human Pan-Cancer Analysis of Cyclin-Dependent Kinase 1 (CDK1). Cancers. 2022;14(11):2658
8. Ru B, Wong CN, Tong Y, Zhong JY, Zhong SSW, Wu WC. et al. TISIDB: an integrated repository portal for tumor-immune system interactions. Bioinformatics. 2019;35:4200-4202
9. Li T, Fan J, Wang B, Traugh N, Chen Q, Liu JS. et al. TIMER: A Web Server for Comprehensive Analysis of Tumor-Infiltrating Immune Cells. Cancer research. 2017;77:e108-e10
10. Liu CJ, Hu FF, Xie GY, Miao YR, Li XW, Zeng Y. et al. GSCA: an integrated platform for gene set cancer analysis at genomic, pharmacogenomic and immunogenomic levels. Briefings in bioinformatics. 2023;24(1):bbac558
11. Yang G, Zheng RY, Jin ZS. Correlations between microsatellite instability and the biological behaviour of tumours. Journal of cancer research and clinical oncology. 2019;145:2891-9
12. Steuer CE, Ramalingam SS. Tumor Mutation Burden: Leading Immunotherapy to the Era of Precision Medicine? Journal of clinical oncology: official journal of the American Society of Clinical Oncology. 2018;36:631-2
13. Cerami E, Gao J, Dogrusoz U, Gross BE, Sumer SO, Aksoy BA. et al. The cBio cancer genomics portal: an open platform for exploring multidimensional cancer genomics data. Cancer discovery. 2012;2:401-4
14. Moore LD, Le T, Fan G. DNA methylation and its basic function. Neuropsychopharmacology: official publication of the American College of Neuropsychopharmacology. 2013;38:23-38
15. Han X, Wang M, Zhao YL, Yang Y, Yang YG. RNA methylations in human cancers. Seminars in cancer biology. 2021;75:97-115
16. Chandrashekar DS, Karthikeyan SK, Korla PK, Patel H, Shovon AR, Athar M. et al. UALCAN: An update to the integrated cancer data analysis platform. Neoplasia (New York, NY). 2022;25:18-27
17. Li Y, Ge D, Lu C. The SMART App: an interactive web application for comprehensive DNA methylation analysis and visualization. Epigenetics & chromatin. 2019;12:71
18. Modhukur V, Iljasenko T, Metsalu T, Lokk K, Laisk-Podar T, Vilo J. MethSurv: a web tool to perform multivariable survival analysis using DNA methylation data. Epigenomics. 2018;10:277-88
19. Szklarczyk D, Kirsch R, Koutrouli M, Nastou K, Mehryary F, Hachilif R. et al. The STRING database in 2023: protein-protein association networks and functional enrichment analyses for any sequenced genome of interest. Nucleic acids research. 2023;51:D638-d46
20. Franz M, Rodriguez H, Lopes C, Zuberi K, Montojo J, Bader GD. et al. GeneMANIA update 2018. Nucleic acids research. 2018;46:W60-w4
21. Higgins SE, Barletta JA. Applications of Immunohistochemistry to Endocrine Pathology. Advances in anatomic pathology. 2018;25:413-29
22. Xie H, Qin C, Zhou X, Liu J, Yang K, Nong J. et al. Prognostic value and potential molecular mechanism of ITGB superfamily members in hepatocellular carcinoma. Medicine. 2023;102:e34765
23. Zhou X, Liang T, Deng J, Ng K, Li M, Lv C. et al. Differential and Prognostic Significance of HOXB7 in Gliomas. Frontiers in cell and developmental biology. 2021;9:697086
24. Wu L, Qu X. Cancer biomarker detection: recent achievements and challenges. Chemical Society reviews. 2015;44:2963-97
25. Sawyers CL. The cancer biomarker problem. Nature. 2008;452:548-52
26. Pettersson M, Vaz R, Hammarsjö A, Eisfeldt J, Carvalho CMB, Hofmeister W. et al. Alu-Alu mediated intragenic duplications in IFT81 and MATN3 are associated with skeletal dysplasias. Human mutation. 2018;39:1456-67
27. Pullig O, Tagariello A, Schweizer A, Swoboda B, Schaller P, Winterpacht A. MATN3 (matrilin-3) sequence variation (pT303M) is a risk factor for osteoarthritis of the CMC1 joint of the hand, but not for knee osteoarthritis. Annals of the rheumatic diseases. 2007;66:279-80
28. Zhao Z, Mak TK, Shi Y, Li K, Huo M, Zhang C. Integrative analysis of cancer-associated fibroblast signature in gastric cancer. Heliyon. 2023;9:e19217
29. Khan M, Ai M, Du K, Song J, Wang B, Lin J. et al. Pyroptosis relates to tumor microenvironment remodeling and prognosis: A pan-cancer perspective. Frontiers in immunology. 2022;13:1062225
30. Collisson EA, Bailey P, Chang DK, Biankin AV. Molecular subtypes of pancreatic cancer. Nature reviews Gastroenterology & hepatology. 2019;16:207-20
31. Onkar SS, Carleton NM, Lucas PC, Bruno TC, Lee AV, Vignali DAA. et al. The Great Immune Escape: Understanding the Divergent Immune Response in Breast Cancer Subtypes. Cancer discovery. 2023;13:23-40
32. Liu Y, Wang Y, Yang Y, Weng L, Wu Q, Zhang J. et al. Emerging phagocytosis checkpoints in cancer immunotherapy. Signal transduction and targeted therapy. 2023;8:104
33. Guo B, Yang F, Zhang L, Zhao Q, Wang W, Yin L. et al. Cuproptosis Induced by ROS Responsive Nanoparticles with Elesclomol and Copper Combined with αPD-L1 for Enhanced Cancer Immunotherapy. Advanced materials (Deerfield Beach, Fla). 2023;35:e2212267
34. Xu C, Jiang ZB, Shao L, Zhao ZM, Fan XX, Sui X. et al. β-Elemene enhances erlotinib sensitivity through induction of ferroptosis by upregulating lncRNA H19 in EGFR-mutant non-small cell lung cancer. Pharmacological research. 2023;191:106739
35. Sun L, Wang H, Xu D, Yu S, Zhang L, Li X. Lapatinib induces mitochondrial dysfunction to enhance oxidative stress and ferroptosis in doxorubicin-induced cardiomyocytes via inhibition of PI3K/AKT signaling pathway. Bioengineered. 2022;13:48-60
36. Jardim DL, Goodman A, de Melo Gagliato D, Kurzrock R. The Challenges of Tumor Mutational Burden as an Immunotherapy Biomarker. Cancer cell. 2021;39:154-73
37. Dietlein F, Wang AB, Fagre C, Tang A, Besselink NJM, Cuppen E. et al. Genome-wide analysis of somatic noncoding mutation patterns in cancer. Science (New York, NY). 2022;376:eabg5601
38. Qi YN, Liu Z, Hong LL, Li P, Ling ZQ. Methyltransferase-like proteins in cancer biology and potential therapeutic targeting. Journal of hematology & oncology. 2023;16:89
39. Zhu J, Gao Y, Wang Y, Zhan Q, Feng H, Luo X. et al. Molecular insights into DNA recognition and methylation by non-canonical type I restriction-modification systems. Nature communications. 2022;13:6391
Author contact
![]() Corresponding author: Prof. Guangzhi Zhu, Department of Hepatobiliary Surgery, The First Affiliated Hospital of Guangxi Medical University, Shuang Yong Rd. 6#, Nanning, 530021, Guangxi Zhuang Autonomous Region, People's Republic of China. zhuguangzhi0792com.
Corresponding author: Prof. Guangzhi Zhu, Department of Hepatobiliary Surgery, The First Affiliated Hospital of Guangxi Medical University, Shuang Yong Rd. 6#, Nanning, 530021, Guangxi Zhuang Autonomous Region, People's Republic of China. zhuguangzhi0792com.