Impact Factor ISSN: 1837-9664

 Global reach, higher impact
J Cancer 2024; 15(2):466-472. doi:10.7150/jca.90525 This issue Cite
Research Paper
Lymph Node Ratio Enhances Predictive Value for Treatment Outcomes in Patients with Non-Small Cell Lung Cancer Undergoing Surgery: A Retrospective Cohort Study
Shou-Feng Wang1, Nai-Quan Mao1, Jiang-Qiong Huang2, Xin-Bin Pan2 ![]()
1. Department of Thoracic surgery, Guangxi Medical University Cancer Hospital, Nanning, Guangxi 530021, P.R. China.
2. Department of Radiation Oncology, Guangxi Medical University Cancer Hospital, Nanning, Guangxi 530021, P.R. China.
Received 2023-9-26; Accepted 2023-11-14; Published 2024-1-1
Abstract

Purpose: To compare the prognostic value of lymph node ratio (LNR) and pN in patients with non-small cell lung cancer (NSCLC) undergoing surgery.
Materials and methods: NSCLC patients were investigated between 2004 and 2015 from the Surveillance, Epidemiology, and End Results databases. The X-tile software was used to determine LNR cut-off values. Kaplan-Meier analysis was employed to assess cancer-specific survival (CSS) and overall survival (OS).
Results: The identified cut-off values of LNR were 0.19 and 0.73. Median CSS for LNR1 (LNR < 0.19), LNR2 (0.19 ≤ LNR ≤ 0.73), and LNR3 (LNR > 0.73) were 71, 41, and 17 months. Both LNR2 (HR = 1.46, 95% CI: 1.36-1.57; P < 0.001) and LNR3 (HR = 2.85, 95% CI: 2.58-3.15; P < 0.001) demonstrated poorer median CSS compared to LNR1. Similarly, median OS for LNR1, LNR2, and LNR3 were 50, 35, and 16 months. LNR2 (HR = 1.36, 95% CI: 1.27-1.45; P < 0.001) and LNR3 (HR = 2.60, 95% CI: 2.37-2.85; P < 0.001) exhibited worse median OS compared to LNR1. A revised pN (r-pN) classification incorporating LNR and pN demonstrated superior penalized goodness-of-fit and discriminative ability in predicting CSS and OS compared to both LNR and pN.
Conclusion: LNR outperformed pN in predicting CSS and OS in NSCLC patients undergoing surgery, potentially leading to more precise adjuvant treatment decisions.
Keywords: non-small cell lung cancer, surgery, lymph node ratio, survival.
Introduction
Lung cancer is a major contributor to global cancer-related mortality, accounting for 18.0% of such deaths.[1, 2] Non-small cell lung cancer (NSCLC) comprises approximately 85% of these cases.[3] The current standard of care for resectable NSCLC involves radical resection and lymph node dissection.[4] The pN stage, determined by lymph node sampling after surgery, is a major prognostic factor for survival.[5] Consequently, the precision of lymph node sampling is a critical aspect of surgical management, and it plays a pivotal role in the decision regarding adjuvant therapies.
The National Comprehensive Cancer Network (NCCN) guidelines recommend the sampling of lymph node stations with one or more nodes from all mediastinal stations. However, the minimum number of lymph nodes to be examined remains a point of debate. The International Association for the Study of Lung Cancer (IASLC) and the European Society of Thoracic Surgery (ESTS) recommend a minimum of 6 examined lymph nodes.[6, 7] In contrast, the Chinese Journal of Oncology suggests a minimum of 12 examined lymph node.[8]
The impact of examined lymph nodes on prognosis is a subject of ongoing discussion. Studies have demonstrated a connection between the number of examined lymph nodes and patient survival, with a higher count associated with improved prognosis.[9, 10] It has been suggested that 10 examined lymph nodes represent an adequate cut-off value for dissection, beyond which there is no further improvement in prognosis.[10] However, others propose 16 examined lymph nodes as the threshold for assessing the quality of lymph node examination and postoperative prognostic stratification in NSCLC patients who undergo surgery.[11] Furthermore, the effectiveness of examined lymph nodes as a representation of pN stage can be influenced by surgical quality.[12]
The lymph node ratio (LNR), defined as the ratio of pathologically metastatic lymph nodes to the total number of harvested examined lymph nodes, has been used as a prognostic factor in various cancers, including colorectal cancer[13], breast cancer[14], and gastric cancer[15]. In this study, we utilized data from the Surveillance, Epidemiology, and End Results (SEER) databases to compare the prognostic value of LNR with the conventional pN stage classification. Additionally, our objective is to propose a revised pN (r-pN) classification based on LNR and pN stages.
Materials and methods
Data source
Data for this study were extracted from the SEER databases, which contain de-identified information from population-based cancer registries in the United States. Data extraction was performed using SEER*Stat software version 8.3.6 (www.seer.cancer.gov/seerstat).
Patient population
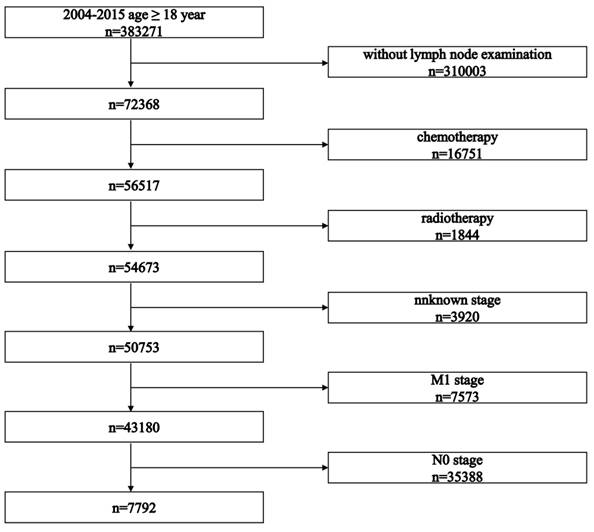
The study included NSCLC patients diagnosed between 2004 and 2015 who met specific inclusion criteria: (1) histopathologically confirmed adenocarcinoma or squamous cancer, (2) age ≥ 18 years, (3) initial therapy involving surgery, (4) lymph node examination performed, (5) definite tumor-node-metastasis (TNM) staging according to the 7th edition of the American Joint Committee on Cancer (AJCC) staging system, (6) non-M1 and non-N0 stage, and (7) no chemotherapy or radiotherapy.
Patient characteristics, including age, sex, race, primary site, tumor grade, histological types, T stage, N stage, number of resected lymph nodes, and number of positive lymph nodes, were extracted.
Endpoints
The primary endpoint, cancer-specific survival (CSS), was defined as the time between diagnosis and death attributed to lung cancer as recorded in the SEER database. The secondary endpoint, overall survival (OS), measured the time from diagnosis to death due to any cause within the SEER database.
Stratification of lymph node ratio
The LNR was calculated as the ratio of pathologically metastatic lymph nodes to the total number of harvested examined lymph nodes. To establish optimal LNR cut-off values, we utilized the X-tile software (http://www.tissuearray.org/rimmlab). X-tile generated plots by categorizing LNR into three groups: low, middle, and high-risk groups. It systematically evaluated all possible divisions of LNR and calculated the associated associations using the log-rank test for survival.
The X-tile software identified the optimal LNR division by selecting the point with the highest χ2 value. To assess statistical significance, we applied the cut-point derived from a training set to analyze a separate validation set, employing a standard log-rank test and obtaining P values from a lookup table.
The cut-off values determined by X-tile were 0.19 and 0.73. Based on these values, we defined three LNR categories, referred to as LNR stages: LNR1 (LNR < 0.19), LNR2 (0.19 ≤ LNR ≤ 0.73), and LNR3 (LNR > 0.73). To maintain consistency with the 7th edition of the AJCC staging system, we developed a revised pN (r-pN) classification. This r-pN classification stratified the current pN categories into r-pN categories based on LNR stages.
Comparison of predictive performance
The predictive performance of pN, LNR, and r-pN stages was assessed using Harrell's concordance index (C-index) and Akaike information criterion (AIC).[16, 17] Harrell's C-index measures the proportion of correctly ordered pairs of patients' predicted survival times among all possible pairs. Higher C-index values indicate better discrimination. The AIC is calculated as (2 × the number of parameters in the model)-(2 × the log maximum likelihood), with lower AIC values indicating better calibration.
Statistical analysis
Age, categorized based on 60 years, and categorical variables such as sex, race, primary site, tumor grade, histological types, and T stage were compared among N stages, LNR stages, and r-pN stages using the χ2 test or Fisher's exact test.
CSS and OS were compared using Kaplan-Meier methods, with log-rank test statistics applied between pN subgroups. Similar comparisons were made between LNR subgroups. Survival curves for different risk subgroups of the r-pN stages were generated using the Kaplan-Meier method and subjected to pairwise log-rank tests.
Statistical analyses were conducted using SPSS Statistics Version 26.0 software (IBM Co., Armonk, NY, USA) and R software (version 4.2.2). Statistical significance was determined using two-tailed P values below 0.05.
Results
Patient selection and characteristics
The selection process is presented in Figure 1. The study initially identified 383,271 patients. After applying inclusion criteria, 7,792 patients who received surgery as initial treatment were included in this retrospective cohort study. Baseline characteristics of all included patients are summarized in Table 1. Baseline characteristics between LNR stages and pN stages are summarized in Tables 2 and 3, respectively.
Flowchart illustrating the patient selection process.
Description of baseline patient characteristics.
| Variables | Overall (N=7792) |
|---|---|
| Age | |
| ≤60 | 2202 (28.3%) |
| >60 | 5590 (71.7%) |
| Sex | |
| Female | 3627 (46.5%) |
| Male | 4165 (53.5%) |
| Race | |
| White | 6441 (82.7%) |
| Black | 721 (9.3%) |
| Others | 630 (8.0%) |
| Site | |
| Upper lobe | 4213 (54.1%) |
| Lower lobe | 2731 (35.0%) |
| Main bronchus | 148 (1.9%) |
| Middle lobe | 367 (4.7%) |
| Overlapping | 333 (4.3%) |
| Grade | |
| Ⅰ/Ⅱ | 3988 (51.2%) |
| Ⅲ/Ⅳ | 3804 (48.8%) |
| Histology | |
| Adenocarcinoma | 5117 (65.7%) |
| Squamous cell carcinoma | 2675 (34.3%) |
| T stage | |
| T1 | 2028 (26.0%) |
| T2 | 4411 (56.6%) |
| T3 | 457 (5.9%) |
| T4 | 896 (11.5%) |
Description of baseline patient characteristics based on lymph node ratio.
| LNR1 (N=3585) | LNR2 (N=3397) | LNR3 (N=810) | P | |
|---|---|---|---|---|
| Age | 0.426 | |||
| ≤60 | 1039 (29.0%) | 939 (27.6%) | 224 (27.7%) | |
| >60 | 2546 (71.0%) | 2458 (72.4%) | 586 (72.3%) | |
| Sex | <0.001 | |||
| Female | 1581 (44.1%) | 1639 (48.2%) | 407 (50.2%) | |
| Male | 2004 (55.9%) | 1758 (51.8%) | 403 (49.8%) | |
| Race | 0.010 | |||
| White | 3021 (84.3%) | 2761 (81.3%) | 659 (81.4%) | |
| Black | 296 (8.3%) | 338 (9.9%) | 87 (10.7%) | |
| Others | 268 (7.4%) | 298 (8.8%) | 64 (7.9%) | |
| Site | <0.001 | |||
| Upper lobe | 1994 (55.6%) | 1814 (53.4%) | 405 (50.0%) | |
| Lower lobe | 1228 (34.3%) | 1221 (35.9%) | 282 (34.8%) | |
| Main bronchus | 83 (2.3%) | 55 (1.6%) | 10 (1.2%) | |
| Middle lobe | 134 (3.7%) | 173 (5.2%) | 60 (7.5%) | |
| Overlapping | 146 (4.1%) | 134 (3.9%) | 53 (6.5%) | |
| Grade | <0.001 | |||
| Ⅰ/Ⅱ | 1897 (52.9%) | 1746 (51.4%) | 345 (42.6%) | |
| Ⅲ/Ⅳ | 1688 (47.1%) | 1651 (48.6%) | 465 (57.4%) | |
| Histology | <0.001 | |||
| Adenocarcinoma | 2141 (59.7%) | 2354 (69.3%) | 622 (76.8%) | |
| Squamous cell carcinoma | 1444 (40.3%) | 1043 (30.7%) | 188 (23.2%) | |
| T stage | <0.001 | |||
| T1 | 898 (25.1%) | 926 (27.3%) | 204 (25.2%) | |
| T2 | 2111 (58.9%) | 1940 (57.1%) | 360 (44.4%) | |
| T3 | 238 (6.6%) | 172 (5.1%) | 47 (5.8%) | |
| T4 | 338 (9.4%) | 359 (10.6%) | 199 (24.6%) |
LNR: lymph node ratio.
Description of baseline patient characteristics based on pN stage.
| N1 (N=4999) | N2 (N=2660) | N3 (N=133) | P | |
|---|---|---|---|---|
| Age | 0.122 | |||
| ≤60 | 1424 (28.5%) | 731 (27.5%) | 47 (35.3%) | |
| >60 | 3575 (71.5%) | 1929 (72.5%) | 86 (64.7%) | |
| Sex | <0.001 | |||
| Female | 2252 (45.0%) | 1319 (49.6%) | 56 (42.1%) | |
| Male | 2747 (55.0%) | 1341 (50.4%) | 77 (57.9%) | |
| Race | 0.203 | |||
| White | 4170 (83.4%) | 2161 (81.2%) | 110 (82.7%) | |
| Black | 445 (8.9%) | 263 (9.9%) | 13 (9.8%) | |
| Others | 384 (7.7%) | 236 (8.9%) | 10 (7.5%) | |
| Site | 0.001 | |||
| Upper lobe | 2685 (53.7%) | 1458 (54.8%) | 70 (52.6%) | |
| Lower lobe | 1765 (35.3%) | 925 (34.8%) | 41 (30.8%) | |
| Main bronchus | 105 (2.1%) | 40 (1.5%) | 3 (2.3%) | |
| Middle lobe | 241 (4.8%) | 123 (4.6%) | 3 (2.3%) | |
| Overlapping | 203 (4.1%) | 114 (4.3%) | 16 (12.0%) | |
| Grade | <0.001 | |||
| Ⅰ/Ⅱ | 2613 (52.3%) | 1330 (50.0%) | 45 (33.8%) | |
| Ⅲ/Ⅳ | 2386 (47.7%) | 1330 (50.0%) | 88 (66.2%) | |
| Histology | <0.001 | |||
| Adenocarcinoma | 3110 (62.2%) | 1917 (72.1%) | 90 (67.7%) | |
| Squamous cell carcinoma | 1889 (37.8%) | 743 (27.9%) | 43 (32.3%) | |
| T stage | <0.001 | |||
| T1 | 1317 (26.3%) | 673 (25.3%) | 38 (28.6%) | |
| T2 | 2906 (58.2%) | 1462 (55.0%) | 43 (32.3%) | |
| T3 | 296 (5.9%) | 155 (5.8%) | 6 (4.5%) | |
| T4 | 480 (9.6%) | 370 (13.9%) | 46 (34.6%) |
Cancer-specific survival
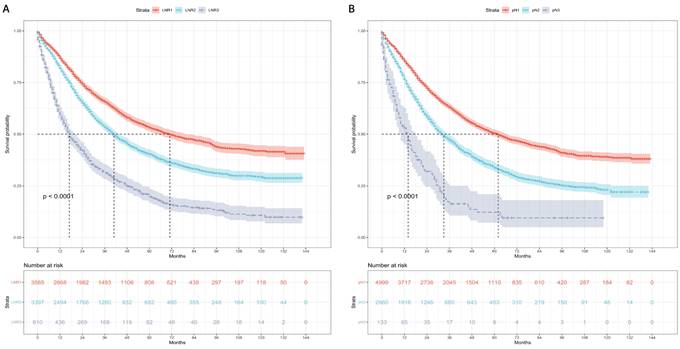
Kaplan-Meier curves and risk tables of CSS for LNR stages are illustrated in Figure 2A. The median CSS rates for patients with LNR1, LNR2, and LNR3 were 71, 41, and 17 months, respectively (Table 4). Pairwise comparisons revealed significantly different median CSS rates. LNR2 (HR = 1.46, 95% CI: 1.36-1.57; P < 0.001) and LNR3 (HR = 2.85, 95% CI: 2.58-3.15; P < 0.001) had worse median CSS compared to LNR1.
Cause-specific survival based on the LNR and pN stages. (A) LNR stage. (B) pN stage. LNR: lymph node ratio. LNR1: LNR < 0.19, LNR2: 0.19 ≤ LNR ≤ 0.73,
Cancer-specific survival and overall survival based on LNR and pN stages.
| LNR | N | |||||
|---|---|---|---|---|---|---|
| LNR1 | LNR2 | LNR3 | N1 | N2 | N3 | |
| Cancer-Specific Survival | ||||||
| No. of events | 1351 | 1738 | 569 | 2039 | 1514 | 105 |
| Median (months) | 71 | 41 | 17 | 62 | 33 | 14 |
| HR (95% CI) | reference | 1.46 (1.36-1.57) | 2.85 (2.58-3.15) | reference | 1.61 (1.51-1.73) | 3.21 (2.63-3.92) |
| P value$ | <0.001 | <0.001 | ||||
| Overall Survival | ||||||
| No. of events | 1750 | 2067 | 651 | 2599 | 1757 | 112 |
| Median (months) | 50 | 35 | 16 | 46 | 29 | 13 |
| HR (95% CI) | reference | 1.36 (1.27-1.45) | 2.60 (2.37-2.85) | reference | 1.50 (1.41-1.60) | 2.81 (2.33-3.41) |
| P value$ | <0.001 | <0.001 | ||||
LNR: lymph node ratio. HR: hazard ratio. CI: confidence interval. $: P values were obtained with the use of the log-rank test for overall comparisons among three groups. Pairwise comparisons among groups are also statistically significant with the adjustment of Benjamini-Hochberg method.
Kaplan-Meier curves and risk tables of CSS for pN stages are depicted in Figure 2B. The median CSS rates for patients with pN1, pN2, and pN3 were 62, 33, and 14 months, respectively (Table 4). Significant differences in median CSS rates were observed in pairwise comparisons. pN2 (HR = 1.61, 95% CI: 1.51-1.73; P < 0.001) and pN3 (HR = 3.21, 95% CI: 2.63-3.92; P < 0.001) had worse median CSS compared to pN1.
Overall survival
Kaplan-Meier curves and risk tables of OS for LNR stages are presented in Figure 3A. The median OS rates for patients with LNR1, LNR2, and LNR3 were 50, 35, and 16 months, respectively (Table 4). Pairwise comparisons revealed significantly different median OS rates. LNR2 (HR = 1.36, 95% CI: 1.27-1.45; P < 0.001) and LNR3 (HR = 2.60, 95% CI: 2.37-2.85; P < 0.001) had worse median OS compared to LNR1.
Overall survival based on the LNR and pN stages. (A) LNR stage. (B) pN stage. LNR: lymph node ratio. LNR1: LNR < 0.19, LNR2: 0.19 ≤ LNR ≤ 0.73, LNR3: LNR > 0.73.
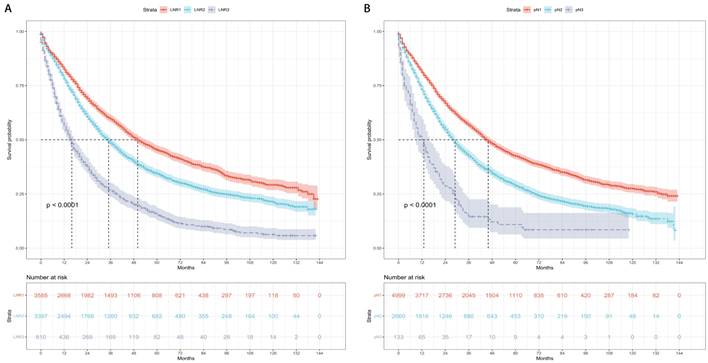
Kaplan-Meier curves and risk tables of OS for pN stages are shown in Figure 3B. The median OS rates for patients with pN1, pN2, and pN3 were 46, 29, and 13 months, respectively (Table 4). Significant differences in median OS rates were observed in pairwise comparisons. pN2 (HR = 1.50, 95% CI: 1.41-1.60; P < 0.001) and pN3 (HR = 2.81, 95% CI: 2.33-3.41; P < 0.001) had worse median OS compared to pN1.
Predictive performance
Table 5 presents the AIC and Harrell's C-index, comparing the predictive performance of LNR, pN, and r-pN stages in multivariable proportional hazards models. The LNR stages exhibited better penalized goodness-of-fit (AIC: 59,919 vs. 60,040) and better discriminant ability (Harrell's C-index: 0.648 vs. 0.640) than the pN stages in predicting CSS. Similarly, the LNR stages showed better penalized goodness-of-fit (AIC: 72,957 vs. 73,100) and better discriminant ability (Harrell's C-index: 0.642 vs. 0.633) than the pN stages in predicting OS.
Comparison of predictive performance for cancer-specific survival and overall survival based on LNR, pN, and r-pN stages.
| Cancer-specific survival | Overall Survival | |||
|---|---|---|---|---|
| AIC$ | Harrell's C-index& | AIC$ | Harrell's C-index& | |
| LNR | 59919 | 0.648 | 72957 | 0.642 |
| pN | 60040 | 0.640 | 73100 | 0.633 |
| r-pN | 59814 | 0.656 | 72872 | 0.648 |
LNR: lymph node ratio. r-pN: revised pN. AIC: akaike information criterion. $: The lower the AIC value is, the better the calibration. &: The higher the Harrell's C-index is, the better the discrimination.
The r-pN stages deed the best predictive performance among LNR stages, pN stages, and r-pN stages. In predicting CSS, the AIC was 59,814, and the Harrell's C-index was 0.656. In predicting OS, the AIC was 72,872, and the Harrell's C-index was 0.648.
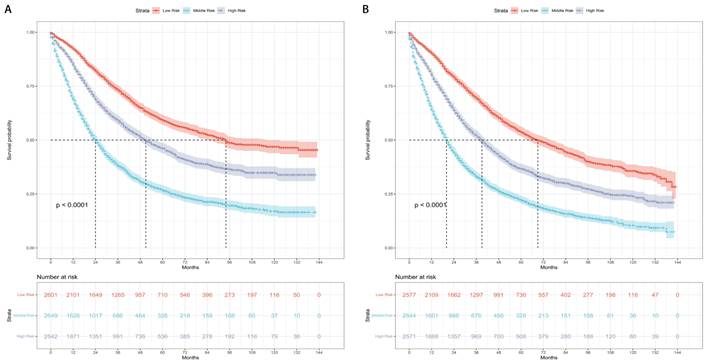
The patients were categorized into three risk subgroups (low-risk, medium-risk, and high-risk) according to the r-pN stages. A significant difference in the prognostic classification for predicting CSS and OS was observed through the log-rank test (P < 0.001) (Figure 4). Consequently, the r-pN stages proved to be effective in distinguishing both CSS and OS among the suggested risk subgroups of NSCLC patients.
Kaplan-Meier survival curves for the revised pN stages categorized into low-risk, medium-risk, and high-risk subgroups. (A) Cause-specific survival. (B) Overall survival.
Discussion
The TNM staging system is a critical prognostic factor in NSCLC, with N stage being among the most significant, as survival substantially decreases with increasing N stage.[18] Nevertheless, N stage relies solely on the location and involvement of positive lymph nodes, which may not fully encapsulate the biological heterogeneity present in NSCLC.[19] Patients sharing the same N stage can still exhibit diverse treatment outcomes, underscoring the need for a more precise classification based on N stage.[20]
Previous studies have highlighted the prognostic importance of examining lymph nodes in NSCLC patients,[9, 10, 21, 22] recognizing adequate lymphadenectomy as an independent prognostic factor correlated with better outcomes. However, discrepancies in surgical quality among hospitals and surgeons may affect the extent of lymph node examination, potentially limiting its ability to accurately represent the true N stages.[5, 12]
The LNR, considering both the number of positive lymph nodes and the number of examined lymph nodes, had emerged as a valuable prognostic factor in NSCLC.[23-25] Our study reaffirmed the LNR's significance as an independent prognostic factor for both CSS and OS. Moreover, the LNR categories (LNR1 [LNR < 0.19], LNR2 [0.19 ≤ LNR ≤ 0.73], and LNR3 [LNR > 0.73]) demonstrated superior discriminatory and predictive abilities for prognosis compared to pN stages. These findings indicated that the LNR is a simple, convenient, and reproducible prognostic factor that can effectively stratify NSCLC patients.
In conclusion, our study emphasizes the prognostic significance of the LNR in NSCLC patients undergoing radical surgery. LNR staging outperforms pN staging in terms of predictive accuracy. Additionally, the r-pN classification, which integrates both LNR and pN stages, holds promise for tailoring more precise adjuvant treatment strategies.
Abbreviations
NSCLC: non-small cell lung cancer; NCCN: National Comprehensive Cancer Network; IASLC: International Association for the Study of Lung Cancer; ESTS: European Society of Thoracic Surgery; LNR: lymph node ratio; SEER: Surveillance, Epidemiology, and End Results cancer databases; TNM: tumor-node-metastasis; AJCC: American Joint Committee on Cancer; CSS: cancer-specific survival; OS: overall survival; C-index: the Harrell's concordance index; AIC: akaike information criterion; HR: hazard ratio; CI: confidence interval.
Acknowledgements
Ethics approval and consent to participate
1. Ethics approval was waived by the ethics committee/Institutional Review Board of Guangxi Medical University Cancer Hospital.
2. Informed consent was waived by the ethics committee/Institutional Review Board of Guangxi Medical University Cancer Hospital.
Availability of data and material
The data are available from the corresponding author upon request.
Author contributions
Conceptualization: Shou-Feng Wang; Methodology: Shou-Feng Wang and Nai-Quan Mao; Formal Analysis: Nai-Quan Mao and Jiang-Qiong Huang; Investigation: Shou-Feng Wang; Resources: Xin-Bin Pan; Validation: Nai-Quan Mao and Jiang-Qiong Huang; Writing-Original Draft Preparation: Shou-Feng Wang; Writing-Review & Editing: Xin-Bin Pan.
Competing Interests
The authors have declared that no competing interest exists.
References
1. Sung H, Ferlay J, Siegel RL, Laversanne M, Soerjomataram I, Jemal A. et al. Global Cancer Statistics 2020: GLOBOCAN Estimates of Incidence and Mortality Worldwide for 36 Cancers in 185 Countries. CA Cancer J Clin. 2021;71:209-49
2. Siegel RL, Miller KD, Fuchs HE, Jemal A. Cancer statistics, 2022. CA Cancer J Clin. 2022;72:7-33
3. McKeage MJ, Jameson MB, Investigators ASSG. Comparative outcomes of squamous and non-squamous non-small cell lung cancer (NSCLC) patients in phase II studies of ASA404 (DMXAA) - retrospective analysis of pooled data. J Thorac Dis. 2010;2:199-204
4. Ettinger DS, Wood DE, Aisner DL, Akerley W, Bauman JR, Bharat A. et al. NCCN Guidelines Insights: Non-Small Cell Lung Cancer, Version 2.2021. J Natl Compr Canc Netw. 2021;19:254-66
5. Smeltzer MP, Faris NR, Ray MA, Osarogiagbon RU. Association of Pathologic Nodal Staging Quality With Survival Among Patients With Non-Small Cell Lung Cancer After Resection With Curative Intent. JAMA Oncol. 2018;4:80-7
6. Asamura H, Chansky K, Crowley J, Goldstraw P, Rusch VW, Vansteenkiste JF. et al. The International Association for the Study of Lung Cancer Lung Cancer Staging Project: Proposals for the Revision of the N Descriptors in the Forthcoming 8th Edition of the TNM Classification for Lung Cancer. J Thorac Oncol. 2015;10:1675-84
7. De Leyn P, Dooms C, Kuzdzal J, Lardinois D, Passlick B, Rami-Porta R. et al. Revised ESTS guidelines for preoperative mediastinal lymph node staging for non-small-cell lung cancer. Eur J Cardiothorac Surg. 2014;45:787-98
8. Chinese Medical A, Oncology Society of Chinese Medical A, Chinese Medical Association Publishing H. [Chinese Medical Association guidelines for clinical diagnosis and treatment of lung cancer (Edition 2018)]. Zhonghua Zhong Liu Za Zhi. 2018;40:935-64
9. Mei W, Yao W, Song Z, Jiao W, Zhu L, Huang Q. et al. Development and validation of prognostic nomogram for T(1-3)N(0)M(0) non-small cell lung cancer after curative resection. BMC Cancer. 2023;23:715
10. Zhu Z, Song Z, Jiao W, Mei W, Xu C, Huang Q. et al. A large real-world cohort study of examined lymph node standards for adequate nodal staging in early non-small cell lung cancer. Transl Lung Cancer Res. 2021;10:815-25
11. Liang W, He J, Shen Y, Shen J, He Q, Zhang J. et al. Impact of Examined Lymph Node Count on Precise Staging and Long-Term Survival of Resected Non-Small-Cell Lung Cancer: A Population Study of the US SEER Database and a Chinese Multi-Institutional Registry. J Clin Oncol. 2017;35:1162-70
12. Thomas PA. Intraoperative lymph-node assessment during NSCLC surgery: the need for standardisation and quality evaluation. Lancet Oncol. 2019;20:23-5
13. Tong LL, Gao P, Wang ZN, Song YX, Xu YY, Sun Z. et al. Can lymph node ratio take the place of pN categories in the UICC/AJCC TNM classification system for colorectal cancer? Ann Surg Oncol. 2011;18:2453-60
14. Soran A, Ozmen T, Salamat A, Soybir G, Johnson R. Lymph Node Ratio (LNR): Predicting Prognosis after Neoadjuvant Chemotherapy (NAC) in Breast Cancer Patients. Eur J Breast Health. 2019;15:249-55
15. Spolverato G, Ejaz A, Kim Y, Squires MH, Poultsides G, Fields RC. et al. Prognostic Performance of Different Lymph Node Staging Systems After Curative Intent Resection for Gastric Adenocarcinoma. Ann Surg. 2015;262:991-8
16. Harrell FE Jr, Lee KL, Mark DB. Multivariable prognostic models: issues in developing models, evaluating assumptions and adequacy, and measuring and reducing errors. Statistics in medicine. 1996;15:361-87
17. Harrell FE Jr, Califf RM, Pryor DB, Lee KL, Rosati RA. Evaluating the yield of medical tests. Jama. 1982;247:2543-6
18. Goldstraw P, Chansky K, Crowley J, Rami-Porta R, Asamura H, Eberhardt WE. et al. The IASLC Lung Cancer Staging Project: Proposals for Revision of the TNM Stage Groupings in the Forthcoming (Eighth) Edition of the TNM Classification for Lung Cancer. J Thorac Oncol. 2016;11:39-51
19. Li S, Yan S, Lu F, Lv C, Wang Y, Li X. et al. Validation of the 8th Edition Nodal Staging and Proposal of New Nodal Categories for Future Editions of the TNM Classification of Non-Small Cell Lung Cancer. Ann Surg Oncol. 2021;28:4510-6
20. Rami-Porta R. Future Perspectives on the TNM Staging for Lung Cancer. Cancers (Basel). 2021 13
21. Zhou X, Wu C, Cheng Q. Negative Lymph Node Count Predicts Survival of Resected Non-small Cell Lung Cancer. Lung. 2020;198:839-46
22. Chiappetta M, Lococo F, Leuzzi G, Sperduti I, Petracca-Ciavarella L, Bria E. et al. External validation of the N descriptor in the proposed tumour-node-metastasis subclassification for lung cancer: the crucial role of histological type, number of resected nodes and adjuvant therapy. Eur J Cardiothorac Surg. 2020;58:1236-44
23. Feng N, Wu B, Zhang X, Chen J, Xiang Z, Wei Y. et al. Lymph node ratio predicts overall survival in patients with stage II non-small cell lung cancer: a population-based SEER analysis. Discov Oncol. 2022;13:75
24. Yu Q, Du X, Fang Z, Mao X, Wu J, Wang B. et al. Predictive Risk Factors for Early Recurrence of Stage pIIIA-N2 Non-Small Cell Lung Cancer. Cancer Manag Res. 2021;13:8651-61
25. Aksoy Y, Citak N, Obuz C, Metin M, Sayar A. Does anatomical location-based metastatic lymph node density affect prognosis in lung cancer patients? Interact Cardiovasc Thorac Surg. 2021;33:541-9
Author contact
![]() Corresponding author: Xin-Bin Pan, Address: No. 71 Hedi Road, Qingxiu District, Nanning, Guangxi 530021, China Email: panxinbinedu.cn, Telephone: +8613471171468, Fax: 0771-5312000.
Corresponding author: Xin-Bin Pan, Address: No. 71 Hedi Road, Qingxiu District, Nanning, Guangxi 530021, China Email: panxinbinedu.cn, Telephone: +8613471171468, Fax: 0771-5312000.