Impact Factor ISSN: 1837-9664

 Global reach, higher impact
J Cancer 2023; 14(10):1837-1847. doi:10.7150/jca.83910 This issue Cite
Research Paper
Protein expression of S100A2 reveals it association with patient prognosis and immune infiltration profile in colorectal cancer
Phimmada Hatthakarnkul1,2, Aula Ammar1, Kathryn A. F. Pennel1, Leah Officer-Jones6, Silvia Cusumano6, Jean A. Quinn1, Amna Ahmed Mohemmed Matly1, Peter G. Alexander3, Jennifer Hay5, Ditte Andersen7, Gerard Lynch1, Hester C. van Wyk3, Noori Maka3, Donald C. McMillan3, John Le Quesne6,1, Chanitra Thuwajit4, Joanne Edwards1 ![]()
1. School of Cancer Sciences, University of Glasgow, Wolfson Wohl Cancer Research Centre, Garscube Estate, Glasgow, United Kingdom.
2. Biomedical Science Program, Faculty of Medicine Siriraj Hospital, Mahidol University, Bangkok, Thailand.
3. School of Medicine, University of Glasgow, Glasgow Royal Infirmary, Alexandria Parade, Glasgow, United Kingdom.
4. Department of Immunology, Faculty of Medicine Siriraj Hospital, Mahidol University, Bangkok, Thailand.
5. Glasgow Tissue Research Facility, University of Glasgow, Queen Elizabeth University Hospital, Glasgow, United Kingdom.
6. Cancer Research UK Beatson Institute, Garscube Estate, Glasgow, United Kingdom.
7. BioClavis Ltd, Glasgow, United Kingdom.
Received 2023-2-28; Accepted 2023-5-30; Published 2023-6-19
Abstract

Purpose: Colorectal cancer (CRC) is the third most diagnosed cancer worldwide. Despite a well-established knowledge of tumour development, biomarkers to predict patient outcomes are still required. S100 calcium-binding protein A2 (S100A2) has been purposed as a potential marker in many types of cancer, however, the prognostic value of S100A2 in CRC is rarely reported.
Material and Methods: In this study, immunohistochemistry (IHC) was performed to identify the prognostic role of S100A2 protein expression in the tumour core of the tissue microarrays (TMAs) in colorectal cancer patients (n=787). Bulk RNA transcriptomic data was used to identify significant genes compared between low and high cytoplasmic S100A2 groups. Multiplex immunofluorescence (mIF) was performed to further study and confirm the immune infiltration in tumours with low and high cytoplasmic S100A2.
Results: Low cytoplasmic protein expression of S100A2 in the tumour core was associated with poor survival (HR 0.539, 95%CI 0.394-0.737, P<0.001) and other adverse tumour phenotypes. RNA transcriptomic analysis showed a gene significantly associated with the low cytoplasmic S100A2 group (AKT3, TAGLN, MYLK, FGD6 and ETFDH), which correlated with tumour development and progression. GSEA analysis identifies the enriched anti-tumour and immune activity group of genes in high cytoplasmic S100A2. Additionally, mIF staining showed that high CD3+FOXP3+ and CD163+ inversely associated with low cytoplasmic S100A2 (P<0.001, P=0.009 respectively).
Conclusion: Our finding demonstrates a prognostic value of S100A2 together with the correlation with immune infiltration in CRC.
Keywords: S100A2, inflammatory, colorectal cancer
Introduction
Colorectal cancer (CRC) is the fourth most diagnosed cancer in the UK and a major cause of worldwide cancer-related mortality. [1]. Advances in surgery, chemotherapy and the screening program have dramatically improved patients' survival, however disease metastases remain a challenge for cancer treatment [2-4]. Many approaches have been proposed in terms of the identification of novel prognostic markers in CRC, however, only a few have been translated to the clinic [5].
There is increasing evidence that the family of proteins S100, a conserved sub-family of elongation factor (EF)-hand type calcium-binding proteins, may have a prognostic role in tumour progression [6, 7]. S100 calcium-binding protein A2 (S100A2) has been reported to function either as a tumour suppressor or promoter [8, 9]. Although the function of this protein requires elucidation, S100A2 has been described as a potential predictive marker in various types of cancer [10-16]. Despite its role in malignant disease, though only reported in a few studies, S100A2 was also involved in the development of inflammatory disease [17].
Immunotherapy has emerged as a treatment option as a result of recent publications suggesting a role for inflammation in CRC progression and metastasis [18, 19]. S100 proteins have been shown to play an important role in inflammatory and autoimmune diseases [20]. For example, the binding of S100A8/A9 to TLR4 could stimulate inflammation, cell proliferation and tumour development through NF-kB signalling [21], and its elevation was shown to mediate the effect of tumour necrosis factor- alpha (TNF-α) during chronic inflammation [22]. Despite a few studies, S100A2 may be related to the regulation of different populations of immune cells [23]. This study aims to identify the prognostic value of S100A2 and its association with infiltrating immune cells in CRC patients.
Material and Methods
Patient cohorts
A cohort of 787 patients with stage I-III CRC who had undergone surgical resection at Glasgow Royal Infirmary (Glasgow, UK) between 1997 and 2013 was included in immunohistochemistry (IHC) and multiplex immunofluorescence (mIF) analysis. The inclusion criteria of patients enrolled in this study are that if this was the first cancer with no preceding history, presented for the first time at the clinic and were excluded if they had co-morbidities. In addition, patients who died within 30 days of surgery, had emergency surgery or received neoadjuvant therapy were excluded. A previously constructed TMA was utilised for IHC and mIF experiments with three 0.6 mm cores per patient to account for tumour heterogeneity. Tumour staging was carried out using the 5th Edition of the AJCC/UICC-TNM staging system by the time tissues were collected. Clinicopathological data were collected with a minimum of 5 years follow-up years post-resection.
Western blot
Western blot analysis was conducted to demonstrate the specificity of antibodies used for IHC. S100A2 293T cell transient overexpressed lysate (H00006273-T01, Novus biologicals) was loaded into a 4-12% sodium dodecyl sulfate-polyacrylamide gel and separated by electrophoresis (SDS-PAGE). The protein was then transferred to a polyvinylidene fluoride (PVDF) membrane and blocked with 5% skimmed milk in Tris-buffered saline with Tween (TBST). The membrane was incubated with S100A2 antibody (PA5-31861, Thermofisher, 1:5000) and then with secondary antibody conjugated HRP (7074S, Cell signalling, 1:6000). Finally, the HRP signal was detected using PierceTM ECL Western (Thermo ScientificTM). The membrane was imaged using a Gel Doc instrument (G:Box Chemi XR5, Cambridge, UK). β-tubulin (ab21058, Abcam, 1:5000) was used as a loading control.
Immunohistochemistry (IHC)
IHC was performed on a previously constructed TMA (n=787). Briefly, TMAs were dewaxed by immersion in Histoclear and rehydrated through a series of alcohols. Heat-induced antigen retrieval was performed in citrate buffer (pH6), after which the sections were incubated in 3% H2O2. Non-specific binding was blocked with 5% horse serum before overnight incubation with S100A2 antibody at 4oC (PA5-31861, 1:4000, Thermofisher). Staining was visualised using ImmPRESS and ImmPACT DAB (Vector Laboratories, SK4105). The tissue was counterstained using Haematoxylin Gill III (3801540E, Leica Biosystems) before being dehydrated and mounted using Pertex® (SEA-0100-00A, Histolab). Appropriate negative controls were included.
Scoring method
Stained TMA sections were scanned using a Hamamatsu NanoZoomer (Welwyn Garden City, Hertfordshire, UK) at x20 magnification on NDP.view2 (version 2.8.24). The weighted histoscore was calculated for cytoplasmic S100A2 expression as follows: 0x not stained + 1x weakly stained + 2x moderately stained + 3x strongly stained. A range of scores from 0 to 300 was obtained for cytoplasmic staining. Manual histoscoring was employed to assess expression, 10% of cores were double-scored by an independent observer with the correlation coefficient >0.7 achieved.
Transcriptomic analysis
Single tissue sections from CRC cohort (n=787) who had undergone resection for CRC were used for Templated Oligo-Sequencing (TempO-Seq) analysis using a Whole Transcriptome panel. Briefly, formalin-fixed paraffin-embedded (FFPE) tissue was deparaffinised prior to tissue digestion. The tissue lysate was combined with detector oligos which were annealed in immediate juxtaposition to each other on the targeted RNA template and ligated [24]. Amplification of ligated oligos was performed using a unique primer set for each sample, introducing a sample-specific barcode and Illumina adaptors. Barcoded samples were pooled into a single library and run on an Illumina HiSeq 2500 High Output v4 flowcell. Sequencing reads were demultiplexed using BCL2FASTQ software (Illumina, USA). FASTQ files were aligned to the Human Whole Transcriptome v2.0 panel, which consists of 22,537 probes, using STAR [25]. Up to two mismatches were allowed in the 50-nucleotide sequencing read.
Gene Set Enrichment Analysis (GSEA) for S100A2
In this study, the normalised counts of TempO-Seq data (n=610) from DESeq2 were utilised and analysed through the GSEA program [26] (https://www.gsea-msigdb.org/gsea/msigdb/index.jsp). The molecular signature database (MSigDB) was used based on the comparison between tumours with low and high cytoplasmic S100A2 [27]. The enrichment pathways were determined based on the nominal P-value and false discovery rate (FDR).
Multiplex immunofluorescence (mIF)
Two panels of antibodies were used to perform mIF on CRC TMAs (n=787). On panel 1, a fully automated mIF assay was developed on the Ventana Discovery Ultra autostainer platform (Roche Tissue Diagnostics, software version RUO Discovery Universal V21.00.0019). Staining was performed on 4 µm thick sections of previously constructed TMAs with the optimised antibodies (Table S1). A negative control slide was used on each staining run to rule out non-specific staining. Whole slide images were captured at 10x magnification using the PhenoImager HT multispectral slide scanner (Akoya Biosciences V1.0.13), TMA maps were applied using Phenochart software (Akoya Biosciences V1.1.0), and core images were captured at 20x magnification. Core images were spectrally unmixed using Inform software (Akoya Biosciences, software version 2.5.1).
mIF panel 2 was stained using an autostainer (Thermofisher) with optimised antibodies (Table S1). The slides were scanned by NanoZoomer S60 digital slide scanner (Hamamatsu, USA) with 20x magnification. TMA maps were applied for further analysis. Visiopharm (version 2021.02.5.10297), a digital precision pathology software, was used to perform the analysis. The percent positive cells of total cells detected for each marker were calculated (Figure S1).
Statistical analysis
The TempO-Seq data was analysed in R studio using DESeq2 packages. The differential gene expression between the patients with low and high cytoplasmic S100A2, was analysed for statistical significance using the Wald test.
Maxstat and survminer packages were utilised to determine optimal thresholds for high and low expression groups for weighted histoscores and counts from multiplex staining. The statistical analysis was performed in IBM SPSS Statistic Version 27.0. Pearson's χ2 test assessed the relationship between cytoplasmic S100A2 expression and clinicopathological features. The likelihood ratio and Mann-Whitney U test were used when required. Patient survival was assessed by Kaplan-Meier analysis and log-rank to test the significance. Univariate and multivariate Cox hazard regression was performed to estimate the hazard ratio (HR) for cancer-specific survival (CSS) and identify the significant prognostic factors in CRC patients. For the association with immune cells, bar charts were plotted using using GraphPad Prism version 8 (GraphPad Software Inc.). In this study, a p-value or nominal p ≤ 0.05 with FDR < 0.25 was considered statistically significant.
Results
Clinicopathological parameters of 787 CRC cohort
To further investigate the role of S100A2 at the protein level, the TMA from the GRI CRC cohort (n=787) was utilised. This was reduced from 787 to 644 CRC patients after exclusions were applied (Figure S2). 205 (32%) patients were under 65, 208 (32%) were between 65-74 and 231 (36%) were over 75 years of age, with n=353 males and n=291 females. The median follow-up was 91 months. 644 patients had valid scores for S100A2 tumour cytoplasmic staining (Table S2).
Immunohistochemistry of S100A2 in CRC TMAs
Protein expression of S100A2 was determined by IHC in TMAs to investigate its role in CRC. Firstly, antibody specificity was performed using western blot. A single band was observed by western blot using a commercial 293T cell lysate overexpressed with S100A2 and a faint band was observed for HCT116 cell line lysate, known to express S100A2 at low levels, and a stronger band was shown for MDA-MB-231 breast cancer cell line lysate, known to express S100A2 at higher levels. Expression of lysates was identified using the cancer dependency map (DepMap; https://depmap.org/) (Figure S3).
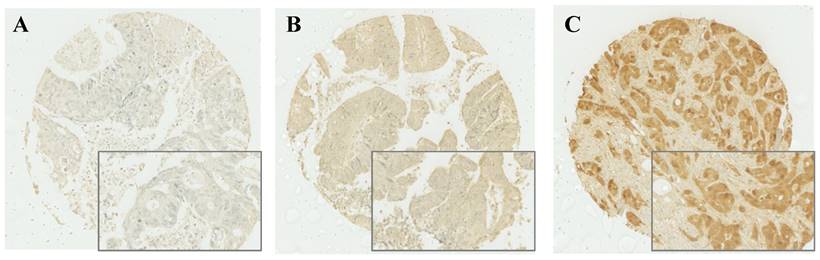
After IHC was performed, cytoplasmic expression of S100A2 was observed and a weighted histoscore was employed to quantify protein expression (Figure 1). To classify patients into high and low expression of S100A2, a threshold of 90 was generated based on the histoscore of S100A2 using R packages. Patients were grouped according to weighted histoscore, those who has scored more than 90 were classified as having high expression and those with a lower or equal to 90 were classified as having low cytoplasmic S100A2 (Figure S4). The number of each group was obtained after the threshold has been applied. 442 patients classified as having high cytoplasmic S100A2 expression described as “high (n = 442)” and 177 patients were classified as having low cytoplasmic S100A2 expression described as “low (n = 177)”.
Cytoplasmic S100A2 staining; Weak (A), Medium (B), and Strong (C) expression in CRC TMAs.
S100A2 protein expression is associated with patient survival and clinicopathological factors
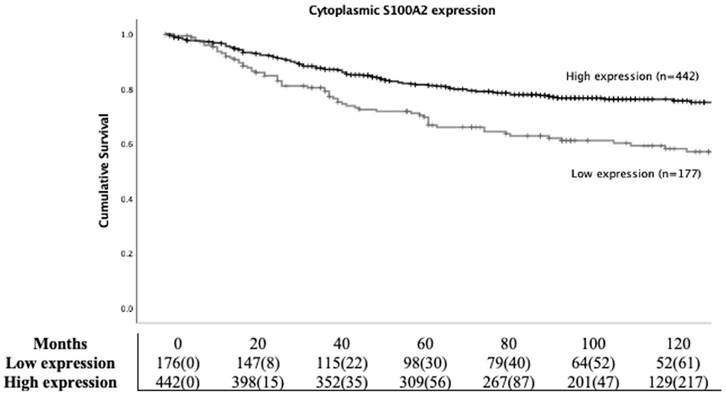
To study the prognostic role of S100A2 in CRC, Kaplan Meier (KM) survival analysis was employed. Patients with high cytoplasmic S100A2 had significantly higher CSS compared to those groups with low cytoplasmic S100A2 (HR 0.539, 95%CI 0.394-0.737, P < 0.001) (Figure 2). Life tables demonstrated that 63% (112/177) patients with low S100A2 versus 78% (345/442) of patients with high S100A2 were alive at 5 years after initial diagnosis. S100A2 was then entered into Cox regression analysis. In univariate analysis, cytoplasmic S100A2 was associated with CSS, however, in multivariate analysis, it was not independent of the known clinical pathological parameters (Table S3).
Kaplan-Meier survival analysis based on cytoplasmic S100A2 expression for cancer specific survival (CSS) in CRC patients.
The correlation between cytoplasmic S100A2 and the clinical characteristics of CRC patients is shown in Table 1. Chi-square test showed a significant association between low cytoplasmic expression of S100A2 and adverse clinical factors such as TNM (TNMIII, P < 0.001), T (T4, P = 0.009) and N (N1, P= 0.003) stages, local and distant recurrence (positive, P = 0.027 and P=0.034 respectively), peritoneal involvement (positive, P = 0.013), perineural invasion (positive, P < 0.001), Ki67 (low expression, P < 0.001), modified Glasgow prognostic score (mGPS) (mGPS1, P = 0.002).
The relationship between cytoplasmic S100A2 status and clinical characteristic in CRC patients
| Low expression of S100A2 N=177 (%) | High expression of S100A2 N=442 (%) | P value | |
|---|---|---|---|
| Host characteristics | |||
| Sex | 0.197 | ||
| Female | 72 (41) | 205 (47) | |
| Male | 105 (59) | 237 (53) | |
| Age | 0.557 | ||
| <65 | 50 (28) | 144 (33) | |
| 65-74 | 61 (35) | 139 (31) | |
| >75 | 66 (37) | 159 (36) | |
| Tumour characteristic | |||
| MMR status | 0.063 | ||
| dMMR | 40 (23) | 67 (15) | |
| pMMR | 105 (60) | 300 (69) | |
| Tumour site | 0.709 | ||
| Right | 70 (40) | 182 (41) | |
| Left | 107 (60) | 260 (59) | |
| Local recurrence* | 0.027 | ||
| No | 140 (86) | 387 (92) | |
| Yes | 22 (14) | 32 (8) | |
| Distant recurrence* | 0.034 | ||
| No | 119 (74) | 342 (81) | |
| Yes | 43 (43) | 78 (19) | |
| TNM stage | <0.001 | ||
| I | 11 (7) | 72 (16) | |
| II | 79 (45) | 217 (49) | |
| III | 87 (49) | 153 (35) | |
| T stage | 0.009 | ||
| 1 | 5 (3) | 22 (5) | |
| 2 | 12 (7) | 59 (13) | |
| 3 | 101 (57) | 260 (59) | |
| 4 | 59 (33) | 101 (23) | |
| N stage | 0.003 | ||
| 0 | 90 (51) | 289 (65) | |
| 1 | 62 (35) | 112 (25) | |
| 2 | 25 (14) | 41 (9) | |
| Margin involvement | 0.159 | ||
| No | 163 (92) | 420 (95) | |
| Yes | 14 (8) | 22 (5) | |
| Peritoneal involvement | 0.013 | ||
| No | 125 (71) | 353 (80) | |
| Yes | 52 (29) | 89 (20) | |
| Perineural invasion* | <0.001 | ||
| No | 44 (61) | 193 (85) | |
| Yes | 28 (39) | 35 (15) | |
| Tumour perforation | 0.718 | ||
| No | 173 (98) | 434 (98) | |
| Yes | 4 (2) | 8 (2) | |
| Venous invasion | 0.394 | ||
| No | 92 (52) | 213 (48) | |
| Yes | 85 (48) | 229 (52) | |
| TBa | 0.619 | ||
| Low | 125 (72) | 297 (70) | |
| High | 48 (28) | 126 (30) | |
| KI67a | <0.001 | ||
| Low | 71 (51) | 104 (27) | |
| High | 69 (49) | 285 (73) | |
| Tumour microenvironment | |||
| TSP* | 0.080 | ||
| Low | 129 (74) | 340 (80) | |
| High | 46 (26) | 84 (20) | |
| KM* | 0.357 | ||
| Low | 149 (86) | 350 (83) | |
| High | 25 (14) | 74 (17) | |
| GMS* | 0.129 | ||
| 0 | 25 (14) | 74 (17) | |
| 1 | 106 (61) | 275 (65) | |
| 2 | 43 (25) | 75 (18) | |
| mGPS | 0.002 | ||
| 0 | 101 (57) | 292 (66) | |
| 1 | 54 (31) | 79 (18) | |
| 2 | 22 (12) | 71 (16) |
dMMR = deficient mismatch repair, pMMR = proficient mismatch repair, TB =Tumour budding, TSP = Tumour stroma percentage, KM = Klintrup-Mäkinen, GMS = Glasgow Microenvironment Score, mGPS = modified Glasgow prognostic score
* some data missing from clinical record
a some data not available
Gene expression from TempOSeq data
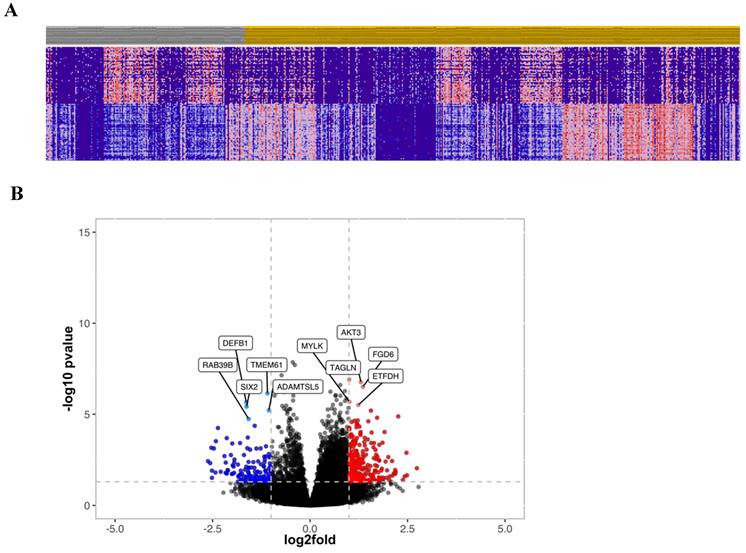
To further investigate the prognostic relevance of CRC patients with high and low cytoplasmic S100A2, transcriptomic data obtained from FFPE colorectal tissue in the same cohort was utilised. RNA expression was determined using TempO-Seq technology and tumours classified as either low (n = 175) or high (n = 435) for the S100A2 protein expression were compared using R packages for clustering analysis. The results showed no obvious classification between two groups as illustrated by PCA plot (Figure S5). Hierarchical clustering analysis was used to generate a heatmap for the top 50 differentially expressed genes comparing tumour cases with low S100A2 to those with high S100A2 protein expression (Figure 3A). Volcano plot, analysed from DESeq2, demonstrated genes that were significantly differentially expressed in cases with low S100A2 compared to cases with high S100A2. Regarding the outcome of patients with low cytoplasmic S100A2 as showed in the above results (Figure 1), genes significantly overexpressed in low cytoplasmic S100A2 groups such as AKT3, TAGLN, MYLK, FGD6 and ETFDH have been observed (Figure 3B).
(A) Hierarchical clustering of the top 50 most differentially expressed genes between low (Grey) and high (Amber) S100A2 protein expression. (B) Volcano plot showing the distribution of gene expression fold changes and p values between patients with high and low S100A2; Red means up-regulated in cases with low S100A2 and blue means up-regulated in cases with high S100A2.
GSEA immune profile compared between tumour with low and high S100A2 expression
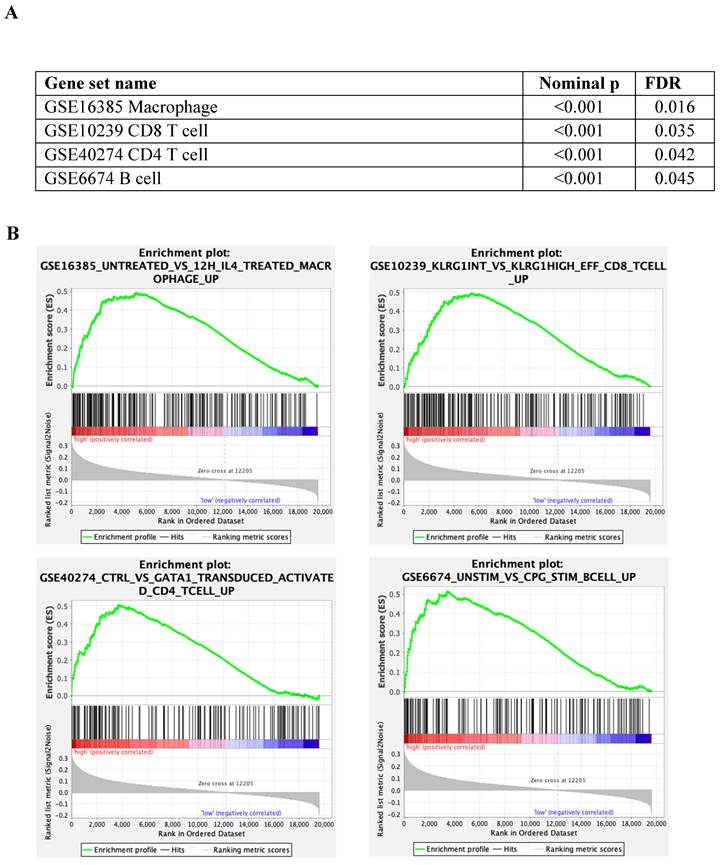
The immunes signature gene set database was utilised to identify the different immunogenic patterns between tumours with low and high cytoplasmic S100A2 (Figure 4A). According to the analysis, up-regulated genes related to macrophages (nominal p < 0.001, FDR = 0.016) , CD8 T cells (nominal p < 0.001, FDR = 0.035), CD4 T cells (nominal p < 0.001, FDR = 0.042) and B cells (nominal p < 0.001, FDR = 0.045), and was enriched in tumour with high cytoplasmic when compared to low cytoplasmic S100A2 (Figure 4B).
(A) Enrichment analysis by tumour with low and high cytoplasmic S100A2 in CRC from GSEA software (B) Enrichment plots using gene set immune signature (c7.all.v2022.1.Hs.symbols.gmt database).
Relationship between S100A2 and immune cells protein expression
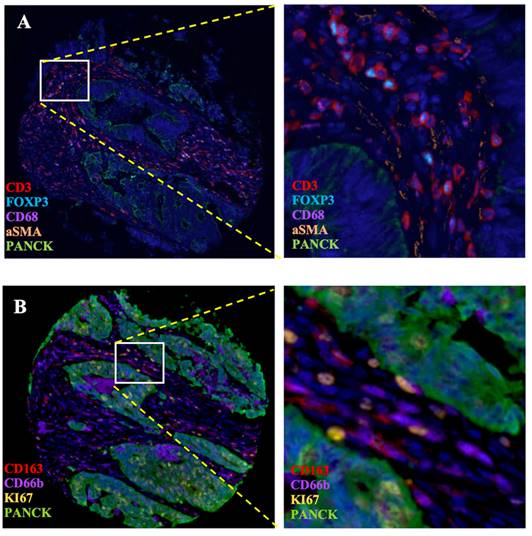
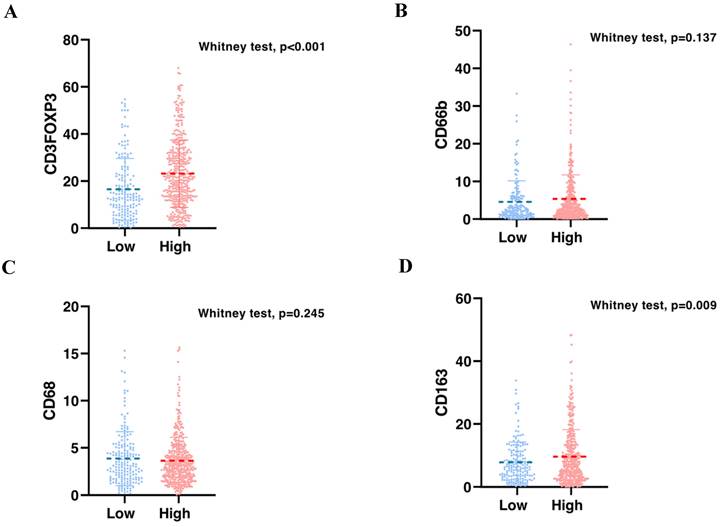
To validate the correlation between S100A2 and immune cells shown at the mRNA level. Using the CRC TMA (n = 787) to stain for multiplex immunohistochemistry, the panel of immune cells; T lymphocyte (CD3, FOXP3), macrophages (CD68, CD163) and granulocyte (CD66b) were stained together with αSMA and PanCK for tissue segmentation (Figure 5). The results were analysed using image analysis to obtain the normalised count per core. Cut point, using R packages, was use to define high and low infiltrated phenotypes (Figure S6). The results demonstrated that tumours with high cytoplasmic S100A2 were enriched for infiltration of CD3+FOXP3+ cells (positive, P < 0.001) and CD163+ cells (positive, P = 0.009). There was no significant correlation found when S100A2 expression was assessed for association with CD68+ and CD66b+ cells (Figure 6A-D).
Multiplex staining of immune markers in CRC TMAs. (A) Panel of CD3, FOXP3, CD68, aSMA and PanCK and (B) Panel of CD163, CD66b, KI67 and PanCK. Magnification 4.87X. Magnification for zoom-in image 20X. Images generate on Visiopharm.
Bar charts showing the percentage of (A) CD3FOXP3 and (B) CD66b and (C) CD68 and (D) CD163 relative to S100A2 status in CRC.
Discussion
The prognostic role of S100A2 in CRC remains unclear. To understand the role of S100A2 in our CRC cohort, protein expression performed by IHC staining of S100A2 in TMAs of tumour core was observed. According to our findings, patients with high cytoplasmic S100A2 expression experienced a significant increase in survival when compared to patients with low cytoplasmic S100A2 expression, therefore low expression was associated with poor prognosis. In line with this observation, low protein expression of S100A2 was associated with adverse clinicopathological factors. Similar results were reported in gastric cancer, loss S100A2 expression was significantly associated with poor prognosis and shown to be an independent predictor using multivariate analysis [10]. Recently, the study showed that mRNA expression of S100A2 is higher in CRC than those in normal colon tissue, and that level of S100A2 was associated with poor disease-free survival (DFS) of patients with CRC [28]. In contrast with our finding, Masuda et al. reported that high S100A2 expression is associated with poor prognosis in CRC (n = 161) [12]. Having said that, that was a much smaller cohort, with only CRC stage II and III, than used in this current investigation and a different antibody was used for IHC staining. According to Han et al, nuclear S100A2 expression has shown a poor outcome when compared to cytoplasmic expression in the CRC cohort (n = 278) and that expression of S100A2 at the invasive front is higher compared to the tumour core in CRC tissue [29]. In the current study, we can only observe S100A2 cytoplasmic expression from the TMAs tumour core of CRC patients, therefore a nuclear expression of S100A2 should also be investigated in both tumour core and invasive front to understand the role of S100A2 regarding its localisation in tumour cells. In addition, our results showed that S100A2 has a positive correlation with KI67, a proliferation marker, which concordance with a previous study in CRC cells that overexpression of S100A2 can promote proliferation via glycolysis through GLUT1 expression [30].
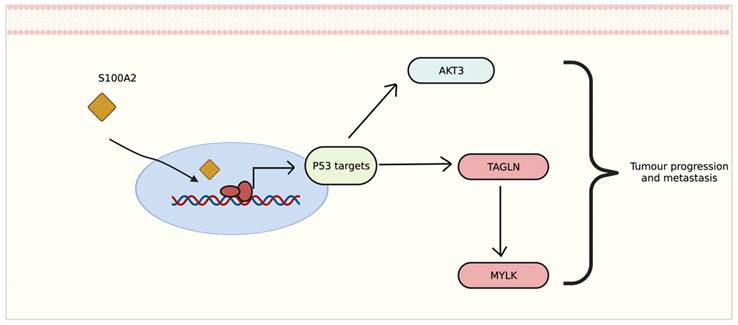
The transcriptomic data showed that genes differentially expressed in tumour with low cytoplasmic S100A2 groups may correlate with disease development and progression. Interestingly, the correlation of up-regulated genes seem to be involved with p53 activation. The relationship between S100A2 and p53 also revealed a possible impact on cancer cell proliferation such as oral cancer [31], head and neck squamous carcinoma [32] and breast cancer [33]. The upregulation of AKT3, one of the downstream signaliing of AKT pathway, has been shown to promote p53 regulation [34]. This could perharps modulate AKT3 then further stimulate the signalling for tumour to progress (Figure 7). Morevoer, TAGLN has also been reported as a p53-upregulated gene in bladder cancer [35]. The role of TAGLN in CRC is vaguely describe, though one study showed that it could bind to PARP1 which involved in Rho signalling, therefore, inducing metastasis of colon cancer cells [36]. Eventhough there is no correlation with S100A2, upregulation of FGD6 have been reported as an independent factor to predict survival in patients with gastric cancer [37].
Proposed mechanism of S100A2 for regulating P53 to induce tumour-related signalling, created with BioRender.
The role of S100A2 and inflammatory cells during cancer development is rarely reported [20, 38]. Studies in pancreatic cancer have demonstrated that S100A2 could be used as a prognostic marker to identify patients who are more responsive to immunotherapy [16]. According to our findings, the correlation between S100A2 expression and mGPS, a systemic inflammation-based score in our CRC cohort, can confirm that S100A2 may be involved in the inflammatory response and could be used as a potential biomarker to predict the efficiency of treatment in CRC patients [39]. mRNA expression from GSEA also showed a upregulation of genes correlated with T cells, B cells and macrophages, in a group of patients with high cytoplasmic S100A2 suggesting a possible role of S100A2 in the immune response in CRC. To further validate the mRNA expression, multiplex staining with T lymphocyte (CD3, FOXP3), macrophages (CD68, CD163) and granulocyte (CD66b) markers was performed using TMAs of the same CRC cohort. In line with the mRNA expression, high tumoural cytoplasmic S100A2 expression was significantly associated with an increase number of CD3+FOXP3+ cells as higher influx of T lymphocytes indicates a favourable prognosis in CRC and that high cytoplasmic S100A2 showed a better outcome in our cohort, however there is conflicting evidence regarding the influence of the regulatory subset of T cells in CRC [40-42]. The role of macrophages has been extensively published in CRC. The increased infiltration of M2-polarised macrophages together with the M1-polarised phenotype showed a better prognosis in patients with CRC [43]. In parallel, we found a positive relationship with CD163 M2-like macrophages suggesting the contribution of immune activation when tumours have higher S100A2 expression. Additionally, the study using integrative-omics analysis revealed that high S100A2 expression was frequently observed when KRAS was mutated, which has been known to induce a series of inflammatory cells [44], compared to BRAF mutated CRC cells line [45]. Therefore, future studies should be conducted to investigate both the genetic profile and the immunomodulatory functions of S100A2, especially in CRC patients.
Conclusion
Low cytoplasmic S100A2 may have prognostic value in a patient's survival and is significantly associated with tumour-relating signaling and infiltrating immune cells. The role of S100A2 in CRC remains unclear and the underlying mechanisms of how it could be involved in disease development merit further study. Significant genes from transcriptomic data, associated with tumour with low cytoplasmic S100A2, could exhibit the prognostic role in CRC and the relationship between S100A2 and immune infiltration in CRC could inform future CRC treatment which warrants further study.
Abbreviations
S100A2: S100 calcium-binding protein A2; CRC: colorectal cancer; IHC: immunohistochemistry; TMAs: tissue microarrays; TNF-α: Tumour necrosis factor alpha; mIF: multiplex immunofluorescence; PVDF: polyvinylidene fluoride; TBST: Tris-buffered saline with Tween; FFPE: formalin-fixed paraffin-embedded; TempO-Seq: Templated Oligo-Sequencing; MSigDB: molecular signature database; GSEA: Gene set enrichment analysis; HR: Hazard ratio; CSS: Cancer-specific survival; FDR: false discovery rate; CI: Confidence interval.
Supplementary Material
Supplementary figures and tables.
Acknowledgements
The authors would like to acknowledge the Academic Unit of Surgery Glasgow Royal Infirmary for clinical data acquisition, NHS Greater Glasgow and Clyde biorepository for accessing the tissue, Glasgow Tissue Research Facility for help in preparing the tissue and the Le Quesne group and Dr Tomoko Iwata for the support in multiplex staining for their support.
Funding information
The multiplex staining and imaging were funded by the Mazumdar-Shaw chair fund and UKRI: Enabling integrated diagnostics for early detection: 42497: Integrated Technologies for Improved Polyp Surveillance (INCISE).
The TSP and KM scores were funded by MRC transitional fellowship (MR/R502327/1), a studentship to Kathryn A. F. Pennel.
The TempO-Seq data and analysis was funded by Cancer Research UK Scotland Centre (CTRQQR-2021\100006).
Author contributions
Phimmada Hatthakarnkul: Methodology, Software, Validation, Formal analysis, Investigation, Data Curation, Writing -Original Draft preparation, Visualization.
Amna Ahmed Mohemmed Matly: Methodology, Software, Validation, Formal analysis, Investigation, Data Curation, Writing - Review & Editing, Visualization.
Kathryn A. F. Pennel: Methodology, Data Curation, Writing - Review & Editing.
Leah Officer-Jones: Methodology, Validation, Investigation, Writing - Review & Editing, Visualization.
Silvia Cusumano: Methodology, Validation, Investigation, Writing - Review & Editing.
Jean A Quinn: Methodology, Resources, Writing - Review & Editing, Supervision, Project administration.
Peter G. Alexander: Methodology, Data Curation.
Jennifer Hay: Resources, Writing - Review & Editing.
Ditte Andersen: Methodology, Data Curation, Writing - Review & Editing.
Aula Ammar: Investigation, Writing - Review & Editing, Supervision.
Gerard Lynch: Resources, Writing - Review & Editing.
Hester C. van Wyk: Methodology, Supervision.
Noori Maka: Methodology, Data Curation.
Donald C. McMillan: Data Curation, Writing - Review & Editing, Supervision.
John Le Quesne: Resources, Supervision.
Chanitra Thuwajit: Resources, Writing - Review & Editing, Supervision.
Joanne Edwards: Conceptualization, Resources, Writing - Review & Editing, Supervision, Project administration.
Ethics approval and consent to participate
All patients provided written informed consent. The study was approved by the West of Scotland Research Ethics Committee (REC 4 : 22/ws/0207) and data is stored in Greater Glasgow and Clyde Safehaven (GSH21ON012).
Data availability
The datasets that formed the basis of this article are contained in the University of Glasgow's MVLS institute and are continually being updated with ongoing research. They contain patients sensitive information and therefore cannot be made available on a public repository.
Competing Interests
The authors have declared that no competing interest exists.
References
1. Diseases GBD, Injuries C. Global burden of 369 diseases and injuries in 204 countries and territories, 1990-2019: a systematic analysis for the Global Burden of Disease Study 2019. Lancet. 2020;396:1204-22
2. Daaboul HE, El-Sibai M. Treatment Strategies in Colorectal Cancer. Colorectal Cancer - Diagnosis, Screening and Management. 2018 Chapter3: 33-56
3. Schreuders EH, Ruco A, Rabeneck L, Schoen RE, Sung JJ, Young GP. et al. Colorectal cancer screening: a global overview of existing programmes. Gut. 2015;64:1637-49
4. Vadgama JV, Deng W, Schrode KM, Shaheen M, Vadgama JV, Wu Y. Survival Analysis and Prognostic Predictor Study of Colorectal Cancer Patients with Single-Site Metastasis. Clinical Oncology and Research. 2021:1-18
5. Bromham N, Kallioinen M, Hoskin P, Davies RJ, Guideline C. Colorectal cancer: summary of NICE guidance. BMJ. 2020;368:m461
6. Chen H, Xu C, Jin Q, Liu Z. S100 protein family in human cancer. Am J Cancer Res. 2014;4(2):89-115
7. Bresnick AR, Weber DJ, Zimmer DB. S100 proteins in cancer. Nat Rev Cancer. 2015;15:96-109
8. Weisz J, Uversky VN. Zooming into the Dark Side of Human Annexin-S100 Complexes: Dynamic Alliance of Flexible Partners. Int J Mol Sci. 2020;21(16):5879
9. Wolf S, Haase-Kohn C, Pietzsch J. S100A2 in cancerogenesis: a friend or a foe? Amino Acids. 2011;41:849-61
10. Zhao Y, Zhang TB, Wang Q. Clinical significance of altered S100A2 expression in gastric cancer. Oncol Rep. 2013;29:1556-62
11. Xu HY, Song HM, Zhou Q. Comprehensive analysis of the expression and prognosis for S100 in human ovarian cancer: A STROBE study. Medicine (Baltimore). 2020;99:e22777
12. Masuda T, Ishikawa T, Mogushi K, Okazaki S, Ishiguro M, Iida S. et al. Overexpression of the S100A2 protein as a prognostic marker for patients with stage II and III colorectal cancer. Int J Oncol. 2016;48:975-82
13. Zhang X, Hunt JL, Shin DM, Chen ZG. Down-regulation of S100A2 in lymph node metastases of head and neck cancer. Head Neck. 2007;29:236-43
14. Kumar M, Srivastava G, Kaur J, Assi J, Alyass A, Leong I. et al. Prognostic significance of cytoplasmic S100A2 overexpression in oral cancer patients. J Transl Med. 2015;13:8
15. Biankin AV, Kench JG, Colvin EK, Segara D, Scarlett CJ, Nguyen NQ. et al. Expression of S100A2 calcium-binding protein predicts response to pancreatectomy for pancreatic cancer. Gastroenterology. 2009;137:558-68 68 e1-11
16. Chen Y, Wang C, Song J, Xu R, Ruze R, Zhao Y. S100A2 Is a Prognostic Biomarker Involved in Immune Infiltration and Predict Immunotherapy Response in Pancreatic Cancer. Front Immunol. 2021;12:758004
17. Yoshioka M, Sawada Y, Saito-Sasaki N, Yoshioka H, Hama K, Omoto D. et al. High S100A2 expression in keratinocytes in patients with drug eruption. Sci Rep. 2021;11:5493
18. Guo L, Wang C, Qiu X, Pu X, Chang P. Colorectal Cancer Immune Infiltrates: Significance in Patient Prognosis and Immunotherapeutic Efficacy. Front Immunol. 2020;11:1052
19. Al-Hujaily EM, Al-Sowayan BS, Alyousef Z, Uddin S, Alammari F. Recruiting Immunity for the Fight against Colorectal Cancer: Current Status and Challenges. Int J Mol Sci. 2022;23(22):13696
20. Gonzalez LL, Garrie K, Turner MD. Role of S100 proteins in health and disease. Biochim Biophys Acta Mol Cell Res. 2020;1867:118677
21. Vogl T, Tenbrock K, Ludwig S, Leukert N, Ehrhardt C, van Zoelen MA. et al. Mrp8 and Mrp14 are endogenous activators of Toll-like receptor 4, promoting lethal, endotoxin-induced shock. Nat Med. 2007;13:1042-9
22. Sade-Feldman M, Kanterman J, Ish-Shalom E, Elnekave M, Horwitz E, Baniyash M. Tumor necrosis factor-alpha blocks differentiation and enhances suppressive activity of immature myeloid cells during chronic inflammation. Immunity. 2013;38:541-54
23. Lin D, Zhao W, Yang J, Wang H, Zhang H. Integrative Analysis of Biomarkers and Mechanisms in Adamantinomatous Craniopharyngioma. Front Genet. 2022;13:830793
24. Yeakley JM, Shepard PJ, Goyena DE, VanSteenhouse HC, McComb JD, Seligmann BE. A trichostatin A expression signature identified by TempO-Seq targeted whole transcriptome profiling. PloS one. 2017;12:e0178302
25. Dobin A, Davis CA, Schlesinger F, Drenkow J, Zaleski C, Jha S. et al. STAR: ultrafast universal RNA-seq aligner. Bioinformatics. 2013;29:15-21
26. Subramanian A, Tamayo P, Mootha VK, Mukherjee S, Ebert BL, Gillette MA. et al. Gene set enrichment analysis: a knowledge-based approach for interpreting genome-wide expression profiles. Proc Natl Acad Sci U S A. 2005;102:15545-50
27. Liberzon A, Birger C, Thorvaldsdottir H, Ghandi M, Mesirov JP, Tamayo P. The Molecular Signatures Database (MSigDB) hallmark gene set collection. Cell Syst. 2015;1:417-25
28. Zeng ML, Zhu XJ, Liu J, Shi PC, Kang YL, Lin Z. et al. An Integrated Bioinformatic Analysis of the S100 Gene Family for the Prognosis of Colorectal Cancer. Biomed Res Int. 2020;2020:4746929
29. Han F, Zhang L, Liao S, Zhang Y, Qian L, Hou F. et al. The interaction between S100A2 and KPNA2 mediates NFYA nuclear import and is a novel therapeutic target for colorectal cancer metastasis. Oncogene. 2022;41:657-70
30. Li C, Chen Q, Zhou Y, Niu Y, Wang X, Li X. et al. S100A2 promotes glycolysis and proliferation via GLUT1 regulation in colorectal cancer. FASEB J. 2020;34:13333-44
31. Pan SC, Li CY, Kuo CY, Kuo YZ, Fang WY, Huang YH. et al. The p53-S100A2 Positive Feedback Loop Negatively Regulates Epithelialization in Cutaneous Wound Healing. Sci Rep. 2018;8:5458
32. Mueller A, Schafer BW, Ferrari S, Weibel M, Makek M, Hochli M. et al. The calcium-binding protein S100A2 interacts with p53 and modulates its transcriptional activity. J Biol Chem. 2005;280:29186-93
33. Buckley NE, D'Costa Z, Kaminska M, Mullan PB. S100A2 is a BRCA1/p63 coregulated tumour suppressor gene with roles in the regulation of mutant p53 stability. Cell Death Dis. 2014;5:e1070
34. Abraham AG, O'Neill E. PI3K/Akt-mediated regulation of p53 in cancer. Biochem Soc Trans. 2014;42:798-803
35. Tsui KH, Lin YH, Chang KS, Hou CP, Chen PJ, Feng TH. et al. Transgelin, a p53 and PTEN-Upregulated Gene, Inhibits the Cell Proliferation and Invasion of Human Bladder Carcinoma Cells in vitro and in vivo. Int J Mol Sci. 2019;20(19):4946
36. Lew ZX, Zhou HM, Fang YY, Ye Z, Zhong W, Yang XY. et al. Transgelin interacts with PARP1 in human colon cancer cells. Cancer Cell Int. 2020;20:366
37. Zeng J, Li M, Shi H, Guo J. Upregulation of FGD6 Predicts Poor Prognosis in Gastric Cancer. Front Med (Lausanne). 2021;8:672595
38. Xia C, Braunstein Z, Toomey AC, Zhong J, Rao X. S100 Proteins As an Important Regulator of Macrophage Inflammation. Front Immunol. 2017;8:1908
39. Nozoe T, Matono R, Ijichi H, Ohga T, Ezaki T. Glasgow Prognostic Score (GPS) can be a useful indicator to determine prognosis of patients with colorectal carcinoma. Int Surg. 2014;99:512-7
40. Salama P, Phillips M, Grieu F, Morris M, Zeps N, Joseph D. et al. Tumor-infiltrating FOXP3+ T regulatory cells show strong prognostic significance in colorectal cancer. J Clin Oncol. 2009;27:186-92
41. Kuwahara T, Hazama S, Suzuki N, Yoshida S, Tomochika S, Nakagami Y. et al. Intratumoural-infiltrating CD4 + and FOXP3 + T cells as strong positive predictive markers for the prognosis of resectable colorectal cancer. Br J Cancer. 2019;121:659-65
42. Cavalleri T, Bianchi P, Basso G, Celesti G, Grizzi F, Bossi P. et al. Combined Low Densities of FoxP3(+) and CD3(+) Tumor-Infiltrating Lymphocytes Identify Stage II Colorectal Cancer at High Risk of Progression. Cancer Immunol Res. 2019;7:751-8
43. Edin S, Wikberg ML, Dahlin AM, Rutegard J, Oberg A, Oldenborg PA. et al. The distribution of macrophages with a M1 or M2 phenotype in relation to prognosis and the molecular characteristics of colorectal cancer. PLoS One. 2012;7:e47045
44. Dias Carvalho P, Guimaraes CF, Cardoso AP, Mendonca S, Costa AM, Oliveira MJ. et al. KRAS Oncogenic Signaling Extends beyond Cancer Cells to Orchestrate the Microenvironment. Cancer Res. 2018;78:7-14
45. Kundu S, Ali MA, Handin N, Conway LP, Rendo V, Artursson P. et al. Common and mutation specific phenotypes of KRAS and BRAF mutations in colorectal cancer cells revealed by integrative -omics analysis. J Exp Clin Cancer Res. 2021;40:225
Author contact
![]() Corresponding author: Phimmada Hatthakarnkul, School of Cancer Sciences, University of Glasgow, Wolfson Wohl Cancer Research Centre, Glasgow, United Kingdom. 2373916hgla.ac.uk. ORCID: 0000-0002-5274-5480.
Corresponding author: Phimmada Hatthakarnkul, School of Cancer Sciences, University of Glasgow, Wolfson Wohl Cancer Research Centre, Glasgow, United Kingdom. 2373916hgla.ac.uk. ORCID: 0000-0002-5274-5480.