Impact Factor ISSN: 1837-9664

 Global reach, higher impact
J Cancer 2022; 13(8):2683-2693. doi:10.7150/jca.72893 This issue Cite
Research Paper
Construction of a novel radiosensitivity- and ferroptosis-associated gene signature for prognosis prediction in gliomas
Yandong Xie1,#, Yong Xiao1,#, Yuyang Liu1, Xueying Lu2, Zhen Wang1, Shuo Sun1, Liang Liu1, Xianglong Tang1, Hong Xiao3, ![]() , Hongyi Liu1,
, Hongyi Liu1, ![]()
1. Department of Neurosurgery, The Affiliated Brain Hospital of Nanjing Medical University, Fourth Clinical College of Nanjing Medical University, Nanjing 210029, China.
2. Department of Hematology, The First Affiliated Hospital of Nanjing Medical University, Jiangsu Province Hospital, Nanjing 210029, China.
3. Department of Neuro-Psychiatric Institute, The Affiliated Brain Hospital of Nanjing Medical University, Nanjing 210029, China.
#Yandong Xie and Yong Xiao contributed equally to the work.
Received 2022-3-15; Accepted 2022-5-7; Published 2022-5-20
Abstract

Background: Gliomas are the most refractory intracranial disease characterized by high incidence and mortality rates. Therefore, radiotherapy plays a crucial role in the treatment of gliomas. However, recent evidence reveals that ferroptosis is highly associated with radiosensitivity in tumor cells. Therefore, this study aimed to investigate radiosensitivity- and ferroptosis-associated biomarkers. Moreover, the study aimed to provide new strategies for the treatment and evaluation of prognosis in gliomas.
Methods: The mRNA sequencing and relevant clinical data were obtained from The Cancer Genome Atlas (TCGA). Secondly, differential analysis was conducted to reveal the radiosensitivity- and ferroptosis-associated differentially expressed genes (DEGs). Further, a predictive model based on the seven genes was constructed, and LASSO regression analysis was carried out. After that, the Chinese Glioma Genome Atlas (CGGA) was used for validation of the results.
Results: A total of 36 radiosensitivity- and 19 ferroptosis-associated DEGs with a prognostic value were identified. Moreover, seven intersecting genes (HSPB1, STAT3, CA9, MAP1LC3A, MAPK1, ZEB1, and TNFAIP3) were identified as the risk signature genes. The ROC curves and K-M analysis revealed that the signature genes showed a good survival prediction. Furthermore, the functional analysis revealed that the differentially expressed genes between the high-risk and the low-risk groups were enriched in glioma-related biological processes. In addition, differences were reported in immune function status between the two groups.
Conclusion: This study revealed that the seven biomarkers could help predict the prognosis in glioma patients. In addition, this study provides a basis for understanding the molecular mechanisms of radiosensitivity and ferroptosis in the treatment of gliomas.
Keywords: Gliomas, prognosis, biomarker, radiosensitivity, ferroptosis
Introduction
Gliomas are tumors originating from glial cells and are the most common malignant tumors of the central nervous system. Glioma patients have a median survival of fewer than 15 months, with a five-year survival rate of less than 5.5% [1]. The incidence rate of gliomas has been on the increase. Due to the complexity and high heterogeneity of gliomas, some targeted therapies have limited effectiveness [2]. Currently, there are no effective diagnostic and therapeutic options available [3]. Therefore, there is an urgent need to develop effective methods for diagnosing and treating gliomas. Glioma-specific biomarkers would offer great therapeutic and prognostic significance. In addition, novel effective molecular markers would help improve the survival time and the quality of life. This study explored the prognostic role of seven biomarkers related to radiosensitivity and ferroptosis.
Radiation therapy (RT) plays a significant role in treating malignant glioblastoma (GBM) [4]. Several treatment modalities are used in combination with radiotherapy to improve the survival rate. However, the effects are not satisfactory. In 2005, the landmark EORTC/NCIC trial reported that a combination of temozolomide (TMZ) with radiotherapy could effectively treat gliomas [5]. So far, this combination is considered the most effective treatment for gliomas. However, the combination does not have a complete curative effect. Therefore, research is needed to investigate the response to radiotherapy between normal brain tissues and glioma tissues. David et al. reported that glioma cells with wild-type p53 gene were more sensitive to radiation [6]. In addition, the inhibition of EGFR gene expression in glioma cells would result in enhanced killing by radiation [7]. Therefore, it is essential to identify the radiosensitivity-related biomarkers to guide the evaluation of prognosis in glioma patients.
Recent studies reveal that radiosensitivity is associated with ferroptosis. Gan et al. reported that radiation resulted in the production of large amounts of ROS, up-regulated the expression of ACSL4, (a key ferroptosis enzyme), and increased lipid peroxidation. Further, knockout of the ACSL4 gene in tumor cells was associated with radiation resistance [8]. Zhou et al. reported that radiotherapy could promote lipid oxidation and ferroptosis in tumors by inhibiting SLC7A11 [9]. Stockwell et al. reported that ferroptosis could promote radiation-induced cancer cell death. Ferroptosis activators were shown to increase the sensitivity of tumor cells to radiation [10]. Radiotherapy is often combined with chemotherapy or immunotherapy. Recent evidence reveals that ferroptosis is also associated with the efficacy of chemotherapy or immunotherapies [11]. Further, ferroptosis activators play essential roles in radiosensitivity and immunotherapy. Targeting ferroptosis could help overcome radiation resistance in glioma cells [12]. Therefore, this study explored the clinical relevance and prognostic significance of radiosensitivity and ferroptosis-associated biomarkers in improving the therapeutic effect in gliomas.
In this study, the mRNA sequencing data obtained from the TCGA database was analyzed to determine the prognostic role and expression profile of the differentially expressed genes associated with radiosensitivity and ferroptosis. Further, the intersecting genes were analyzed to construct a prognostic model. Secondly, the results were validated in the Chinese Glioma Genome Atlas (CGGA) cohort. Finally, functional enrichment analysis of the related genes was conducted. This study aims to provide a prognostic model for gliomas.
Materials and methods
A flowchart of this study is shown in Supplementary Figure 1.
Acquisition of data and the datasets
The RNA sequencing data obtained from the TCGA database, including 169 tumor tissues and five normal tissues, was used as the training cohort (http://cancergenome.nih.gov/) [13]. Patients without survival time were excluded and the samples considered in this study were shown in Supplementary Table 1. Further, the RNA sequencing data (mRNAseq_693) and relevant clinical data obtained from the CGGA database was used as the validation cohort (http://www.cgga.org.cn/)[14]. Moreover, 395 radiosensitivity associated genes were downloaded from the dbCRSR (http://bioinfo.ahu.edu.cn:8080/dbCRSR/) [15] (Supplementary Table 2). Finally, 259 ferroptosis-associated genes were obtained from the FerrDb data set (http://www.zhounan.org/ferrdb/) [16] (Supplementary Table 3).
Identification of the differentially expressed genes
Normal brain tissues and glioma tissues were analyzed using the limma package in R software (version 3.6.3). A false discovery rate (FDR) < 0.05 was set for screening DEGs. Univariate cox analysis was used to determine the overall survival (OS). Thirty-six radiosensitive and nineteen ferroptosis-associated DEGs were shown to have a prognostic value. A Veen diagram was then constructed to show the intersection genes. Further, the STRING online platform was used to analyze the interaction between the key genes (https://string-db.org/)[17]. A visual PPI network was constructed using Cytoscape (v3.7.0) [18, 19].
Construction and validation of the prognostic model
The radiosensitive and ferroptosis-associated DEGs were explored to obtain seven intersecting genes. After that, the seven-gene signature was used to construct the prognostic model using the LASSO Cox regression analysis. The patients were divided into low- and high-risk groups based on the median risk score. The overall survival (OS) time between the two groups was compared using Kaplan-Meier analysis. The FactoMineR R package was used to perform PCA of the signatures. The ROC analysis was used to evaluate the predictive accuracy and risk scores of each gene. Further, nomograms were constructed for predicting the 1-, 2- and 3-year overall survival of the prognostic model. Lastly, the CGGA cohort was used to validate the seven gene model.
Independent prognostic analysis
Clinical information of the patients (age, gender, stage, IDH, and MGMT) was extracted from the TCGA and CGGA databases. Univariate and multivariate Cox regression analyses were used to analyze these variables in the regression model.
Functional enrichment analysis
Patients were stratified into low- and high-risk subgroups based on the median risk score. The specific criteria (|log2FC| ≥ 1.5 and FDR < 0.05) were used to filter the DEGs in the two groups. Further, the clusterProfiler R package was used to perform GO and KEGG analyses. Finally, the ssGSEA of the gsva R package was used to determine the infiltrating score of immune cells and estimate the immune-related pathways [20].
Cell culture
U87 and U251 glioma cells were bought from the cell bank of the Chinese Academy of Sciences. The cells were maintained in DMEM (Gibco, USA) supplemented with 10% FBS at 37 ℃ in a humidified incubator with 5% CO2.
CCK-8 assay and Colony formation assay
The cells were seeded onto 96-well plates at a concentration of 5×10³ cells/mL[21]. After incubation for 10 h with 10 uM Erastin (Catalog No. S7242), the cells were exposed to X-rays from 0 to 8 Gy and further cultured for another 24 h. Further, the CCK-8 kit (Beyotime, China) was used to determine cell viability. Absorbance was determined at 450 nm using a Spectrophotometer (Thermo, USA).
The cells were seeded onto six-well plates at a concentration of 1×10³ cells/mL [22]. After incubation for 10 h with 10 uM Erastin, the cells were exposed to two Gy X-rays, and cultured for another ten days. After that, the cells were fixed using paraformaldehyde. Subsequently, the cells were stained using crystal violet.
5-Ethynyl-20-deoxyuridine (EdU) assay
The cells were seeded onto 96-well plates at a concentration of 5×10³ cells/mL [23]. After incubation for 10 h with 10 uM Erastin, the cells were exposed to two Gy X-rays, and cultured for another 24h. The cells were then incubated with EdU (Beyotime, China) for 2 h, and were fixed with 4% paraformaldehyde and stained sequentially with Apollo dye solution (RiboBio) and DAPI (Invitrogen). The images were captured using a fluorescence microscope (Olympus).
Statistical analysis
The GraphPad Prism software (Version 8.0.2, CA, USA) was used to to analyze and graph the data in this study. The results are presented as mean ± SD. Differences between the two groups were analyzed by t-tests. A P value <0.05 indicated that the difference was statistically significant.
Results
Identification of the prognostic radiosensitivity- and ferroptosis-associated DEGs in TCGA
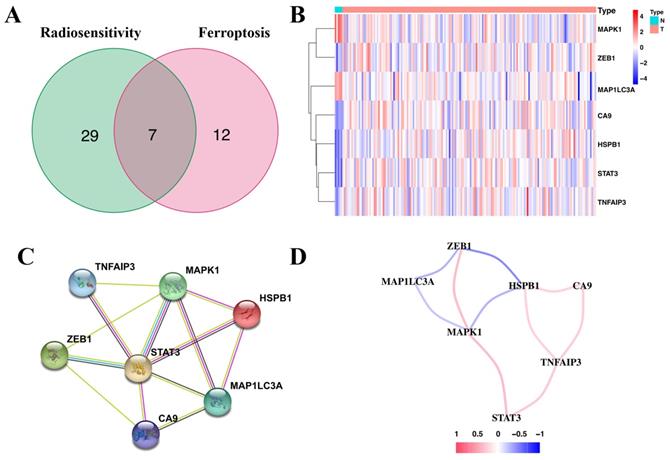
Correlation of the radiosensitivity- and ferroptosis-associated DEGs with OS revealed 36 radiosensitivity- and 19 ferroptosis-associated DEGs with prognostic value (Supplementary Table 4 and Supplementary Table 5). Of these, seven were overlapping genes (Figure 1A). Moreover, ZEB1, CA9, HSPB1, STAT3 and TNFAIP3 of the overlapping genes were upregulated in glioma tissues (Figure 1B). The protein-protein interaction (PPI) network revealed that STAT3 was the hub gene (Figure 1C). The correlation of the overlapping genes is presented in Figure 1D.
Identification of the seven-candidate radiosensitivity- and ferroptosis-associated genes in TCGA. (A) Intersection of the DEGs and the prognostic genes for radiosensitivity and ferroptosis is shown in the veen diagram. (B) Five genes were upregulated, while two genes were downregulated in glioma tissues. (C) Interactions among the seven candidate genes are shown in the PPI network. (D) The red and blue lines represent positive and negative correlations, respectively.
Comparison of the expression profile of the overlapping genes between normal brain tissues and glioma tissues
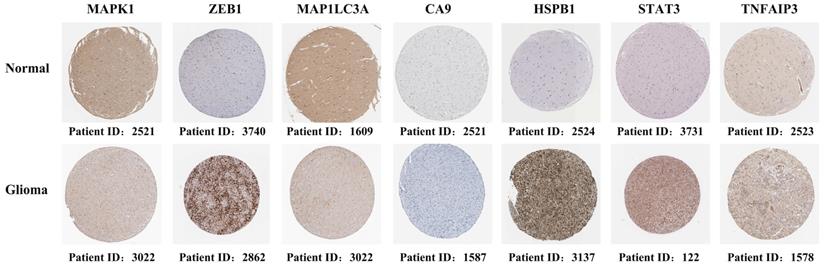
Immunohistochemical staining revealed that five genes (ZEB1, CA9, HSPb1, STAT3, and TNFAIP3) had a higher expression in glioma tissues than in normal tissues. However, MAPK1 and MAP1LC3A had relatively low expression in glioma tissues (Figure 2). These results were consistent with the gene expression patterns in the TCGA database.
Immunohistochemical staining revealing the expression of the seven candidate genes in normal brain tissues and glioma tissues.
Construction of the prognostic model in TCGA
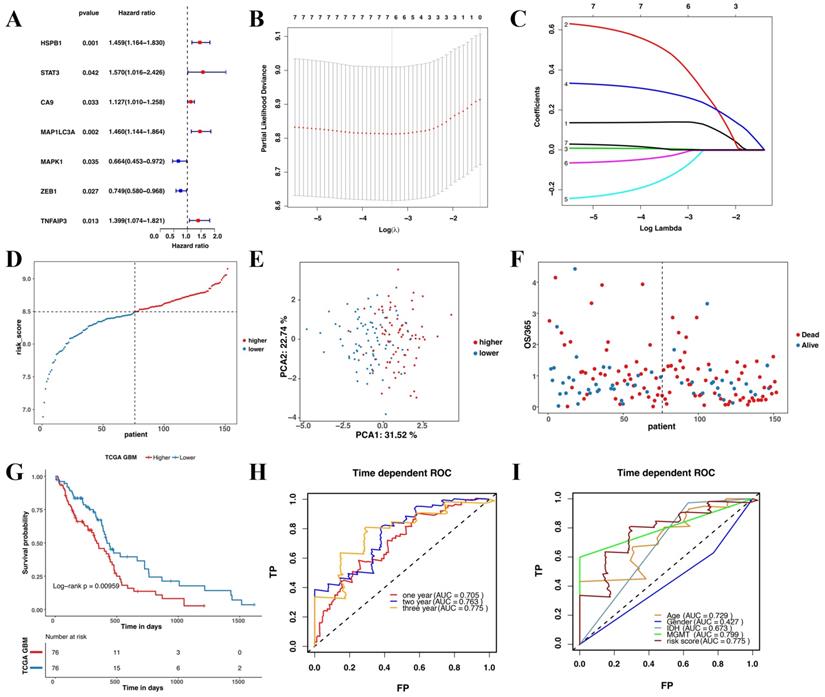
This study revealed seven overlapping genes (MAPK1, ZEB1, MAP1LC3A, HSPB1, CA9, STAT3, and TNFAIP3). Among them, HSPB1, STAT3, CA9, MAP1LC3A, and TNFAIP3 had HRs > 1, suggesting that they were associated with increased risk. The other two genes, MAPK1 and ZEB1 with a HRs < 1 were low-risk genes (Figure 3A). In addition, a molecular signature of the seven genes was constructed using the optimumλvalue to conduct the least absolute shrinkage and selection operator LASSO Cox regression analysis (Figure 3B and C). The risk score was determined as HSPB1*0.139 + STAT3*0.478 + CA9*0.00497 + MAP1LC3A*0.281 + MAPK1*-0.127 + ZEB1*-0.0261 + TNFAIP3*0.000395. Further, the patients were divided into low-risk and high-risk groups based on the median risk score (Figure 3D). Moreover, the patients in the different risk groups were clustered into two groups based on the principal component analysis (Figure 3E). The high-risk group had shorter survival and higher mortality than the low-risk group (Figure 3F). Moreover, overall survival was lower in the high-risk group than in the low-risk group (Figure 3G). Further, ROC analysis was conducted to evaluate the efficiency of the prognostic model. The AUC was 0.705, 0.764, and 0.775 at 1, 2, and 3 years, respectively (Figure 3H). The risk scores for age and MGMT status were 0.729 and 0.799, respectively (Figure 3I).
Construction and evaluation of the prognostic model in TCGA. (A) Univariate cox regression analysis for each candidate gene. (B) Regression coefficients by LASSO of the seven genes. (C) The tuning parameters for cross-validation. (D) Distribution of the risk scores and the median risk score. (E) The PCA plot. (F) The survival status for the different groups. (G) Kaplan-Meier curves showing survival in the different risk groups. (H-I) Area under the receiver operating curves was used to validate the predictive accuracy of the risk signature.
Validation of the prognostic model in CGGA
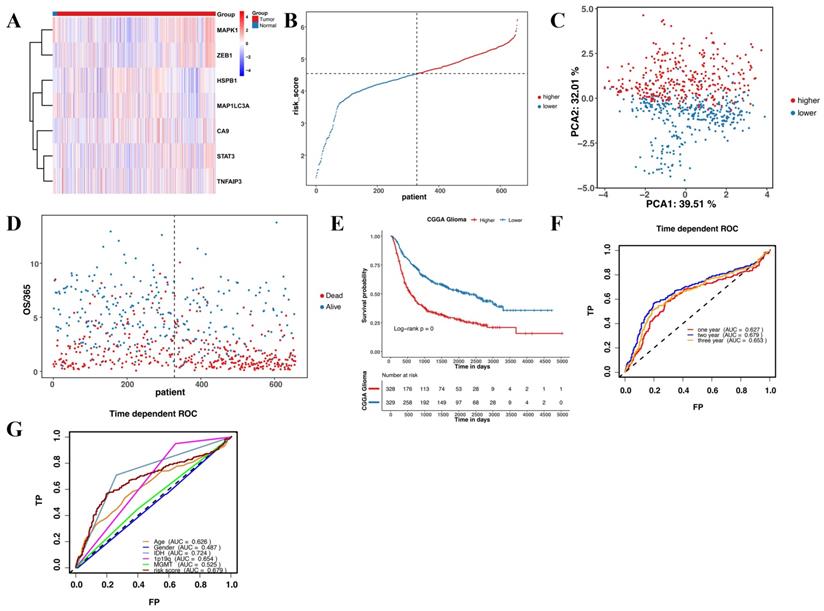
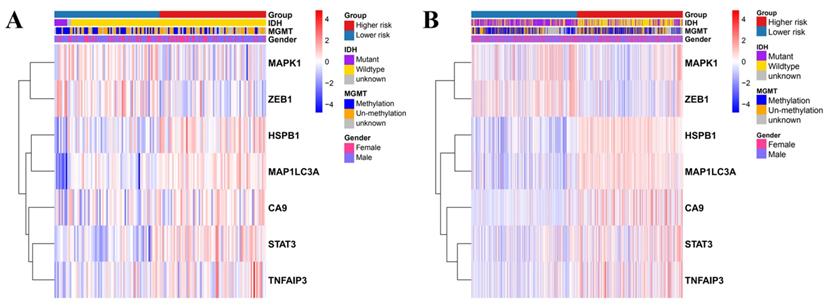
The validation set to verify the reliability of the prognostic model comprised of 693 glioma patients. Firstly, we detected the expression of the seven genes in CGGA. Gene expression in the CGGA was consistent with the TCGA (Figure 4A). Further, the 693 glioma patients were divided into high-risk and low-risk groups based on the median risk score (Figure 4B). Moreover, the PCA and t-SNE analyses of the CGGA dataset were consistent with the TCGA (Figure 4C and D). Patients in the high-risk group had a poorer prognosis than those in the low-risk group (Figure 4E). The predictive accuracy of the prognostic model in CGGA was further verified in the ROC curve analysis. Results revealed that the seven-gene model had good prognostic accuracy (Figure 4F and G).
Validation of the prognostic model in CGGA. (A) Heatmap of the seven candidate genes in normal brain tissues and glioma tissues. (B) Patient distribution based on the median risk score. (C) The PCA plot. (D) The survival status of patients in different groups. (E) Kaplan-Meier curves showing survival in the different risk groups. (F-G) Area under the receiver operating curves was used to validate the predictive accuracy of the risk signature.
Independent prognostic value of the seven gene risk model
Univariate and multivariate Cox regression analyses were used to evaluate the relationship between the risk scores and the clinical parameters (age, gender, IDH, MGMT, and disease staging). Age and disease staging were shown to be independent prognostic predictors for OS in the TCGA and CGGA databases (Table 1 and 2). In the TCGA database, the high-risk genes had a higher expression in the high-risk group, as illustrated by the heatmap in Figure 5A. Similarly, the CGGA database revealed similar expression of the high-risk genes (Figure 5B).
Univariate and multivariate Cox regression analyses showing the relationship between the clinicopathological parameters and the prognostic risk model in TCGA
| Characteristics | Univariate Cox regression analysis | Multivariate Cox regression analysis | ||||||
|---|---|---|---|---|---|---|---|---|
| HR | HR9.5L | HR9.5H | p Value | HR | HR9.5L | HR9.5H | p Value | |
| Age | 1.04 | 1.02 | 1.06 | <0.001 | 1.06 | 1.03 | 1.1 | <0.001 |
| Gender | 0.75 | 0.5 | 1.13 | Ns | 0.94 | 0.55 | 1.5 | 0.812 |
| IDH | 8.69 | 2.1 | 35.94 | <0.01 | 0.74 | 0.14 | 4.0 | 0.723 |
| MGMT | 1.63 | 1.01 | 2.64 | <0.05 | 0.7 | 1.21 | 2.1 | 0.487 |
| Risk score | 3.7 | 2.02 | 6.77 | <0.01 | 3.43 | 1.5 | 7.9 | 0.004 |
Univariate and multivariate Cox regression analyses showing the relationship between the clinicopathological parameters and the prognostic risk model in CGGA
| Characteristics | Univariate Cox regression analysis | Multivariate Cox regression analysis | ||||||
|---|---|---|---|---|---|---|---|---|
| HR | HR9.5L | HR9.5H | p Value | HR | HR9.5L | HR9.5H | p Value | |
| Age | 1.03 | 1.02 | 1.03 | <0.001 | 1.0 | 1.00 | 1.0 | 0.042 |
| Gender | 1.06 | 0.87 | 1.3 | ns | 1.0 | 0.86 | 1.3 | 0.652 |
| IDH | 3.09 | 2.51 | 3.81 | <0.001 | 1.4 | 1.01 | 2.0 | 0.043 |
| MGMT | 1.26 | 1.01 | 1.57 | <0.05 | 1.1 | 0.87 | 1.4 | 0.381 |
| Stage | ||||||||
| III | 2.55 | 1.85 | 3.51 | <0.001 | 2.5 | 1.84 | 3.5 | <0.001 |
| IV | 6.97 | 5.08 | 9.56 | <0.001 | 6.1 | 4.36 | 8.4 | <0.001 |
| Risk score | 1.44 | 1.26 | 1.66 | <0.001 | 1.2 | 1.04 | 1.3 | 0.01 |
Heatmap showing the association between the clinicopathological features and the risk groups in TCGA (A) and CGGA (B).
Functional enrichment analyses
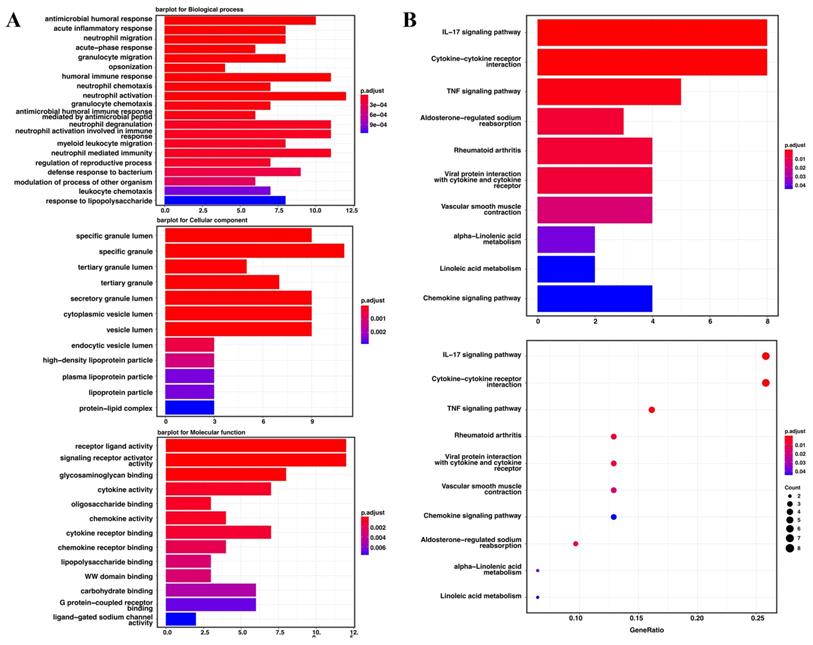
Gene ontology enrichment analysis and the KEGG pathway were used to identify the biological characteristics based on the DEGs. The DEGs were shown to be highly expressed in antimicrobial humoral response, acute inflammatory response, neutrophil migration and acute-phase response. The specific granule lumen, specific granule, and tertiary granule lumen were abundant cellular component terminologies. In addition, receptor-ligand activity, signaling receptor activator activity, glycosaminoglycan binding, and cytokine activity were identified as the most abundant functional terms (Figure 6A). The KEGG pathway analysis revealed that the IL-17, cytokine-cytokine receptor interaction, and TNF signaling pathways were the most abundant pathways (Figure 6B).
The Go enrichment analysis and KEGG pathway analysis of the seven candidate genes in TCGA. (A) Results of the GO enrichment analysis in TCGA. (B) Results of the KEGG analysis in TCGA.
Comparison of immune cell infiltration patterns in two different risk groups
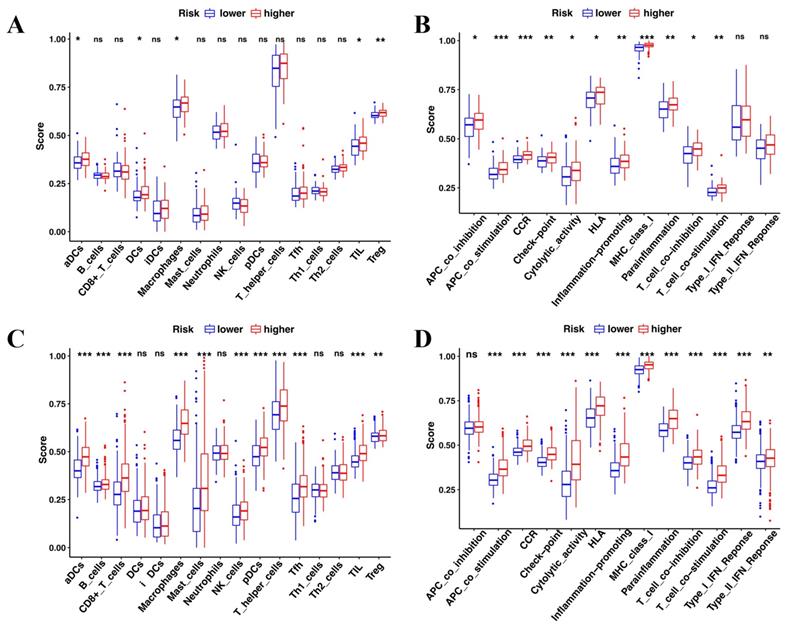
The enrichment analysis revealed that immune features were intrinsically related to radiosensitivity and ferroptosis. Therefore, the immune cell infiltration patterns were compared between the high-risk and low-risk groups by ssGSEA. In the TCGA cohort, aCDs, DCs, Macrophages, TIL, and Treg cells had a higher infiltration in the high-risk group (Figure 7A). Of the 13 immune pathways, the type I IFN and type II IFN response pathways were similar between the high-risk group and the low-risk group in TCGA (Figure 7B). Similarly, the CGGA showed similar immune cell infiltration patterns (Figure 7C and D).
Comparison of the immune cell infiltration patterns between the high- and low-risk groups. (A-B) The enrichment scores of 16 types of immune cells and 13 immune-related pathways were compared between the high- and low-risk groups in TCGA. (C-D) The enrichment scores of 16 types of immune cells and 13 immune-related pathways were compared between the high- and low-risk groups in CGGA. P-values were shown as: ns, not significant; *P < 0.05; **P < 0.01; ***P < 0.001.
Association between ferroptosis and radiosensitivity in gliomas
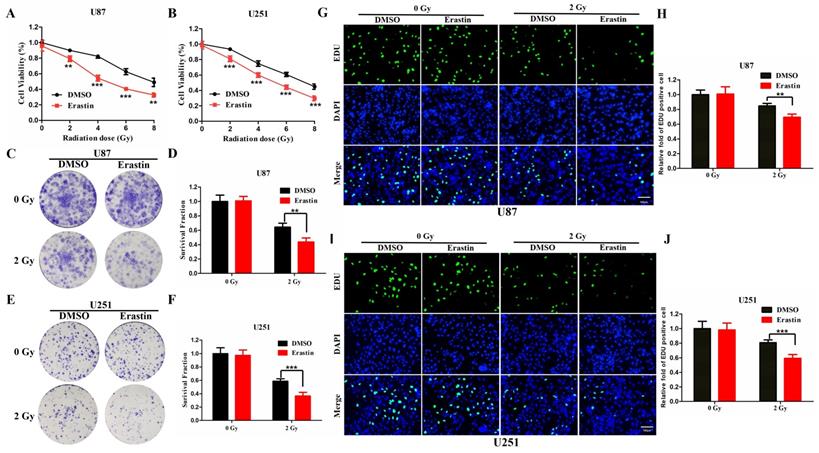
The ferroptosis inducer, erastin, was used to treat U87 and U251 cells, which were then observed for CCK-8 assay to evaluate the association between radiosensitivity and ferroptosis. Treatment with erastin followed by radiation was shown to significantly inhibit cell viability in the U87 and U251 cells compared to the vehicle (DMSO)-treated cells (Figure 8A, B). Furthermore, the colony formation assay was conducted to evaluate the radiosensitivity of erastin. The erastin-treated U87 and U251 cells were more sensitive to radiation (Figure 8C-F). Similarly, the EDU assay revealed similar conclusions in U87 and U251 cells (Figure 8G-J). These results suggested that erastin-induced ferroptosis could enhance the radiosensitivity of glioma cells.
Erastin-induced ferroptosis enhance the radiosensitivity of glioma cells. (A-B) The CCK-8 cell viability assay following treatment of the U87 and U251 cells with erastin and different radiation doses. (C-F) The colony formation assay following treatment of U87 and U251 cells with erastin and radiation. (G-J) The EDU assay following treatment of U87 and U251 cells with erastin and radiation. P values were shown as: **P < 0.01, ***P < 0.001.
Discussion
There has been a marked improvement in the diagnosis and treatment of glioma patients. However, gliomas still have high incidence and mortality rates. Radiotherapy is one of the most effective treatments employed in gliomas. Due to high radiation resistance, the therapeutic effects of radiotherapy are unsatisfactory. Several factors contribute to radiation resistance, such as hypoxia, DNA repair, and activation of survival-related signaling pathways. Hypoxia is a key characteristic of the tumor microenvironment, leading to radiation resistance by affecting gene expression [24-26]. In addition, radiation can lead to damage of the cellular DNA. The repair process could lead to decreased radiosensitivity or radioresistance of the tumor cells [27, 28]. Besides, tumor cells could activate some survival-related signaling pathways following radiation [29-31]. Many radiosensitizers have been developed but they cannot meaningfully meet the clinical needs. Therefore, exploring new biomarkers and targets to improve radiosensitivity will help improve the diagnosis, treatment and prognosis of gliomas.
Recent evidence shows that ferroptosis is highly correlated with radiosensitivity. However, a prognostic model of radiosensitivity- and ferroptosis- associated genes evaluating their interaction in gliomas has not been constructed. Therefore, this study conducted a comprehensive analysis of the differential expressed radiosensitivity- and ferroptosis-associated genes. The survival analysis revealed seven prognostic genes (HSPB1, STAT3, CA9, MAP1LC3A, MAPK1, ZEB1, and TNFAIP3). The HSPB1 gene belongs to a conserved protein family which regulates various cellular processes. Zhan et al. reported that HSPB1 could promote cell proliferation in gliomas [32]. In addition, HSPB1 regulates extracellular matrix and epithelial-mesenchymal transition, associated with radiation resistance in GBM [33]. Furthermore, Tang et al. revealed that HSPB1 was crucial in ferroptosis-mediated cancer therapy [34]. STAT3 was associated with poor prognosis in gliomas [35]. Bao et al. demonstrated that Ibrutinib could inactivate STAT3, thus reducing radiation resistance in glioma cells. This finding suggested that STAT3 is a risk gene in gliomas, consistent with the results of the present study [36]. Hu et al found that bavachin could induce ferroptosis through the STAT3/P53/SLC7A11 Axis [37]. Furthermore, CA9 was shown to be highly overexpressed in GBM, conferring radiation resistance in glioma cells [38, 39]. Under hypoxia, CA9 could confer resistance to ferroptosis in malignant mesothelioma [40]. Michael et al. reported that silencing of MAP1LC3A resulted in significant radiosensitization in lung cancer cells [41]. MAPK1 is a tumor promoter in GBM and can be targetted by MicroRNA-362 inhibiting cell growth [42]. In addition, ZEB1, a critical regulator of the DNA damage response, is linked to radioresistance[43]. Catherine et al. revealed that α6-integrin could contribute to GBM radioresistance by modulating ZEB1 [44]. Further, TNFAIP3 was identified as a key ferroptosis-related gene in intracerebral hemorrhage [45]. Besides, TNFAIP3 was shown to be a regulator of NFkB in glioma cells and was associated with resistance to O6 alkylating agents [46].
Some preliminary studies show that immune mechanisms play important roles in radiosensitivity and ferroptosis [47-49]. Zou et al. revealed that T cells could promote ferroptosis in tumor cells, thus providing a potential therapeutic approach [11]. Feng et al. reported that reprogramming the immunosuppressive metabolic microenvironment could improve the curative effect of radiotherapy in breast cancer [50]. In this study, the functional enrichment analysis and KEGG pathway analysis revealed that immune cells and immune-related pathways were highly enriched in glioma-related biological processes. These results suggested that the immune microenvironment was highly correlated to radiosensitivity and ferroptosis in gliomas.
Limitations
However, this study had some limitations. First, this study had a relatively small sample size. Second, this study had a retrospective nature. Therefore, in the future, prospective studies need to be conducted to determine overall survival in follow-up. Third, the results of this study need to be validated in vivo and in vitro experiments. Finally, future studies should explore the specific mechanism related to radiosensitivity and ferroptosis.
Conclusion
In conclusion, this study is the first to investigate the expression of radiosensitivity- and ferroptosis-associated genes in gliomas. The study identified seven candidate genes and developed a prognostic model. In addition, the study provides a basis for further evaluating the therapeutic role of the seven identified genes.
Supplementary Material
Supplementary figure and tables.
Acknowledgements
This study was supported by grants from the National Natural Science Foundation of China (Grant No. 81902535, 81972350), the clinical medical special Program of Science and Technology Project of Jiangsu Province (BE2019734), and the Postgraduate Research & Practice Innovation Program of Jiangsu Province (Grant No. SJCX21_0657).
Competing Interests
The authors have declared that no competing interest exists.
References
1. Chen X, Zhang M, Gan H, Wang H, Lee JH, Fang D. et al. A novel enhancer regulates MGMT expression and promotes temozolomide resistance in glioblastoma. Nat Commun. 2018;9:2949
2. McKinnon C, Nandhabalan M, Murray SA, Plaha P. Glioblastoma: clinical presentation, diagnosis, and management. BMJ. 2021;374:n1560
3. Liu L, Zhang P, Dong X, Li H, Li S, Cheng S. et al. Circ_0001367 inhibits glioma proliferation, migration and invasion by sponging miR-431 and thus regulating NRXN3. Cell Death Dis. 2021;12:536
4. Ahmed R, Oborski MJ, Hwang M, Lieberman FS, Mountz JM. Malignant gliomas: current perspectives in diagnosis, treatment, and early response assessment using advanced quantitative imaging methods. Cancer Manag Res. 2014;6:149-70
5. Iuchi T, Hatano K, Kodama T, Sakaida T, Yokoi S, Kawasaki K. et al. Phase 2 trial of hypofractionated high-dose intensity modulated radiation therapy with concurrent and adjuvant temozolomide for newly diagnosed glioblastoma. Int J Radiat Oncol Biol Phys. 2014;88:793-800
6. Deland K, Starr BF, Mercer JS, Byemerwa J, Crabtree DM, Williams NT. et al. Tumor genotype dictates radiosensitization after Atm deletion in primary brainstem glioma models. J Clin Invest. 2021;131(1):e142158
7. Alexandru O, Purcaru SO, Tataranu LG, Lucan L, Castro J, Folcuti C. et al. The Influence of EGFR Inactivation on the Radiation Response in High Grade Glioma. Int J Mol Sci. 2018;19(1):229
8. Lei G, Zhang Y, Koppula P, Liu X, Zhang J, Lin SH. et al. The role of ferroptosis in ionizing radiation-induced cell death and tumor suppression. Cell Res. 2020;30:146-62
9. Lang X, Green MD, Wang W, Yu J, Choi JE, Jiang L. et al. Radiotherapy and Immunotherapy Promote Tumoral Lipid Oxidation and Ferroptosis via Synergistic Repression of SLC7A11. Cancer Discov. 2019;9:1673-85
10. Ye LF, Chaudhary KR, Zandkarimi F, Harken AD, Kinslow CJ, Upadhyayula PS. et al. Radiation-Induced Lipid Peroxidation Triggers Ferroptosis and Synergizes with Ferroptosis Inducers. ACS Chem Biol. 2020;15:469-84
11. Wang W, Green M, Choi JE, Gijon M, Kennedy PD, Johnson JK. et al. CD8(+) T cells regulate tumour ferroptosis during cancer immunotherapy. Nature. 2019;569:270-4
12. Lei G, Mao C, Yan Y, Zhuang L, Gan B. Ferroptosis, radiotherapy, and combination therapeutic strategies. Protein Cell. 2021;12(11):836-857
13. Poetsch AR, Boulton SJ, Luscombe NM. Genomic landscape of oxidative DNA damage and repair reveals regioselective protection from mutagenesis. Genome Biol. 2018;19:215
14. Zhao Z, Zhang KN, Wang Q, Li G, Zeng F, Zhang Y. et al. Chinese Glioma Genome Atlas (CGGA): A Comprehensive Resource with Functional Genomic Data from Chinese Glioma Patients. Genomics Proteomics Bioinformatics. 2021;19:1-12
15. Wen P, Xia J, Cao X, Chen B, Tao Y, Wu L. et al. dbCRSR: a manually curated database for regulation of cancer radiosensitivity. Database (Oxford). 2018;2018:bay049
16. Zhou N, Bao J. FerrDb: a manually curated resource for regulators and markers of ferroptosis and ferroptosis-disease associations. Database (Oxford). 2020;2020:baaa021
17. Palmer SC, Tendal B, Mustafa RA, Vandvik PO, Li S, Hao Q. et al. Sodium-glucose cotransporter protein-2 (SGLT-2) inhibitors and glucagon-like peptide-1 (GLP-1) receptor agonists for type 2 diabetes: systematic review and network meta-analysis of randomised controlled trials. BMJ. 2021;372:m4573
18. Chen L, Lu D, Sun K, Xu Y, Hu P, Li X. et al. Identification of biomarkers associated with diagnosis and prognosis of colorectal cancer patients based on integrated bioinformatics analysis. Gene. 2019;692:119-25
19. Xu N, Wu YP, Ke ZB, Liang YC, Cai H, Su WT. et al. Identification of key DNA methylation-driven genes in prostate adenocarcinoma: an integrative analysis of TCGA methylation data. J Transl Med. 2019;17:311
20. Ye Y, Dai Q, Qi H. A novel defined pyroptosis-related gene signature for predicting the prognosis of ovarian cancer. Cell Death Discov. 2021;7:71
21. Liu L, Cui S, Wan T, Li X, Tian W, Zhang R. et al. Long non-coding RNA HOTAIR acts as a competing endogenous RNA to promote glioma progression by sponging miR-126-5p. J Cell Physiol. 2018;233:6822-31
22. Mao H, Xie Y, Ju H, Mao H, Zhao L, Wang Z. et al. Design of Tumor Microenvironment-Responsive Drug-Drug Micelle for Cancer Radiochemotherapy. ACS Appl Mater Interfaces. 2018;10:33923-35
23. Liu H, Cai Y, Zhang Y, Xie Y, Qiu H, Hua L. et al. Development of a Hypoxic Radiosensitizer-Prodrug Liposome Delivery DNA Repair Inhibitor Dbait Combination with Radiotherapy for Glioma Therapy. Adv Healthc Mater. 2017;6(12):1601377
24. Qin X, Yao J, Geng P, Fu X, Xue J, Zhang Z. LncRNA TSLC1-AS1 is a novel tumor suppressor in glioma. Int J Clin Exp Pathol. 2014;7:3065-72
25. Wang P, Ren Z, Sun P. Overexpression of the long non-coding RNA MEG3 impairs in vitro glioma cell proliferation. J Cell Biochem. 2012;113:1868-74
26. Pastorek J, Pastorekova S. Hypoxia-induced carbonic anhydrase IX as a target for cancer therapy: from biology to clinical use. Semin Cancer Biol. 2015;31:52-64
27. Shibata A, Jeggo PA. DNA double-strand break repair in a cellular context. Clin Oncol (R Coll Radiol). 2014;26:243-9
28. Lavelle C, Foray N. Chromatin structure and radiation-induced DNA damage: from structural biology to radiobiology. Int J Biochem Cell Biol. 2014;49:84-97
29. Skvortsov S, Dudas J, Eichberger P, Witsch-Baumgartner M, Loeffler-Ragg J, Pritz C. et al. Rac1 as a potential therapeutic target for chemo-radioresistant head and neck squamous cell carcinomas (HNSCC). Br J Cancer. 2014;110:2677-87
30. Skvortsov S, Debbage P, Lukas P, Skvortsova I. Crosstalk between DNA repair and cancer stem cell (CSC) associated intracellular pathways. Semin Cancer Biol. 2015;31:36-42
31. Hein AL, Ouellette MM, Yan Y. Radiation-induced signaling pathways that promote cancer cell survival (review). Int J Oncol. 2014;45:1813-9
32. Ye H, Huang H, Cao F, Chen M, Zheng X, Zhan R. HSPB1 Enhances SIRT2-Mediated G6PD Activation and Promotes Glioma Cell Proliferation. PLoS One. 2016;11:e0164285
33. Rajesh Y, Biswas A, Kumar U, Banerjee I, Das S, Maji S. et al. Lumefantrine, an antimalarial drug, reverses radiation and temozolomide resistance in glioblastoma. Proc Natl Acad Sci U S A. 2020;117:12324-31
34. Sun X, Ou Z, Xie M, Kang R, Fan Y, Niu X. et al. HSPB1 as a novel regulator of ferroptotic cancer cell death. Oncogene. 2015;34:5617-25
35. Liang B, Li SY, Gong HZ, Wang LX, Lu J, Zhao YX. et al. Clinicopathological and Prognostic Roles of STAT3 and Its Phosphorylation in Glioma. Dis Markers. 2020;2020:8833885
36. Shi Y, Guryanova OA, Zhou W, Liu C, Huang Z, Fang X. et al. Ibrutinib inactivates BMX-STAT3 in glioma stem cells to impair malignant growth and radioresistance. Sci Transl Med. 2018;10(443):eaah6816
37. Luo Y, Gao X, Zou L, Lei M, Feng J, Hu Z. Bavachin Induces Ferroptosis through the STAT3/P53/SLC7A11 Axis in Osteosarcoma Cells. Oxid Med Cell Longev. 2021;2021:1783485
38. Said HM, Supuran CT, Hageman C, Staab A, Polat B, Katzer A. et al. Modulation of carbonic anhydrase 9 (CA9) in human brain cancer. Curr Pharm Des. 2010;16:3288-99
39. Teixeira SA, Viapiano MS, Andrade AF, Nandhu MS, Pezuk JA, Bidinotto LT. et al. The Carbonic Anhydrase Inhibitor E7070 Sensitizes Glioblastoma Cells to Radio- and Chemotherapy and Reduces Tumor Growth. Mol Neurobiol. 2021;58:4520-34
40. Li Z, Jiang L, Chew SH, Hirayama T, Sekido Y, Toyokuni S. Carbonic anhydrase 9 confers resistance to ferroptosis/apoptosis in malignant mesothelioma under hypoxia. Redox Biol. 2019;26:101297
41. Karagounis IV, Kalamida D, Mitrakas A, Pouliliou S, Liousia MV, Giatromanolaki A. et al. Repression of the autophagic response sensitises lung cancer cells to radiation and chemotherapy. Br J Cancer. 2016;115:312-21
42. Shi HZ, Wang DN, Ma LN, Zhu H. MicroRNA-362 inhibits cell growth and metastasis in glioblastoma by targeting MAPK1. Eur Rev Med Pharmacol Sci. 2020;24:8931-9
43. Drapela S, Bouchal J, Jolly MK, Culig Z, Soucek K. ZEB1: A Critical Regulator of Cell Plasticity, DNA Damage Response, and Therapy Resistance. Front Mol Biosci. 2020;7:36
44. Kowalski-Chauvel A, Modesto A, Gouaze-Andersson V, Baricault L, Gilhodes J, Delmas C. et al. Alpha-6 integrin promotes radioresistance of glioblastoma by modulating DNA damage response and the transcription factor Zeb1. Cell Death Dis. 2018;9:872
45. Liu T, Li X, Cui Y, Meng P, Zeng G, Wang Y. et al. Bioinformatics Analysis Identifies Potential Ferroptosis Key Genes in the Pathogenesis of Intracerebral Hemorrhage. Front Neurosci. 2021;15:661663
46. Bredel M, Bredel C, Juric D, Duran GE, Yu RX, Harsh GR. et al. Tumor necrosis factor-alpha-induced protein 3 as a putative regulator of nuclear factor-kappaB-mediated resistance to O6-alkylating agents in human glioblastomas. J Clin Oncol. 2006;24:274-87
47. Chen X, Kang R, Kroemer G, Tang D. Broadening horizons: the role of ferroptosis in cancer. Nat Rev Clin Oncol. 2021;18:280-96
48. Friedmann Angeli JP, Krysko DV, Conrad M. Ferroptosis at the crossroads of cancer-acquired drug resistance and immune evasion. Nat Rev Cancer. 2019;19:405-14
49. Weichselbaum RR, Liang H, Deng L, Fu YX. Radiotherapy and immunotherapy: a beneficial liaison? Nat Rev Clin Oncol. 2017;14:365-79
50. Wang C, Dong Z, Hao Y, Zhu Y, Ni J, Li Q. et al. Coordination Polymer-Coated CaCO3 Reinforces Radiotherapy by Reprogramming the Immunosuppressive Metabolic Microenvironment. Adv Mater. 2021: e2106520.
Author contact
![]() Corresponding authors: Hongyi Liu, Department of Neurosurgery, The Affiliated Brain Hospital of Nanjing Medical University, Fourth Clinical College of Nanjing Medical University, Nanjing 210029, China. Email: njnkyylhycom; Hong Xiao, Department of Neuro-Psychiatric Institute, The Affiliated Brain Hospital of Nanjing Medical University, Nanjing 210029, China. Email: xiaohong63xxcom.
Corresponding authors: Hongyi Liu, Department of Neurosurgery, The Affiliated Brain Hospital of Nanjing Medical University, Fourth Clinical College of Nanjing Medical University, Nanjing 210029, China. Email: njnkyylhycom; Hong Xiao, Department of Neuro-Psychiatric Institute, The Affiliated Brain Hospital of Nanjing Medical University, Nanjing 210029, China. Email: xiaohong63xxcom.