Impact Factor ISSN: 1837-9664

 Global reach, higher impact
J Cancer 2021; 12(24):7477-7487. doi:10.7150/jca.63244 This issue Cite
Research Paper
High-performance Collective Biomarker from Liquid Biopsy for Diagnosis of Pancreatic Cancer Based on Mass Spectrometry and Machine Learning
Tomohiko Iwano1, Kentaro Yoshimura1, Genki Watanabe2, Ryo Saito3, Sho Kiritani2, Hiromichi Kawaida3, Takeshi Moriguchi4, Tasuku Murata5, Koretsugu Ogata5, Daisuke Ichikawa3, Junichi Arita2, Kiyoshi Hasegawa2, Sen Takeda1 ![]()
1. Department of Anatomy and Cell Biology, Faculty of Medicine, University of Yamanashi, Chuo, Yamanashi, Japan
2. Hepato-Biliary-Pancreatic Surgery Division, Department of Surgery, Graduate School of Medicine, The University of Tokyo, Tokyo, Japan
3. First Department of Surgery, Faculty of Medicine, University of Yamanashi, Chuo, Yamanashi, Japan
4. Department of Emergency and Critical Care Medicine, Faculty of Medicine, University of Yamanashi, Chuo, Yamanashi, Japan
5. Shimadzu Corporation, Nakagyo, Kyoto, Japan
Received 2021-5-27; Accepted 2021-10-12; Published 2021-11-4
Abstract

Background: Most pancreatic cancers are found at progressive stages when they cannot be surgically removed. Therefore, a highly accurate early detection method is urgently needed.
Methods: This study analyzed serum from Japanese patients who suffered from pancreatic ductal adenocarcinoma (PDAC) and aimed to establish a PDAC-diagnostic system with metabolites in serum. Two groups of metabolites, primary metabolites (PM) and phospholipids (PL), were analyzed using liquid chromatography/electrospray ionization mass spectrometry. A support vector machine was employed to establish a machine learning-based diagnostic algorithm.
Results: Integrating PM and PL databases improved cancer diagnostic accuracy and the area under the receiver operating characteristic curve. It was more effective than the algorithm based on either PM or PL database, or single metabolites as a biomarker. Subsequently, 36 statistically significant metabolites were fed into the algorithm as a collective biomarker, which improved results by accomplishing 97.4% and was further validated by additional serum. Interestingly, specific clusters of metabolites from patients with preoperative neoadjuvant chemotherapy (NAC) showed different patterns from those without NAC and were somewhat comparable to those of the control.
Conclusion: We propose an efficient screening system for PDAC with high accuracy by liquid biopsy and potential biomarkers useful for assessing NAC performance.
Keywords: Pancreatic ductal adenocarcinoma, Liquid biopsy, Metabolome, Machine leargning, Neoadjuvant chemotherapy
Introduction
An increasing number of patients have pancreatic cancer, which is currently the fourth leading cause of annual mortality of almost 35,000 in Japan [1]. Moreover, pancreatic ductal adenocarcinoma (PDAC) accounts for around 90% of malignant pancreatic tumors. The only curable treatment for pancreatic cancers is surgical tumor resection, although >80% of cases are at unresectable stages [2, 3]. Therefore, screening strategies ideal for detecting curable PDAC are awaited. Classic tumor markers such as carbohydrate antigen 19-9 (CA19-9) and carcinoembryonic antigen are routinely used for screening and detecting PDAC. However, the relatively low true positivity in the early stages prevents tumor detection at a curable state [4-6]. Alternative imaging modalities such as ultrasound scan, computed tomography (CT), and magnetic resonance cholangiopancreatography (MRCP) are incapable of delineating the tumor with a small diameter [7]. With all those in mind, a new strategy revolutionizing pancreatic cancer diagnostics is needed.
An avalanche of studies has used biopsy specimens taken by surgery or endoscopic ultrasound-fine needle aspiration. However, bona fide heterogeneity in tumors makes it difficult to look for an ideal biomarker. Furthermore, the repetitive and time-consuming examination renders patients reluctant to accept the clinical trial [8, 9]. Considering the availability of body fluids, the so-called liquid biopsy, including plasma, serum, and urine, has been intensively investigated to meet the clinical needs and patients' benefit by useful biomarkers for pancreatic cancer [10-15].
Genetic mutations, either in proto-oncogenes or tumor suppressor genes [16], incur some metabolic changes in tumor cells. Therefore, downstream metabolites showing patterns reflecting the metabolic changes due to genetic mutation, either directly or indirectly, are reasonably assumed [17]. Along with this notion, mass spectrometry (MS) analyzes the metabolites (e.g., phospholipid (PL), primary metabolite (PM), and lipid mediators). Several groups reported specific biomarkers for pancreatic cancer from serum by making most of the Fourier-transform ion cyclotron resonance MS [18], gas chromatography MS [19, 20], and liquid chromatography/electrospray ionization MS (LC/ESI-MS)[21-23].
We have developed a medical device based on MS and machine learning and validated the performance in diagnosing various diseases. For example, the current prototype apparatus equipped with probe electrospray ionization-MS (PESI-MS) [24] is superior to other MS-based instruments [25] in clinical settings due to procedure simplicity, analysis rapidity, and cost performance [26, 27]. This instrumentation enables the discrimination of diseases from the background (e.g., head and neck tumor and breast cancer) [28-31]. Recently, the serum data that this study system analyzed predicted PDAC with sensitivity and specificity superior to CA19-9 [32]. This successful prediction supports the idea that body fluid is an appropriate human sample to establish a novel method for detecting early PDAC. The PESI-MS system gives preference to the sample preparation simplicity and provides a metabolome fingerprint with >2,000 variables but does not target specific molecules. However, too many variables sometimes cause overfitting to a specific sample group or is disturbed by background noise, as summarized in previous reviews [33, 34]. Therefore, targeted metabolite selection is an option for algorithm optimization. For targeting, LC/ESI-MS is a method to analyze and annotate specific molecules.
A collective biomarker, considering the unique combination of PM and PL, has not been employed yet, while LC/ESI-MS has been applied to discover metabolites specific to the pancreatic tumor [19, 22, 35, 36]. This study analyzed the serum with LC/ESI-MS to obtain metabolome and established a diagnostic algorithm specific to pancreatic cancer on PM and PL databases. A higher diagnostic accuracy has been achieved compared with other previous techniques. Interestingly, the current method suggests the monitoring capability of the metabolic changes in neoadjuvant chemotherapy (NAC)-treated patients reflecting the effectiveness of preoperative chemotherapy. While NAC was recently incorporated into the therapeutic procedure for PDAC for prognosis improvement, it is generally difficult to evaluate NAC's effects even with the combination of CA19-9 and imaging diagnosis. Thus, the current strategy can pave a new way in NAC evaluation in clinical settings by liquid biopsy.
Methods
Ethics statement
This study followed the ethical standards of the Declaration of Helsinki. We fractioned serum samples from Japanese patients who underwent pancreatic cancer surgery at the University of Yamanashi Hospital or the University of Tokyo Hospital. This study used serum from outpatients transported to the University of Yamanashi Hospital's emergency department as the control. The ethics committee of the University of Yamanashi (nos. 2086 and 2220) or the University of Tokyo (no. 2019370NI) approved the study protocol. Patients provided informed consent in a written format with opt-out. Pathological diagnosis was according to the Union for International Cancer Control (UICC) TNM classification of malignant tumors. All clinical data were anonymized.
Neoadjuvant chemotherapy
The regimens of neoadjuvant chemotherapy (NAC) were Gemcitabine/S-1 (GS) or Gemcitabine/nab-Paclitaxel (GnP). The efficacy of patients with NAC was summarized in Table S1.
Inclusion and exclusion criteria
Preoperative serum was obtained from patients before receiving surgical resection. This study enrolled 77 cases (37 from the University of Yamanashi Hospital and 40 from the University of Tokyo Hospital). Out of them, this study used 29 cases whose cancer grades of T2 or T3 according to the TNM classification (Fig. S1). Moreover, 30 cases of control serum were obtained from the outpatients transported to the emergency department, who had not been admitted to the hospital. The patients were 56-87 years old. Furthermore, those with a medical history of cancer, diabetes, dyslipidemia, and chronic kidney disease were not included in the control group (Table S2).
Clinical sample preparation
For PL analysis, 990 µL of 0.1% formic acid in methanol were mixed with 10 µL of serum by ThermoMixer C (Eppendorf, CA, USA) for 5 min at 4 °C. The sample solution was centrifuged at 15,000×g for 10 min after being incubated on ice for 10 min. The resultant supernatant was twofold diluted using 0.1% formic acid in methanol, from which 300 µL diluted supernatant was placed into a LabTotal Vial (Shimadzu Corporation, Kyoto, Japan). Moreover, 50 µL serum was mixed with 500 µL of 0.1% formic acid in methanol to analyze PM. After adding 250 µL of pure water, 500 µL chloroform was sequentially placed, followed by vortexing for 10 min. Subsequently, the mixture was centrifuged at 15,000×g for 10 min. Also, 400 µL of the upper layer was taken and applied to Amicon Ultra 0.5 mL centrifugal filter MWCO 3 kDa (MERCK KGAA, Darmstadt, Germany). The filtrate was dried up by a centrifugal vacuum concentrator (TAITEC Corporation, Saitama, Japan). The resultant components were redissolved into 200 µL pure water. Finally, the sample was applied to TORAST-H Bio Vial (Shimadzu Corporation).
Mass spectrometry
LC/ESI-MS was performed using the high-pressure LC installed LCMS-8060 (Shimadzu Corporation) system. The LC/MS/MS Method Package for Phospholipid Profiling (Shimadzu Corporation) was used according to the manufacturer's instructions to analyze the PL. Kinetex C8 column (Kinetex C8, 150 mm × 2.1 mm i.d., 3.6 μm particle size; Phenomenex, Torrance, CA, USA) with mobile phases A (20 mM ammonium formate in water) and B (acetonitrile-isopropanol 1:1 v/v) were employed for LC separation. The mobile phase B gradient was programmed as 20% (0 min)-20% (1 min)-40% (2 min)-92.5% (25 min). The column oven temperature was 45 °C. To analyze the PM, LC/MS/MS Method Package for Primary Metabolites, Ver. 2, was used. Discovery HS F5-3 column (150 mm × 2.1 mm I.D. ×, 3 µm particle size; Merk & Co., Kenilworth, NJ, USA) with mobile phases A (0.1% formic acid in water) and B (0.1% formic acid in acetonitrile) was used for LC separation. Furthermore, mobile phase B gradient was programmed as 0% (0 min)-25% (51 min)-35% (11 min)-95% (20 min). The column oven temperature changed to 40 °C.
Statistical analysis
Data processing and molecular identification/quantification were performed automatically by LabSolutions (version 5.82 SP1; Shimadzu Corporation). Obtained data were stored in a relational database with clinical parameters. For statistical analysis, we normalized mass spectra using a median with autoscaling for each metabolite. Statistical and biomarker analyses performed partial least square regression (PLSR) analysis, heatmap, and receiver operating characteristic (ROC) curve on MetaboAnalyst 5.0 (https://www.metaboanalyst.ca/). We drew ROC curves on the probabilities calculated using the support vector machine (SVM) based on each group's ion intensities. Cancer probability was shown as an average of 100 runs of Monte Carlo cross-validation using two-thirds of the total samples. The metabolite ratio was calculated using normalized ion intensity values in LC/ESI-MS between cancer and control groups. P-values were calculated using the Student's t-test (for two groups) and one-way analysis of variance (ANOVA) (for three groups) to show the statistical significance of specific molecules. Moreover, Microsoft Excel and GraphPad Prism 7.0 were used for arithmetic and graphs. We analyzed the metabolomics pathway with the normalized metabolome data by median and autoscaling on MetaboAnalyst 5.0.
Results
Patients' characteristics
The clinical PDAC characteristics and control patient cohort are summarized in Table 1. This study collected serum samples from 77 patients who underwent pancreatic cancer operation at the University of Tokyo Hospital or the University of Yamanashi Hospital from November 2019 to October 2020. To focus on the PDAC at progressed but operable stage, we selected 29 samples at stage T2 and T3 (T as for the TMN classification) (Fig. S1). Of the 29 samples, we used 19 with earlier sampling dates (November 2019 to July 2020) for database construction (training samples). The remaining 10 samples collected after August 2020 were used as the validation cohort (validation samples; Table 1). Moreover, 30 patients from the cancer-free cohort were divided into 20 and 10 for database construction and validation, respectively, based on sample splitting according to the collection date.
Patients' characteristics
| Training samples | Validation samples | ||||
|---|---|---|---|---|---|
| Characteristics | NC (n=20) | PDAC (n=19) | NC (n=10) | PDAC (n=10) | |
| Age (year) | mean ± SD | 71.6 ± 2.4 | 72.1 ± 2.0 | 70.7 ± 3.4 | 74.6 ± 2.0 |
| Gender | male | 9 (45%) | 13 (68%) | 4 (40%) | 6 (60%) |
| female | 11 (55%) | 6 (32%) | 6 (60%) | 4 (40%) | |
| Diabetes | yes | 0 | 8 (42%) | 0 | 3 (30%) |
| no | 20 | 5 (26%) | 10 | 4 (40%) | |
| T-factor | 2 | - | 3 (16%) | - | 6 (60%) |
| 3 | - | 16 (84%) | - | 4 (40%) | |
| N-factor | 0 | - | 6 (32%) | - | 6 (60%) |
| 1a | - | 5 (25%) | - | 1 (10%) | |
| 1b | - | 0 (0%) | - | 1 (10%) | |
| 1 | - | 6 (32%) | - | 2 (20%) | |
| 2 | - | 2 (11%) | - | 0 (0%) | |
| M-factor | 0 | - | 19 (100%) | - | 10 (100%) |
| UICC-Stage | IB | - | 0 (0%) | - | 5 (50%) |
| IIA | - | 6 (32%) | - | 2 (20%) | |
| IIB | - | 13 (68%) | - | 3 (30%) | |
| NAC | treated | - | 11 (58%) | - | 9 (90%) |
| untreated | - | 8 (42%) | - | 1 (10%) | |
Diagnostic algorithm construction
This study first analyzed 39 serum collected from either PDAC patients (n = 19) or control cohort (n = 20) with two independent method packages for either PM or PL by LC/ESI-MS. Of the 97 PMs and 422 PLs in the targeted metabolites registered in the method packages, 91 PMs and 178 PLs were identified and successfully quantified. Three separate databases were composed of ion intensities of either identified PM or PL, and integrated PM and PL data (Fig. 1A). PLSR discriminates PDAC cases from the control group by any databases (Fig. 1B-D). Furthermore, we fed each normalized ion intensity of these trainig samples into the database for SVM, a machine learning, to test if the algorithm can distinguish PDAC from control cases. Sensitivity, specificity, and accuracy were calculated based on the SVM outcome in terms of concordance ratio. All other parameters exceeded 90% except for specificity and accuracy based on the PM, suggesting the higher potential for integrated PM and PL data in predicting the PDAC (Table 2). ROC curves elegantly indicate this strategy's high performance (Fig. 1E-G). Moreover, the area under the curve (AUC) was 0.9605, 0.9684, and 0.9868 for PM, PL, and their combination, respectively (Table 2).
The analysis flow and diagnostic outcomes by machine learning. A The design and flow of this study. B-D Scatter plots of PLSR for PDAC and control by metabolome data. Orange and blue plots indicate PDAC and control, respectively. Three sets of a database composed of 91 PMs (B), 178 PLs (C), and a combination of both (D) were used. A variance of each principal component (Comp) is indicated on the ordinate and abscissa. E-H ROC curves were drawn with sensitivity on the ordinate false-positive fraction on the abscissa. Support vector machine was fed with the same database used for PLSR as shown in B-D. Validation of the independent cohort gave similar outcomes as shown in G. PM primary metabolites, PL phospholipids, PDAC pancreatic ductal adenocarcinoma, PLSR partial least square regression, ROC receiver operating characteristics, AUC area under the curve, SVM support vector machine.
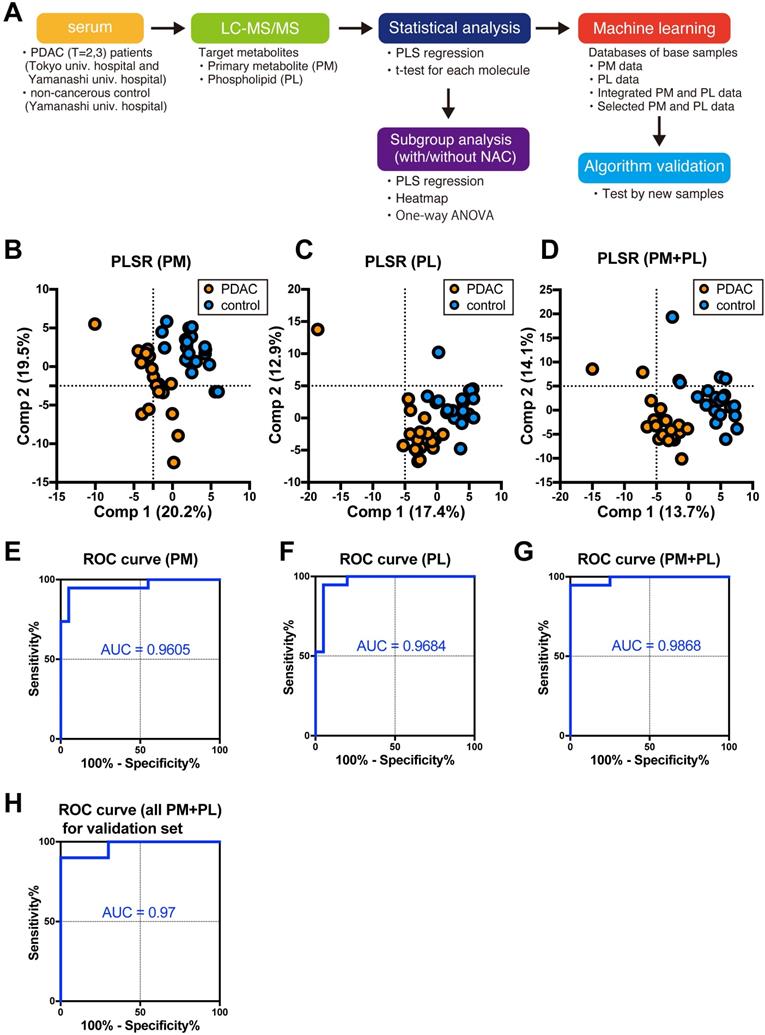
Summary of discrimination based on metabolite databases
| Database | Sensitivity (True positive (TP) /PDAC samples) | Specificity (True negative (TN)/control samples) | Accuracy (TP&TN/total samples) | AUC (95% CI) |
|---|---|---|---|---|
| Training samples | ||||
| PM (91 compounds) | 94.7 % (18/19) | 85.0 % (17/20) | 89.7 % (35/39) | 0.9605 (0.8985 - 1) |
| PL (178 compounds) | 94.7 % (18/19) | 90.0 % (18/20) | 92.3 % (36/39) | 0.9684 (0.9168 - 1) |
| PM (91 compounds) PL (178 compounds) | 94.7 % (18/19) | 95.0 % (19/20) | 94.9 % (37/39) | 0.9868 (0.9581 - 1) |
| PM (15 compounds) PL (21 compounds) | 100 % (19/19) | 95.0 % (19/20) | 97.4 % (38/39) | 0.9974 (0.9887 - 1) |
| Validation samples | ||||
| PM (91 compounds) PL (178 compounds) | 90 % (9/10) | 100 % (10/10) | 95 % (19/20) | 0.97 (0.90 -1) |
| PM (15 compounds) PL (21 compounds) | 90 % (9/10) | 100 % (10/10) | 95 % (19/20) | 0.99 (0.96 -1) |
This model was further validated by an independent cohort not included in the training samples (Table 1). Sensitivity, specificity, and accuracy were 90%, 100%, and 95%, respectively, for validation samples containing 20 cases (Table 2). AUC was 0.97 (Fig. 1H and Table 2). Thus, these results strongly support that the current diagnostic system based on the PM and PL integrated database can distinguish PDAC serum from control.
Molecular cluster optimization by machine learning database for PDAC diagnosis
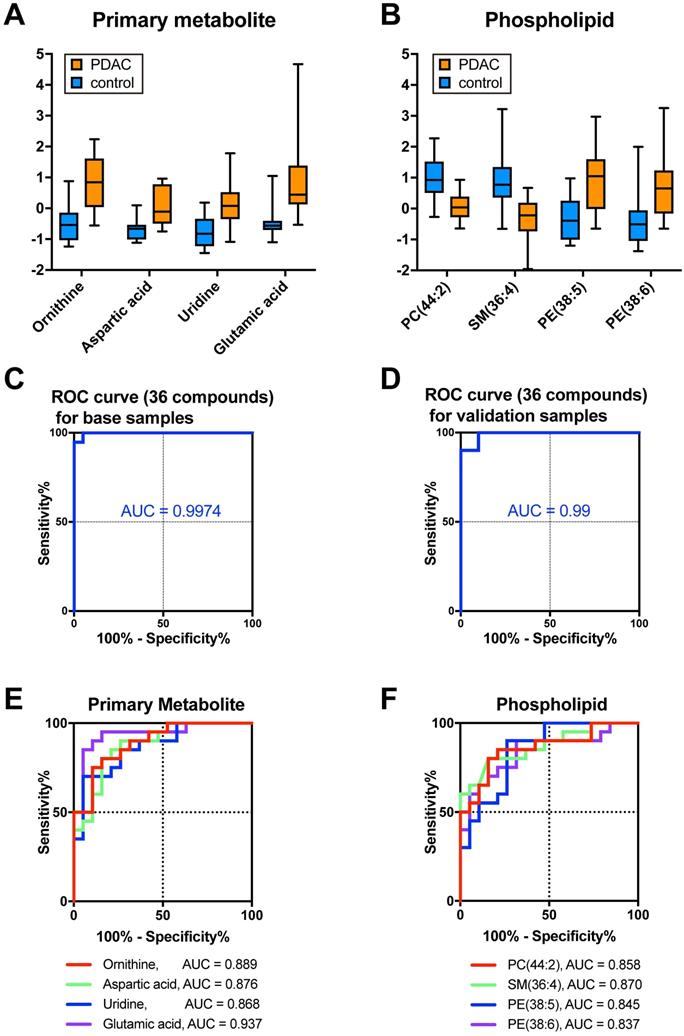
The selection of variable factors (metabolites) is important to optimize the algorithm as summarized in previous reviews [33, 34]. Too many variables sometimes cause overfitting to one side or fitting to noise data. This study then focused on the specific metabolites whose expression changed significantly in PDAC. To narrow down the candidate molecules responsible for discrimination, we used p-values <0.03 (>1.523 in -log10 transformation) and absolute fold-change >0.6 in log2 transformation. According to this criteria, 15 PMs and 21 PLs were screened (Table 3). Moreover, most of the molecules were upregulated in PDAC in the case of PM (Fig. 2A and Table 3). This study took advantage of the MetaboAnalyst and obtained several metabolic cascade candidates to identify which metabolites contribute to the metabolic pathway emphasized in PDAC (Fig. S2A and Table S3). For example, the arginine biosynthesis pathway activation can cause PDAC metabolic changes taking account of a series of significantly upregulated molecular species (e.g., ornithine, aspartic acid, glutamic acid, and arginine; Fig. S2B). Concerning PL, both phosphatidylcholine (PC), lysophosphatidylcholine (LPC) and sphingomyelin levels decreased in PDAC, while phosphatidylethanolamine (PE), and lysophosphatidylethanolamine (LPE) increased in PDAC (Fig. 2B and Table 3). Sensitivity, specificity, and accuracy in training 39 samples were 100%, 95.0%, and 97.4%, respectively, with an AUC of 0.9974, when 36 PM and PL were selectively assembled as a new database (Fig. 2C and Table 2). To assess the algorithm's power, we used 20 validation samples, where sensitivity, specificity, and accuracy were 90%, 100%, and 95%, respectively (Table 2) with an AUC of 0.99 (Fig. 2D and Table 2). Therefore, AUC exceeded those of any molecule with significantly lower p-values (e.g., ornithine, aspartic acid, uridine, or glutamic acid; Fig. 2E), and PC (44:2), SM (36:4), PE (38:5), and PE (38:6; Fig. 2F). The most efficient diagnostic process should be based on the specific PM and PL data, while the molecular background is still an open question.
List of significantly changed metabolites identified by LC/ESI-MS
| Compound name | P-value (-log10) | FC (log2) |
|---|---|---|
| Primary metabolites (PM) | ||
| Ornithine | 5.354 | 0.9226 |
| Aspartic acid | 4.683 | 1.1136 |
| Uridine | 4.658 | 0.7519 |
| Glutamic acid | 4.524 | 1.4721 |
| Xanthine | 3.124 | 0.8057 |
| Hypoxanthine | 2.814 | 1.0260 |
| Choline | 2.732 | 0.6664 |
| Guanosine | 2.623 | -0.8194 |
| S-Adenosylhomocysteine | 2.564 | 1.8460 |
| Acetylcarnitine | 2.243 | 6.6007 |
| Inosine | 1.934 | -1.1609 |
| Arginine | 1.776 | 0.7572 |
| Pyruvic acid | 1.674 | -1.6582 |
| Serine | 1.579 | 0.6047 |
| Carnosine | 1.543 | 2.8643 |
| Phospholipids (PL) | ||
| PC(44:2) | 4.512 | -0.5883 |
| SM(36:4) | 4.250 | -0.7337 |
| PE(38:5) | 4.185 | 0.8303 |
| PE(38:6) | 3.334 | 0.8950 |
| PE(40:5) | 3.187 | 0.7581 |
| PE(40:7) | 3.029 | 0.8124 |
| PC(42:1) | 2.795 | -0.3537 |
| PC(36:0) | 2.687 | -0.4481 |
| PE(40:6) | 2.625 | 0.6978 |
| PE(38:4) | 2.489 | 0.6261 |
| PE(36:4) | 2.394 | 0.8120 |
| PC(42:2) | 2.375 | -0.3622 |
| PC(42:3) | 2.249 | -0.4340 |
| PE(36:6) | 2.239 | 1.5682 |
| PE(36:5) | 2.102 | 0.8878 |
| PC(32:4) | 2.081 | -0.5911 |
| LPC(18:2) | 2.069 | -0.7811 |
| PE(40:4) | 2.032 | 0.6950 |
| PE(32:1) | 2.015 | 1.3107 |
| PI(36:1) | 1.956 | -0.5903 |
| PC(40:8) | 1.923 | -0.5133 |
| PE(38:3) | 1.904 | 0.5316 |
| LPE(20:4) | 1.897 | 1.7088 |
| LPE(22:6) | 1.889 | 0.6571 |
| LPC(22:0) | 1.879 | -0.6330 |
| LPE(18:2) | 1.711 | -0.7275 |
| PC(28:0) | 1.598 | -0.7741 |
| LPC(16:1) | 1.558 | 0.2418 |
The database based on the selected PM and PL (collective biomarker) gave the strongest prediction for PDAC than a single biomarker. A, B Boxplots of representative primary metabolites (A) and phospholipids (B) significantly changed in PDAC. Ion intensities were normalized by median and autoscaling with MetaboAnalyst 5.0. C, D ROC curves were drawn based on the database with selected 36 metabolites (C) from the training dataset or 36 metabolites from the validation dataset (D). E, F ROC curves were drawn for each primary metabolite (E) and phospholipid (F). AUC was calculated from the ROC curves. PM primary metabolites, PL phospholipids, PDAC pancreatic ductal adenocarcinoma, ROC receiver operating characteristics, AUC area under the curve.
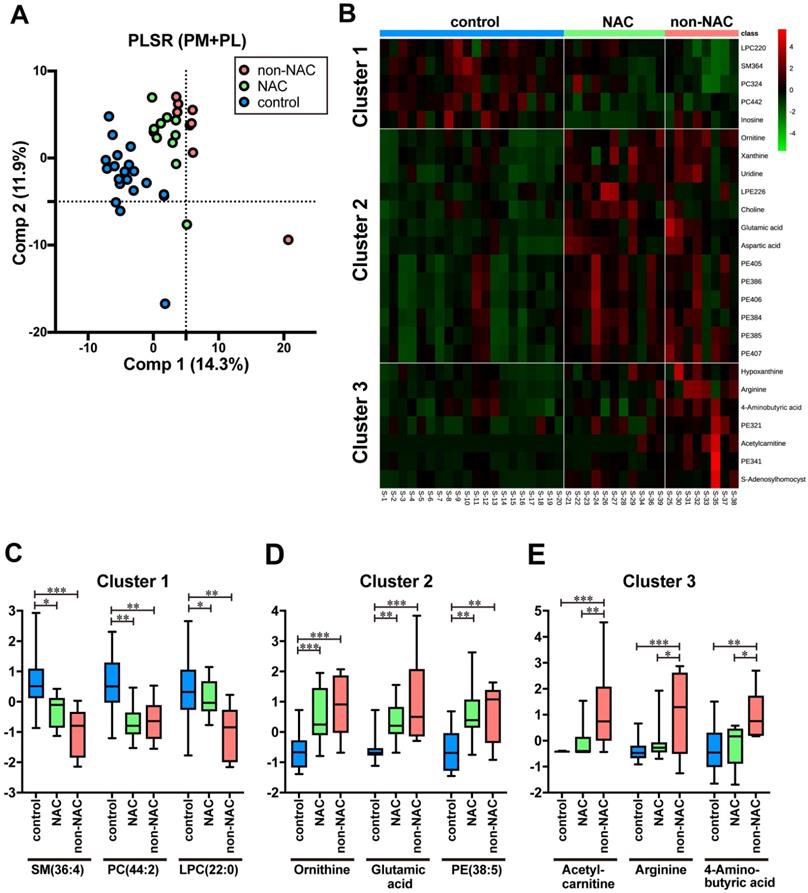
Bipartite changes in metabolic serum profiles by neoadjuvant therapy
In this study, 20 out of 29 cases have gone through NAC (Table 1 and Table S1). First, three groups were constructed comprising PDAC without NAC (n = 8, non-NAC), PDAC with NAC (n = 11, NAC), and control (n = 20) in the training samples to evaluate the effects of NAC on the metabolites identified in the previous section. Three groups are separated with minimal PLSR overlap (Fig. 3A). Intriguingly, clustered NAC plots located between those of the control and non-NAC imply that NAC brought about metabolic changes that rectify PDAC-specific profile to control (Fig. 3A). We prepared a heat map and identified three different PM and PL clusters, which reflected each serum's status to delineate each metabolite's differences more explicitly (Fig. 3B). On the one hand, cluster 1 is chiefly composed of PL, such as SM (36:4), PC (44:2), and LPC (22:0). Moreover, most of them were predominantly detected in control (Fig 3C). On the other hand, cluster 2 comprises PM (e.g., ornithine, glutamic acid) and PL, such as PE (38:5). They were mostly upregulated in PDAC serum regardless of NAC (Fig 3D). Therefore, the molecular expression belonging to cluster 2 may be an impregnation of PDAC to serum. Cluster 3 is strongly upregulated in non-NAC, witnessing the authentic PDAC state. Acetylcarnitine, arginine, and 4-aminobutyric acid are representative of cluster 3 (Fig 3E). Moreover, the NAC group's serum took a unique position, which shared the metabolic profiles of both control and PDAC. Currently, neither PM nor PL species, specific to the NAC samples, have been identified yet.
NAC treatment affected the metabolic profiles of the patients' serum. A Scatterplots of PLSR of PDAC without NAC (non-NAC), with NAC (NAC), and control by metabolome data. Pink, green, and blue plots indicate non-NAC, NAC, and control, respectively. Database with integrated 269 PM and PL were used. The variance of each principal component (Comp) is indicated on the ordinate and abscissa. B Heatmap showing the normalized ion intensity of significantly differed metabolites for each group. Metabolites with similar ion intensity patterns were arbitrarily assembled into three clusters. C-E Boxplots of metabolites significantly representing each cluster are shown. Ion intensity of each spectrum was normalized with median and autoscaling by MetaboAnalyst 5.0. PDAC pancreatic ductal adenocarcinoma, NAC neoadjuvant chemotherapy, PLSR partial least square regression, PM primary metabolites, PL phospholipids. Statistical significance was assigned *p < 0.05, **p < 0.01, and ***p <0.001.
Discussion
High-performance collective biomarker for PDAC prediction
This study addressed the issue crucial for PDAC diagnosis and evaluation of the effect of NAC. We evaluated the predictive power for machine learning-based diagnosis system of PDAC using a metabolite database from the Japanese cohort through ambient mass spectrometry. Technically, this is based on the ion intensities of the primary metabolites and phospholipids, which are annotated and quantified by LC/ESI-MS. The predictive power should be emphasized as the strongest when significantly differed metabolites, 15 PM and 21 PL, were confined into the database for machine learning rather than exhaustive registration of the whole data into the database. Furthermore, the predictive power of machine learning with the selected metabolites was superior to any single molecule. Therefore, the term collective biomarker refers to this molecule cluster. Higher performance in PDAC prediction by the collective biomarker was accomplished and was only applicable to PDAC-specific stages (T factors 2 and 3). Although the database is based on the training samples that largely include higher T (T3: 84%) and N (N > 0, 68%) factors with UICC stage II, the current system can also discriminate the validation of cancerous samples that mainly consist of the lower T and N factors (T2, 60%; N0, 60%) with the lower UICC stage IB. This strongly suggests that the current database harbours the PDAC nature and can be applied to the discrimination of the lower stages. Specifying and adding more candidate molecules for machine learning is needed to broaden the current system's applicability to PDAC diagnosis, in general.
Biochemical pathway altered in PDAC
Several metabolites that feature PDAC in Japanese cohorts were identified. While some phospholipids (e.g., LPC (18:2), PE (38:5), and SM (36:4)) have been previously reported as the PDAC-featuring metabolites [18, 37], a couple of newly identified specific metabolites in PDAC serum were added.
Ornithine, aspartic acid, glutamic acid, and arginine all belong to the arginine synthesis pathway, and are significantly increased in PDAC serum. Moreover, arginine is a critical amino acid for tumor cell growth. Therefore, depletion therapy is used for patients with PDAC [38, 39]. The ASS1 expression level, the rate-limiting enzyme of arginine, correlated well with the PDAC recurrence and patient survival [40]. Moreover, NAC-treated patients' pancreatic tissue showed an ASS1 downregulation [40], which is in line with the current study (Fig. 3E). However, future systematic studies are required to dissect the molecular mechanism.
Also, inosine and guanosine belong to the reduced metabolites in PDAC patients' blood [36, 41], consistent with the current result. The purine metabolic pathway activation is shared among various cancers, including PDAC. For example, the purine nucleoside phosphorylase expression, which metabolizes inosine and guanosine, is upregulated in PDAC [41-43]. However, PDAC's indirect effects on metabolites cannot be completely ruled out by taking the role of metabolic regulator into account. Heterogenity of intrinsic and extrinsic factors, such as dietary habits, circadian rhythms, and stress from disease, and slight differences in experimental procedures such as sample preparation and storage periods may somewhat affect metabolism. These concerns will be mitigated by large cohort studies in the future.
The superiority of LC/ESI-MS over PESI-MS
The diagnostic PDAC system was previously reported based on the whole collection of metabolites obtained by PESI-MS in a Taiwanese cohort [32]. Increasing the prediction rate in discriminating PDAC from the high-risk cohort was possible with clinical information inclusion (e.g., age and CA19-9). PESI-MS is an ambient ionization-based mass spectrometry method that surpasses the original electrospray ionization technique in its analysis rapidity and equipment simplicity. However, annotating each molecule was impossible due to technical limitations inherent to PESI-MS. Conversely, the LC/ESI-MS study successfully identified specific metabolites and demonstrated the potential for predicting PDAC at the expense of advantages unique to PESI-MS. By taking advantage of the results presented in this paper, a new version of the PESI system, the so-called PESI-MS/MS, still take over the advantage of PESI-MS as a simple diagnostic platform and additionally can identify specific molecule by collision-induced dissociation. Moreover, this retains higher throughput while achieves annotation of molecules with high accuracy. This system enables us to take two different pathways of application, namely for the clinical diagnosis on the basis of machine learning and for the basic research expertise through cutting in the specific molecular mechanisms. We will move this forward in near future.
Potential of this system in evaluating NAC
Currently, while only curative treatment for pancreatic cancer is surgical resection, NAC has been reported to improve the prognosis and therefore gained attention in clinical settings [44, 45]. However, it is not always the case that NAC is applicable to PDAC. The physical status and/or genetic or constitutional properties of patients, and non-effective cases were reported [46, 47]. With this in mind, predicting the effect of NAC during treatment is valuable. The current criteria in evaluating the effects of treatment rely on the serum level of CA19-9 or imaging modalities (e.g., MRCP and CT). However, none of them is sufficient to monitor the therapeutic effect of NAC accurately. Therefore, a simple and reproducible method for assessing the antitumor effect is awaited. This study found that several metabolites differed by NAC treatment. This suggests three possibilities. First, they directly reflect PDAC malignancy, and attenuated NAC figures indicate its effectiveness. Second, NAC may change the enzymatic activity of specific metabolic pathways. Third, fundamental conditions (e.g., genetic or constitutional factors) may be different between the untreated and treated NAC cases. It is also possible that inflammation and/or cell-death-related metabolites are released from cancer with NAC treatment. Neither PM nor PL species specific to the NAC samples have been identified at least in the current study. These metabolites may be below the MS detection, or ones that were not included in the method packages. Moreover, patient outcome by life-long follow-up will help understand the exact factor that plays a pivotal role in evaluating NAC's effectiveness. Thus, future studies on large cohorts will pave the way in determining those factors.
Abbreviations
PDAC: Pancreatic ductal adenocarcinoma; MS: Mass spectrometry; LC: Liquid chromatography; ESI: Electrospray ionization; PESI: Probe electrospray ionization; PLS: Partial least square; ROC: Receiver operating characteristic; AUC: Area under the ROC curve; PL: Phospholipid; PM: Primary metabolite; PC: Phosphatidylcholine; PE: Phosphatidylethanolamine; SM: Sphingomyelin; NAC: Neoadjuvant chemotherapy.
Supplementary Material
Supplementary figures and tables.
Acknowledgements
We thank Ayumi Manita, Masumi Tanzawa and Taeko Kozakai for their technical and secretarial assistance in this study.
Authors' contributions
Conceptualization, T.I., K.Y., and S.T.; methodology, K.Y., T.M. (Shimadzu Corp.), and K.O.; software, T.M. (Shimadzu Corp.) and K.O.; validation, T.I., K.Y., and S.T.; formal analysis, K.Y. and T.I.; investigation, T.I.; resources, G.W., R.S, S.K, H.K., T.M. (University of Yamanashi), D.I., J.A., K.H., T.M. (Shimadzu Corp.). and K.O.; data curation, T.I. and K.Y.; writing-original draft preparation, T.I.; writing-review and editing, T.I., K.Y., G.W., R.S, S.K, H.K., T.M. (University of Yamanashi), D.I., J.A., K.H., and S.T.; visualization, T.I.; supervision, S.T.; pro-ject administration, S.T.; funding acquisition, K.H. and S.T. All authors have read and agreed to the published version of the manuscript.
Ethics approval and consent to participate
The study was conducted according to the guidelines of the Declaration of Helsinki, and approved by the Ethics Committee of University of Yamanashi (nos. 2086 and 2220) or of University of Tokyo (no. 2019370NI).
Consent for publication
Informed consent was obtained from all subjects involved in the study.
Data availability
The data presented in this study are available from the corresponding author upon reasonable request.
Competing Interests
This research is not based on a previous communication to any societies or meetings. This work has been funded by Shimadzu corporation. The funder had no role in the design of the study; in the collection, analyses, or interpretation of data; in the writing of the manuscript, or in the decision to publish the results.
Funding information
This study is financially supported by Shimadzu Corporation (Kyoto, Japan) to K.H. and S.T.
References
1. Bray F, Ferlay J, Soerjomataram I, Siegel RL, Torre LA, Jemal A. Global cancer statistics 2018: GLOBOCAN estimates of incidence and mortality worldwide for 36 cancers in 185 countries. CA Cancer J Clin. 2018;68:394-424
2. Kleeff J, Korc M, Apte M, La Vecchia C, Johnson CD, Biankin AV. et al. Pancreatic cancer. Nat Rev Dis Primers. 2016;2:16022
3. Mizrahi JD, Surana R, Valle JW, Shroff RT. Pancreatic cancer. Lancet. 2020;395:2008-20
4. Goonetilleke KS, Siriwardena AK. Systematic review of carbohydrate antigen (CA 19-9) as a biochemical marker in the diagnosis of pancreatic cancer. Eur J Surg Oncol. 2007;33:266-70
5. Poruk KE, Gay DZ, Brown K, Mulvihill JD, Boucher KM, Scaife CL. et al. The clinical utility of CA 19-9 in pancreatic adenocarcinoma: diagnostic and prognostic updates. Curr Mol Med. 2013;13:340-51
6. Imaoka H, Sasaki M, Hashimoto Y, Watanabe K, Ikeda M. New Era of Endoscopic Ultrasound-Guided Tissue Acquisition: Next-Generation Sequencing by Endoscopic Ultrasound-Guided Sampling for Pancreatic Cancer. J Clin Med. 2019;8:1173
7. Elbanna KY, Jang HJ, Kim TK. Imaging diagnosis and staging of pancreatic ductal adenocarcinoma: a comprehensive review. Insights Imaging. 2020;11:58
8. Koay EJ, Amer AM, Baio FE, Ondari AO, Fleming JB. Toward stratification of patients with pancreatic cancer: Past lessons from traditional approaches and future applications with physical biomarkers. Cancer Lett. 2016;381:237-43
9. Welch DR. Tumor Heterogeneity-A 'Contemporary Concept' Founded on Historical Insights and Predictions. Cancer Res. 2016;76:4-6
10. Qi ZH, Xu HX, Zhang SR, Xu JZ, Li S, Gao HL. et al. The Significance of Liquid Biopsy in Pancreatic Cancer. J Cancer. 2018;9:3417-26
11. Mellby LD, Nyberg AP, Johansen JS, Wingren C, Nordestgaard BG, Bojesen SE. et al. Serum Biomarker Signature-Based Liquid Biopsy for Diagnosis of Early-Stage Pancreatic Cancer. J Clin Oncol. 2018;36:2887-94
12. Samandari M, Julia MG, Rice A, Chronopoulos A, Del Rio Hernandez AE. Liquid biopsies for management of pancreatic cancer. Transl Res. 2018;201:98-127
13. Bax C, Lotesoriere BJ, Sironi S, Capelli L. Review and Comparison of Cancer Biomarker Trends in Urine as a Basis for New Diagnostic Pathways. Cancers (Basel). 2019;11:1244
14. Debernardi S, O'Brien H, Algahmdi AS, Malats N, Stewart GD, Plješa-Ercegovac M. et al. A combination of urinary biomarker panel and PancRISK score for earlier detection of pancreatic cancer: A case-control study. PLoS Med. 2020;17:e1003489
15. Hou J, Li X, Xie KP. Coupled liquid biopsy and bioinformatics for pancreatic cancer early detection and precision prognostication. Mol Cancer. 2021;20:34
16. Zhou B, Xu JW, Cheng YG, Gao JY, Hu SY, Wang L. et al. Early detection of pancreatic cancer: Where are we now and where are we going? Int J Cancer. 2017;141:231-41
17. Pavlova NN, Thompson CB. The Emerging Hallmarks of Cancer Metabolism. Cell Metab. 2016;23:27-47
18. Ritchie SA, Akita H, Takemasa I, Eguchi H, Pastural E, Nagano H. et al. Metabolic system alterations in pancreatic cancer patient serum: potential for early detection. BMC Cancer. 2013;13:416
19. Shu X, Zheng W, Yu D, Li HL, Lan Q, Yang G. et al. Prospective metabolomics study identifies potential novel blood metabolites associated with pancreatic cancer risk. Int J Cancer. 2018;143:2161-7
20. Hirata Y, Kobayashi T, Nishiumi S, Yamanaka K, Nakagawa T, Fujigaki S. et al. Identification of highly sensitive biomarkers that can aid the early detection of pancreatic cancer using GC/MS/MS-based targeted metabolomics. Clin Chim Acta. 2017;468:98-104
21. Sakai A, Suzuki M, Kobayashi T, Nishiumi S, Yamanaka K, Hirata Y. et al. Pancreatic cancer screening using a multiplatform human serum metabolomics system. Biomark Med. 2016;10:577-86
22. Rho SY, Lee SG, Park M, Lee J, Lee SH, Hwang HK. et al. Developing a preoperative serum metabolome-based recurrence-predicting nomogram for patients with resected pancreatic ductal adenocarcinoma. Sci Rep. 2019;9:18634
23. Zhang X, Shi X, Lu X, Li Y, Zhan C, Akhtar ML. et al. Novel Metabolomics Serum Biomarkers for Pancreatic Ductal Adenocarcinoma by the Comparison of Pre-, Postoperative and Normal Samples. J Cancer. 2020;11:4641-51
24. Takeda S, Yoshimura K, Hiraoka K. Innovations in Analytical Oncology - Status quo of Mass Spectrometry-Based Diagnostics for Malignant Tumor. Journal of Analytical Oncology. 2012;1:74-80
25. Balog J, Sasi-Szabó L, Kinross J, Lewis MR, Muirhead LJ, Veselkov K. et al. Intraoperative tissue identification using rapid evaporative ionization mass spectrometry. Sci Transl Med. 2013;5:194ra93
26. Yoshimura K, Chen LC, Asakawa D, Hiraoka K, Takeda S. Physical properties of the probe electrospray ionization (PESI) needle applied to the biological samples. J Mass Spectrom. 2009;44:978-85
27. Takeda S, Yoshimura K, Tanihata H. Sample Preparation for Probe Electrospray Ionization Mass Spectrometry. J Vis Exp. 2020;156:e59942
28. Ashizawa K, Yoshimura K, Johno H, Inoue T, Katoh R, Funayama S. et al. Construction of mass spectra database and diagnosis algorithm for head and neck squamous cell carcinoma. Oral Oncol. 2017;75:111-9
29. Johno H, Yoshimura K, Mori Y, Kimura T, Niimi M, Yamada M. et al. Detection of potential new biomarkers of atherosclerosis by probe electrospray ionization mass spectrometry. Metabolomics. 2018;14:38
30. Ishii H, Saitoh M, Sakamoto K, Sakamoto K, Saigusa D, Kasai H. et al. Lipidome-based rapid diagnosis with machine learning for detection of TGF-β signalling activated area in head and neck cancer. Br J Cancer. 2020;122:995-1004
31. Iwano T, Yoshimura K, Inoue S, Odate T, Ogata K, Funatsu S. et al. Breast cancer diagnosis based on lipid profiling by probe electrospray ionization mass spectrometry. Br J Surg. 2020;107:632-5
32. Chung WY, Correa E, Yoshimura K, Chang MC, Dennison A, Takeda S. et al. Using probe electrospray ionization mass spectrometry and machine learning for detecting pancreatic cancer with high performance. Am J Transl Res. 2020;12:171-9
33. Xia J, Broadhurst DI, Wilson M, Wishart DS. Translational biomarker discovery in clinical metabolomics: an introductory tutorial. Metabolomics. 2013;9:280-99
34. Liebal UW, Phan ANT, Sudhakar M, Raman K, Blank LM. Machine Learning Applications for Mass Spectrometry-Based Metabolomics. Metabolites. 2020;10:243
35. Xiong Y, Shi C, Zhong F, Liu X, Yang P. LC-MS/MS and SWATH based serum metabolomics enables biomarker discovery in pancreatic cancer. Clin Chim Acta. 2020;506:214-21
36. Luo X, Liu J, Wang H, Lu H. Metabolomics identified new biomarkers for the precise diagnosis of pancreatic cancer and associated tissue metastasis. Pharmacol Res. 2020;156:104805
37. Mehta KY, Wu HJ, Menon SS, Fallah Y, Zhong X, Rizk N. et al. Metabolomic biomarkers of pancreatic cancer: a meta-analysis study. Oncotarget. 2017;8:68899-915
38. Albaugh VL, Pinzon-Guzman C, Barbul A. Arginine-Dual roles as an onconutrient and immunonutrient. J Surg Oncol. 2017;115:273-80
39. Delage B, Fennell DA, Nicholson L, McNeish I, Lemoine NR, Crook T. et al. Arginine deprivation and argininosuccinate synthetase expression in the treatment of cancer. Int J Cancer. 2010;126:2762-72
40. Liu Q, Stewart J, Wang H, Rashid A, Zhao J, Katz MH. et al. Reduced expression of argininosuccinate synthetase 1 has a negative prognostic impact in patients with pancreatic ductal adenocarcinoma. PLoS One. 2017;12:e0171985
41. Vareed SK, Bhat VB, Thompson C, Vasu VT, Fermin D, Choi H. et al. Metabolites of purine nucleoside phosphorylase (NP) in serum have the potential to delineate pancreatic adenocarcinoma. PLoS One. 2011;6:e17177
42. Yin J, Ren W, Huang X, Deng J, Li T, Yin Y. Potential Mechanisms Connecting Purine Metabolism and Cancer Therapy. Front Immunol. 2018;9:1697
43. Agarwal S, Chakravarthi B, Kim HG, Gupta N, Hale K, Balasubramanya SAH. et al. PAICS, a De Novo Purine Biosynthetic Enzyme, Is Overexpressed in Pancreatic Cancer and Is Involved in Its Progression. Transl Oncol. 2020;13:100776
44. Okano K, Suto H, Oshima M, Maeda E, Yamamoto N, Kakinoki K. et al. A Prospective Phase II Trial of Neoadjuvant S-1 with Concurrent Hypofractionated Radiotherapy in Patients with Resectable and Borderline Resectable Pancreatic Ductal Adenocarcinoma. Ann Surg Oncol. 2017;24:2777-84
45. Motoi F, Kosuge T, Ueno H, Yamaue H, Satoi S, Sho M. et al. Randomized phase II/III trial of neoadjuvant chemotherapy with gemcitabine and S-1 versus upfront surgery for resectable pancreatic cancer (Prep-02/JSAP05). Jpn J Clin Oncol. 2019;49:190-4
46. Sho M, Akahori T, Tanaka T, Kinoshita S, Nagai M, Tamamoto T. et al. Importance of resectability status in neoadjuvant treatment for pancreatic cancer. J Hepatobiliary Pancreat Sci. 2015;22:563-70
47. Fujii T, Satoi S, Yamada S, Murotani K, Yanagimoto H, Takami H. et al. Clinical benefits of neoadjuvant chemoradiotherapy for adenocarcinoma of the pancreatic head: an observational study using inverse probability of treatment weighting. J Gastroenterol. 2017;52:81-93
Author contact
![]() Corresponding author: Sen Takeda: stakeda-nsac.jp, TEL: +81-55-273-9471, FAX: +81-55-273-9473
Corresponding author: Sen Takeda: stakeda-nsac.jp, TEL: +81-55-273-9471, FAX: +81-55-273-9473