Impact Factor ISSN: 1837-9664

 Global reach, higher impact
J Cancer 2020; 11(20):6101-6113. doi:10.7150/jca.46902 This issue Cite
Research Paper
Carbonic Anhydrase 4 serves as a Clinicopathological Biomarker for Outcomes and Immune Infiltration in Renal Cell Carcinoma, Lower Grade Glioma, Lung Adenocarcinoma and Uveal Melanoma
Yue Xu1,2*, Wen-Hao Xu3,5*, Shen-Nan Shi4,5*, Xiao-Long Yang1,2, Ya-Ru Ren1,2, Xin-Yu Zhuang1,2, Yuan-Yuan Qu3,5, Hai-Liang Zhang3,5 ![]() , Xiao-Feng Zhang1,2
, Xiao-Feng Zhang1,2 ![]()
1. Department of Ophthalmology, First Affiliated Hospital of Soochow University, Suzhou, 215000, China
2. Medical College, Soochow University, Suzhou, 215000, China
3. Department of Urology, Fudan University Shanghai Cancer Center, Shanghai 200032, China
4. Cancer Institute, Fudan University Shanghai Cancer Center, Shanghai 200032, China
5. Department of Oncology, Shanghai Medical College, Fudan University, Shanghai 20032, China
*Equal contribution
Received 2020-4-11; Accepted 2020-7-26; Published 2020-8-25
Abstract
Background: Carbonic anhydrase 4 (CA4) maintains homeostasis of carbon dioxide and bicarbonate. It is suggested to be a potential prognostic biomarker, while the correlations between CA4 and different cancers are indistinct.
Methods: Differential mRNA expression of CA4 among different cancers and corresponding normal tissues was compared based on datasets on the Cancer Genome Atlas (TCGA) platforms. Then, survival analysis was performed using Tumor-immune system interactionsplatform and TCGA cohort on the basis of distinct comparison expression of CA4 in five kinds of tumors. In addition, molecular penal analysis and functional annotations of CA4-related genes was elaborated. The correlation between CA4 mRNA expression and tumor immune microenvironment were analyzed in detail.
Results: Compared with adjacent normal tissues, CA4 mRNA expressions were found significantly lower in various tumors. Moreover, decreased expression of CA4 was significantly related to worse overall survival (OS) and progression-free survival (PFS) in kidney renal clear cell carcinoma (KIRC), brain lower grade glioma (LGG), lung adenocarcinoma (LUAD) and uveal melanoma (UVM), and worse OS of prostate adenocarcinoma (PRAD) (p<0.05). Cox regression analyses indicated that CA4 was a significant prognostic biomarker in KIRC, LGG, LUAD and UVM. Moreover, CA4 showed markedly relationship with tumor immune environment and diverse immune infiltration signatures in KIRC, LGG, LUAD and UVM.
Conclusions: Our study revealed that CA4 was a potential biomarker for aggressive progression and poor prognosis in KIRC, LGG, LUAD, PRAD and UVM, correlated with immune infiltration in various tumor environments. These results suggested that CA4 possibly served as a promising prognostic and immune infiltration biomarker in many cancers.
Keywords: carbonic anhydrase 4, tumor immune microenvironment, prognosis, immune infiltration, biomarker
Introduction
Tumor microenvironment consists of immune cells, surrounding blood vessels, signaling molecules, fibroblasts and extracellular matrix 1. Tumor immune microenvironment (TIME) is tightly associated with location, density and organization of immune cells and cytokines in diverse tumors 2. The existence of antitumor environment represented by Th1 helper cells, CD8+ cytotoxic T cells and correlated cytokines usually implies the extent of TIME and even leads to the elimination of tumors 3. Infiltrating immune cells were highly relevant to heterogeneity of tumor cells in different parts of immunotherapy efficacy 4. The heterogeneity of tumors results in cells secreting distinct molecular markers with diverse levels of sensitivity to treatment 5. Immunotherapeutic therapies were also utilized in many cancers, such as skin melanoma (SKCM), kidney renal clear cell carcinoma (KIRC) and non-small cell lung cancer (NCSLC) 6. Immune checkpoint blockade and targeted therapy has achieved great breakthroughs in melanoma treatment 7. Interleukin 2, immune checkpoint inhibitors and interferon alfa have been applied in KIRC treatment guidelines 8. The outcomes of lung cancer patients are influenced by TIME which balances the suppressive factors and cytotoxic responses 9. Notably, the mechanisms by which tumors evolve to remove host defenses and evade immune control vary from cancer to cancer, and special markers of different tumors are reflected in its microenvironment 10. Therefore, it is of great importance to know the molecular interactions and biomarkers in TIME and may provide novel targets for immune therapies in these tumors.
Carbonic anhydrases (CAs) are zinc metalloenzymes, involved in various biological processes, including tumorigenicity, lipogenesis, gluconeogenesis, ureagenesis and development and toxicity of different pathogens 11. CAs catalyze the fundamental reaction for life, which is the interconversion of water and carbon dioxide into dissociated ions of carbonic acid 12,13. The 14 human isozymes of CAs are up-regulated and down-regulated from gene levels in diverse dysfunctions or diseases, which promotes CAs to be considered as disease biomarkers 14. Representatively, CA9 is a uniformly induced gene as a reliable biomarker of hypoxia and worse prognosis in tumors, such as prostate and renal cancer 15,16. The higher expression of CA12 was proved to be a marker of better prognosis in NCSLC 17 and breast cancer 18. Moreover, the invasion of renal carcinoma cells was suggested to be restrained by inhibiting CA12 19.
Among the membrane-associated CA isoforms, CA4 is anchored by glycosylphosphatidylinositol linkage and the most widely distributed 20. CA4 was found important in bicarbonate reabsorption of kidney 21. It also maintains homeostasis of carbon dioxide and bicarbonate in brain, catalyzes the carbon dioxide exchange and regulates local pH in lung 22. CA4 was suggested to be a biomarker of diagnosis, progression or immune microenvironment in the following diseases. The disruption of CA4 may be associated with the perturbation of pH homeostasis in retina and correlated with retinitis pigmentosa 23. In addition, CA4 markedly inhibited capacity of invasion and migration in colon cancer cells 24. Interestingly, CA4 was recently reported as an up-regulated differential expressed gene to participate in the TIME of KIRC 24.
In present study, we explored prognostic significance of CA4 among pan-cancers. Functional annotations and immune infiltration correlation were also investigated between CA4 and related cancers. TIME correlated with CA4 was displayed to uncover the underlying molecular mechanisms in these cancers.
Materials and Methods
Ethics statement
Study procedures were approved by First Affiliated Hospital of Soochow University (Suzhou, China) included in this research (ID: 2019-076). Written informed consents were acquired from online open-access databases.
Oncomine database
The transcriptional expression of CA4 in diverse cancers was obtained from Oncomine database (https://www.oncomine.org) 25. The threshold was set as follows: p-value = 0.0001, fold change = 2, gene rank = 10%, data type: mRNA. Differences of CA4 mRNA expression in different cancers and adjacent normal tissues were analyzed by Student's t test (**p < 0.01, ***p < 0.001).
Patients and transcriptional expression profile
Available RNA-sequence data of a total of 533 KIRC patients, 530 brain lower grade glioma (LGG) patients, 517 lung adenocarcinoma (LUAD) patients, 498 prostate adenocarcinoma (PRAD) patients and 80 uveal melanoma (UVM) patients were consecutively acquired from the Cancer Genome Atlas (TCGA) database 26. Illumina HiSeq 2000 RNA Sequencing platform was utilized to experimentally measure the gene expression profiles by University of North Carolina TCGA genome characterization center. ESTIMATE algorithm was utilized for visualizing stromal and immune scores by "estimate" R package (http://r-forge.r-project.org; dependencies=TRUE, repos=rforge). Participants in each kind of tumors were divided into two groups by X-tile software, which figured out the cut-off value of CA4 mRNA expression 27.
Statistical analysis
Survival analyses between high and low CA4 mRNA expression groups were performed in KIRC, LGG, LUAD, PRAD and UVM patients. Progression-free survival (PFS), the primary endpoint for patients, is the duration between the first treatment and the date of progression or death or second-line treatment. Overall survival (OS), the secondary endpoint, is the duration between first diagnosis or treatment and the last follow-up or death. Log-rank test in separate curves and Kaplan-Meier method with 95% confidence intervals (95%CI) were utilized to performing the follow-up duration analysis. To further find significant independent variables of these cancers, univariate and multivariate Cox regression analyses were performed. Phenotype and expression profiles of CA4 among KIRC, LGG, LUAD and UVM patients were downloaded and illustrated from TCGA database. All analyses were performed in the R (Version 3.6.0), RStudio (Version 1.2.1335), IBM SPSS Statistics 25 and GraphPad Prism 8. Two-sided and p-values less than 0.05 were taken as significant in all tests.
Protein-protein interaction (PPI) network construction
PPI network of CA4 and co-expression genes was constructed in three methods in this study. First, GeneMANIA (http://www.genemania.org) was utilized for generating hypotheses about gene functions 28. Consequently, GeneMANIA was used to find functionally similar genes with CA4 and institute a gene-gene interaction network for them on the basis of physical interactions, co-expression, predicted, co-localization, pathway, genetic interactions and shared protein domains in this study. Second, Search Tool for the Retrieval of Interacting Genes (STRING; http://string-db.org) (version 11.0) is utilized to predict PPI network between CA4 and its co-expression genes and visualizes the functional interactions among them 29. The combined scores of the interactions greater than 0.4 were considered statistically significant. Third, PPI network of CA4 and co-expression genes were also constructed in terms of lncRNA and PPI by R software (version 3.3.2).
Functional annotations and molecular penal analysis
Cytoscape (version 3.6.1) is an bioinformatics software platform, which is utilized to illustrate molecular interaction network 30. ClueGO (version 2.5.4) and CluePedia (version 1.5.4) are Cytoscape plug-ins used to visualize the non-redundant biological terminology for gene modules in functional grouping networks 31,32. Gene ontology (GO), including biological process (BP), cellular component (CC) and molecular function (MF), and Kyoto Encyclopedia of Genes and Genomes (KEGG) pathways analyses for CA4 and its co-expression genes identified in STRING were illustrated and visualized by ClueGO and CluePedia. Transcription factor regulation network was predicted using R software. Significant nodes were colored in red in line with CA4.
Tumor immune interactions analysis
Tumor-immune system interactions (TISIDB; http://cis.hku.hk/TISIDB) is an repository portal to integrate multiple resources for immunological results obtained according to seven public databases 33. Interactions between immunologic system and tumor among twenty-eight tumor infiltrating lymphocytes (TILs) in 30 kinds of human cancers were investigated in this study. The associations between CA4 expression and OS across human cancers were calculated by TISIDB using log rank test (-log10(p-value)).
We further calculated the relations between immune score and CA4 mRNA expression in patients with different cancers. Scatter plots were calculated using Pearson's correlation and statistical significance. The result with the criteria (p-value < 0.05 and |Pearson's r| > 0.2) was considered to have significant correlation between CA4 expression and immune score in each kind of cancers.
Correlations of CA4 and immune cell signatures infiltrations
Tumor Immune Estimation Resource (TIMER, https://cistrome.shinyapps.io/timer/) database contains 10,897 subjects among thirty-two cancers from TCGA for estimating various immune infiltrations 34. TIMER is utilized to analyze relationships between CA4 expression and immune infiltration levels. Spearman's correlation was statistically calculated to generate scatter plots. Moreover, correlation analysis was used to illustrate relationships between CA4 and gene markers of diverse tumor-infiltrating immune cells. The result with the criteria (p-value < 0.05 and |Pearson's r| > 0.2) was considered to have significant correlation between them.
Correlation analysis between CA4 and gene markers of immune cells in both TIMER and Gene Expression Profiling Interactive Analysis (GEPIA) (http://gepia.cancer-pku.cn/index.html). Spearman's correlation analysis was performed for CA4 and gene markers of diverse tumor-infiltrating immune cells. The result with the criteria (p-value < 0.05 and |Pearson's r| > 0.4) was considered to have significant correlation between them.
CA4 expression in KIRC and normal samples
CA4 protein expression, coded by CA4 gene, was detected in KIRC and normal samples from the human protein atlas (https://www.proteinatlas.org/) and immunohistochemistry (IHC) data, including staining quantity, intensity, location and patients' data was available online. Formalin-fixed, paraffin-embedded KIRC tissues and human renal tissues were stained for anti-CA4 using ab236315 (Abcam, USA) at 1/3000 dilution in Fudan University Shanghai Cancer Center (FUSCC) cohort, and then independently evaluated by two experienced pathologists. The overall IHC score ranging from 0 to 12 was measured based on the multiply of the staining intensity and extent score, as previously described. Low CA4 expression group scores from 0 to 2, and high CA4 group scores from 3 to 12.
Results
This study is composed of three stages. First and foremost, we compared mRNA expression of CA4 between different tumors and corresponding normal tissues according to datasets hosted on TCGA platforms; then, survival analysis was performed using TISIDB platform and TCGA cohort on the basis of distinct comparison expression of CA4 in five kinds of tumors; finally, molecular penal analysis and functional annotations of CA4-related genes was elaborated and correlations between CA4 mRNA expression and TIME were analyzed in detail.
Expression levels of CA4 in various human cancers and paired normal tissues
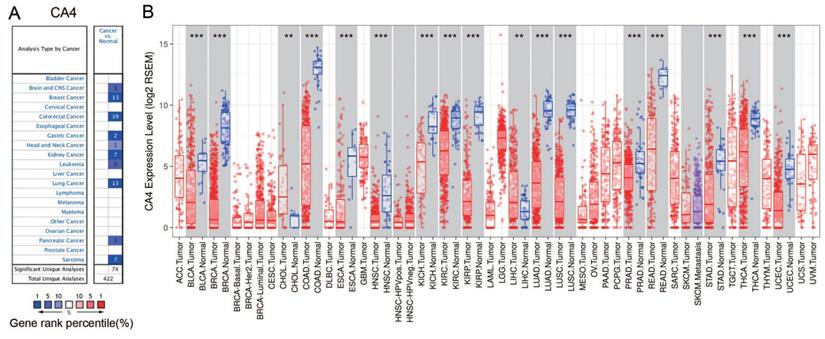
The differential mRNA expression of CA4 in various human cancers and paired normal tissues were compared on the basis of datasets released from the Oncomine and TIMER platform. Decreased CA4 mRNA expressions were found in datasets of brain and CNS cancer, breast cancer, colorectal cancer, gastric cancer, head and neck cancer, kidney cancer, leukemia cancer, lung cancer, pancreatic cancer and sarcoma compared to normal tissues from Oncomine database (Figure 1A). Moreover, relative CA4 mRNA expression levels between different cancers and corresponding normal tissues were determined based on TCGA database using Student's t test (Figure 1B). CA4 mRNA expressions were found significantly lower in bladder urothelial carcinoma (BLCA), breast invasive carcinoma (BRCA), colon adenocarcinoma (COAD), esophageal carcinoma (ESCA), head and neck squamous cell carcinoma (HNSC), kidney chromophobe (KICH), KIRC, kidney renal papillary cell carcinoma (KIRP), LUAD, lung squamous cell carcinoma (LUSC), PRAD, rectum adenocarcinoma (READ), stomach adenocarcinoma (STAD), thyroid carcinoma (THCA) and uterine corpus endometrial carcinoma (UCEC) compared to the corresponding normal tissues. Nevertheless, CA4 mRNA expressions were found significantly higher in cholangiocarcinoma (CHOL) and liver hepatocellular carcinoma (LIHC) compared to the corresponding normal tissues (**p < 0.01, ***p < 0.001).
CA4 expression levels in different types of human cancers and paired normal tissues. (A) Decreased CA4 in datasets of different types of cancers compared with normal tissues from Oncomine database. (B) Relative CA4 mRNA expression levels in different cancers and adjacent normal tissues were determined from TCGA database using Student's t test (**p < 0.01, ***p < 0.001). TCGA, the cancer genome atlas.
Prognostic value of CA4 in different cancers and Cox regression analyses of TCGA cohorts
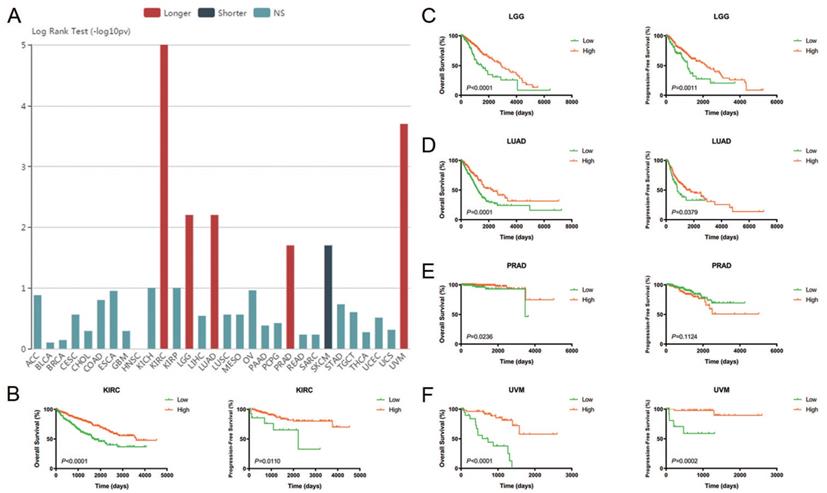
The relationships between CA4 mRNA expression and prognosis of cancer patients were investigated. Prognostic implication of CA4 in 30 different tumors from TCGA database using log rank test (-log10(p-value)) (Figure 2A). Notably, increased expression of CA4 significantly correlated with better OS in KIRC, LGG, LUAD, PRAD and UVM, while worse OS in SKCM. Survival analysis of CA4 was further performed in KIRC, LGG, LUAD, PRAD and UVM from TCGA database using Kaplan-Meier methods. Decreased expression of CA4 was significantly related to worse OS and PFS in KIRC, LGG, LUAD and UVM, and worse OS of PRAD (p < 0.05) (Figure 2B-F).
Prognostic value of CA4 in different cancers and its significant survival benefits in KIRC, LGG, LUAD, PRAD and UVM. (A) Prognostic implication of CA4 in 30 different tumors from TCGA database using log rank test (-log10(p-value)). (B-F) Survival analysis of CA4 was performed in KIRC, LGG, LUAD, PRAD and UVM from TCGA database using Kaplan-Meier methods. Decreased expression of CA4 significantly correlated with worse OS and PFS in KIRC, LGG, LUAD and UVM, and worse OS of PRAD. KIRC, kidney renal clear cell carcinoma; LGG, brain lower grade glioma; LUAD, lung adenocarcinoma; PRAD, prostate adenocarcinoma; UVM, uveal melanoma; TCGA, the cancer genome atlas; OS, overall survival; PFS, progression-free survival.
Subsequently, Cox regression analyses were performed in KIRC, LGG, LUAD and UVM in TCGA cohorts. Depending on univariate Cox regression analysis models, pT stage, pM stage, AJCC stage and ISUP grade significantly correlated to both PFS and OS in KIRC patients. Gender was significantly relevant to PFS while age and pN stage significantly correlated to OS in KIRC patients (p < 0.05; Supplementary Figure 1A-B). Depending on univariate Cox regression analysis models, age and neoplasm grade significantly correlated to both PFS and OS and histological type significantly correlated to OS in LGG patients (p < 0.05; Supplementary Figure 1C-D). Depending on univariate Cox regression analysis models, pT stage, pN stage and AJCC stage significantly correlated to both PFS and OS and pM stage significantly correlated to OS in LUAD patients (p < 0.05; Supplementary Figure 1E-F). Depending on univariate Cox regression analysis models, cell type was significantly relevant to both PFS and OS in UVM patients. Meanwhile, age and tumor basal diameter significantly correlated to OS in UVM patients (p < 0.05; Supplementary Figure 1G-H). Remarkably, CA4 amplification was obviously related to better PFS (KIRC: hazard ratio [HR] = 0.661, p < 0.001; LGG: HR = 0.552, p = 0.002; LUAD: HR = 0.922, p = 0.020; UVM: HR = 0.454, p = 0.001) and better OS (KIRC: HR = 0.847, p < 0.001; LGG: HR = 0.552, p < 0.001; LUAD: HR = 0.918, p = 0.007; UVM: HR = 0.454, p < 0.001) in all of these four cancers.
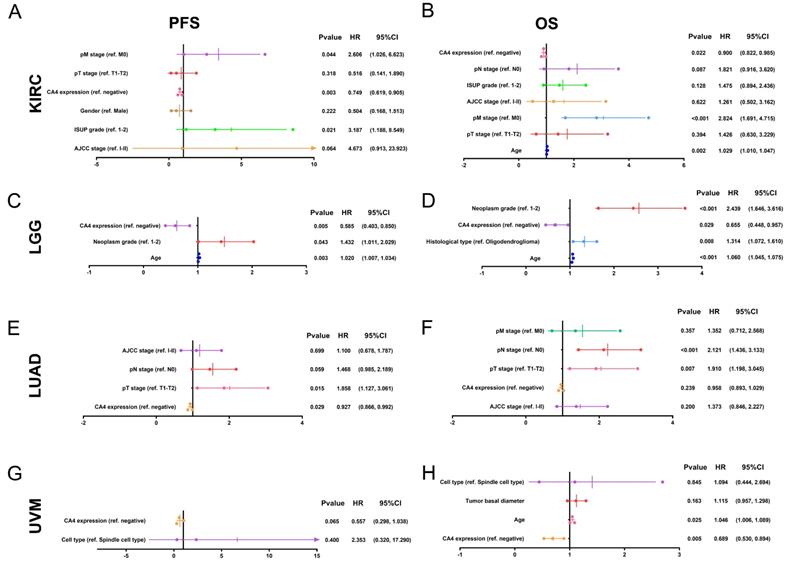
In multivariate Cox regression analysis models, pM stage was still significantly relevant to both PFS and OS in KIRC patients. Meanwhile, ISUP grade and age were significantly relevant to PFS or OS in KIRC patients, respectively (p < 0.05; Figure 3A-B). In multivariate Cox regression models, age and neoplasm grade were still significantly relevant to both PFS and OS in LGG patients. Meanwhile, histological type significantly correlated to OS in LGG patients (p < 0.05; Figure 3C-D). In multivariate Cox regression models, pT stage was still significantly relevant to both PFS and OS and pN stage was significantly relevant to OS in LUAD patients (p < 0.05; Figure 3E-F). In multivariate Cox regression models, age was still significantly relevant to OS in UVM patients (p < 0.05; Figure 3G-H). Notably, CA4 amplification obviously correlated with better PFS in KIRC, LGG and LUAD (KIRC: HR = 0.749, p = 0.003; LGG: HR = 0.585, p = 0.005; LUAD: HR = 0.927, p = 0.029) and better OS in KIRC, LGG and UVM (KIRC: HR = 0.900, p = 0.022; LGG: HR = 0.655, p = 0.029; UVM: HR = 0.689, p = 0.005).
Multivariate Cox regression analysis of PFS and OS of CA4 in KIRC, LGG, LUAD and UVM patients from TCGA cohort. (A-B) pM stage was significantly relevant to both PFS and OS in KIRC patients. Meanwhile, ISUP grade and age were significantly relevant to PFS or OS in KIRC patients, respectively (p < 0.05). (C-D) Age and neoplasm grade were significantly relevant to both PFS and OS in LGG patients. Meanwhile, histological type significantly correlated to OS in LGG patients (p < 0.05). (E-F) pT stage was significantly relevant to both PFS and OS and pN stage was significantly relevant to OS in LUAD patients (p < 0.05). (G-H) Age was significantly relevant to OS in UVM patients (p < 0.05). Notably, CA4 amplification obviously correlated with better PFS in KIRC, LGG and LUAD (KIRC: HR = 0.749, p = 0.003; LGG: HR = 0.585, p = 0.005; LUAD: HR = 0.927, p = 0.029) and better OS in KIRC, LGG and UVM (KIRC: HR = 0.900, p = 0.022; LGG: HR = 0.655, p = 0.029; UVM: HR = 0.689, p = 0.005). PFS, progression-free survival; OS, overall survival; KIRC, kidney renal clear cell carcinoma; LGG, brain lower grade glioma; LUAD, lung adenocarcinoma; UVM, uveal melanoma; TCGA, the cancer genome atlas.
Molecular panel analysis and functional annotations of CA4-related genes
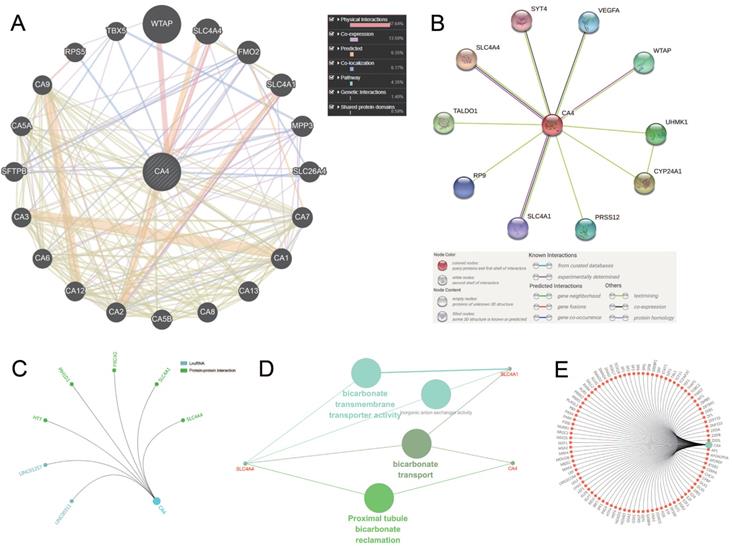
We use three methods to identify the co-expression network of CA4. Gene-gene interaction of CA4 and related genes was constructed using GeneMANIA database (Figure 4A). CA4 was surrounded by 20 nodes which represented closely related genes in terms of physical interactions (67.64%), co-expression (13.50%), predicted (6.35%), co-localization (6.17%), pathway (4.35%), genetic interactions (1.40%) and shared protein domains (0.59%). The size of the nodes represents the strength of interactions. Different line colors represent different types of gene-gene interactions. In addition, PPI network between CA4 and co-expression genes was illustrated using STRING (Figure 4B). Different line colors represent different types of protein-protein interactions. Meanwhile, PPI network was constructed in CA4 using R software. Then mark significant nodes with diverse colors in line with CA4 (LncRNA and PPI) (Figure 4C). Importantly, Solute carrier family 4 member 1 (SLC4A1) and Solute carrier family 4 member 4 (SLC4A4) were identified by these three methods. WT1 associated protein (WTAP) was identified by both GeneMINIA and STRING. Functional annotations indicated the changes in biological processes of CA4 significantly correlated with bicarbonate transmembrane transporter activity, bicarbonate transport and proximal tubule bicarbonate reclamation using ClueGO (Figure 4D). Transcription factor network was predicted in Figure 4E. Significant nodes were marked in red in line with CA4.
Molecular penal ananlysis and functional annotations of CA4-related genes. (A) Gene-gene interaction of CA4 and related genes. The size of the nodes represents the strength of interactions. Different line colors represent different types of gene-gene interactions. (B) PPI network of CA4 and its co-expression genes was constructed visually. Different line colors represent different types of protein-protein interactions. (C) PPI network was constructed in CA4. Significant nodes were marked in different colors in line with CA4 (LncRNA and PPI). (D) Functional annotations indicated the changes in biological processes of CA4 significantly correlated with bicarbonate transmembrane transporter activity, bicarbonate transport and proximal tubule bicarbonate reclamation using ClueGO. (E) Transcription factor network was predicted. Significant nodes were marked in red in line with CA4. PPI, Protein-protein interaction.
Role of CA4 in different TIMEs
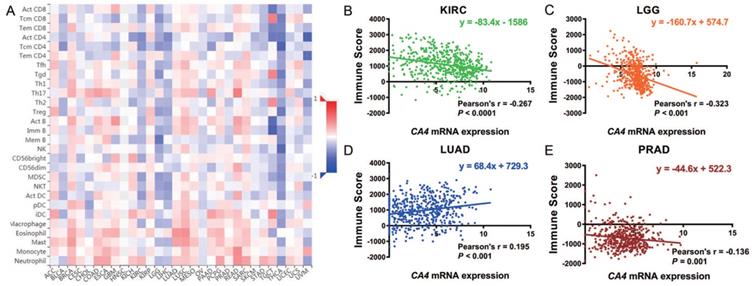
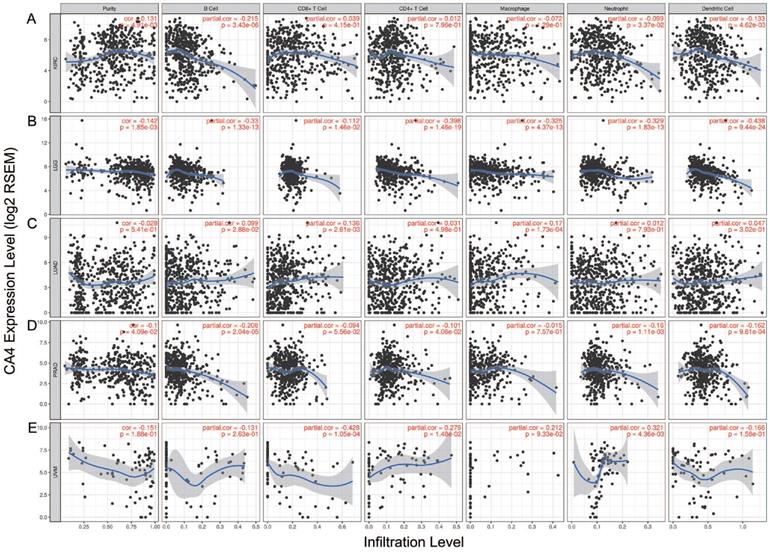
We further explored the different TIMEs of CA4 in 30 kinds of tumors and calculated the immune scores correlated with CA4 in KIRC, LGG, LUAD and PRAD. Relations between CA4 expression and the abundance of TILs in different tumors were performed in heat map (Figure 5A). Additionally, relations between immune scores and CA4 mRNA expression in KIRC, LGG, LUAD and PRAD were performed (Figure 5B-E). Scatter plots were calculated using Pearson's correlation and statistical significance. CA4 was obviously correlated with immune score in KIRC and LGG (|Pearson's r| > 0.2). Immune infiltration levels of CA4 in KIRC, LGG, LUAD, PRAD and UVM were performed using TIMER, respectively (Figure 6). Partial Spearman's correlation and statistical significance were calculated for generating scatter plots. CA4 expression levels significantly correlated to B cell infiltration in KIRC, B cell, CD4+ T cell, macrophage, neutrophil and dendritic cell infiltration in LGG, B cell infiltration in PRAD, CD8+ T cell, CD4+ T cell and neutrophil infiltration in UVM (|partial.cor| > 0.2 and p<0.05). Spearman's correlation and estimated statistical significance between CA4 expression and related genes and markers of immune cells were displayed among KIRC, LGG, LUAD and UVM using TIMER (Table 1) and GEPIA (Table 2), respectively. Important markers of various immune cells were illustrated at great length, including CD8+ T cell, T cell (general), B cell, monocyte, tumor-associated macrophage (TAM), M1 macrophage, M2 macrophage, neutrophils, natural killer cell, dendritic cell, T helper cell 1, T helper cell 2, Follicular helper T cell, T helper cell 17, regulatory T cell, T cell exhaustion (*p < 0.05, **p < 0.01, ***p < 0.001, ****p < 0.0001).
Role of CA4 in different tumor immune microenvironments. (A) Relations between CA4 expression and the abundance of TILs in different tumors. (B-E) Relations between immune score and CA4 mRNA expression in KIRC, LGG, LUAD and PRAD were performed. Scatter plots were calculated using Pearson's correlation and statistical significance. CA4 was obviously correlated with immune score in KIRC and LGG (|Pearson's r| > 0.2). TILs, tumor infiltrating lymphocytes; KIRC, kidney renal clear cell carcinoma; LGG, brain lower grade glioma; LUAD, lung adenocarcinoma; PRAD, prostate adenocarcinoma.
Immune infiltration of CA4 in five cancers using TIMER. Correlation analysis between CA4 and immune infiltration levels in KIRC (A), LGG (B), LUAD (C), PRAD (D) and UVM (E) was performed. Spearman's correlation and statistical significance were performed to generate scatter plots. TIMER, Tumor Immune Estimation Resource; KIRC, kidney renal clear cell carcinoma; LGG, brain lower grade glioma; LUAD, lung adenocarcinoma; PRAD, prostate adenocarcinoma; UVM, uveal melanoma.
Correlation analysis between CA4 and related genes and markers of immune cells in TIMER.
| Description | Gene markers | KIRC | LGG | LUAD | UVM | |||||||||||||||||||
|---|---|---|---|---|---|---|---|---|---|---|---|---|---|---|---|---|---|---|---|---|---|---|---|---|
| None | Purity | None | Purity | None | Purity | None | Purity | |||||||||||||||||
| Cor | P | Cor | P | Cor | P | Cor | P | Cor | P | Cor | P | Cor | P | Cor | P | |||||||||
| CD8+ T cell | CD8A | -0.253 | **** | -0.249 | **** | 0.149 | *** | 0.116 | * | 0.094 | * | 0.094 | * | -0.303 | ** | -0.256 | * | |||||||
| CD8B | -0.201 | **** | -0.191 | **** | 0.175 | **** | 0.131 | ** | 0.06 | 0.171 | 0.059 | 0.195 | -0.33 | ** | -0.277 | * | ||||||||
| T cell (general) | CD3D | -0.258 | **** | -0.241 | **** | -0.178 | **** | -0.218 | **** | 0.054 | 0.222 | 0.038 | 0.397 | -0.34 | ** | -0.298 | ** | |||||||
| CD3E | -0.261 | **** | -0.242 | **** | -0.19 | **** | -0.22 | **** | 0.102 | * | 0.104 | * | -0.238 | * | -0.192 | 0.0935 | ||||||||
| CD2 | -0.274 | **** | -0.256 | **** | -0.212 | **** | -0.239 | **** | 0.105 | * | 0.105 | * | -0.321 | ** | -0.275 | * | ||||||||
| B cell | CD19 | -0.27 | **** | -0.243 | **** | -0.125 | ** | -0.13 | ** | 0.073 | 0.0983 | 0.056 | 0.214 | -0.038 | 0.738 | -0.017 | 0.88 | |||||||
| CD79A | -0.267 | **** | -0.262 | **** | -0.269 | **** | -0.308 | **** | 0.001 | 0.89 | -0.024 | 0.6 | 0.075 | 0.506 | 0.081 | 0.486 | ||||||||
| Monocyte | CD86 | -0.338 | **** | -0.34 | **** | -0.316 | **** | -0.395 | **** | 0.017 | 0.703 | 0.003 | 0.942 | -0.34 | ** | -0.308 | ** | |||||||
| CD115 (CSF1R) | -0.241 | **** | -0.224 | **** | -0.264 | **** | -0.353 | **** | 0.036 | 0.414 | 0.031 | 0.491 | -0.135 | 0.232 | -0.126 | 0.274 | ||||||||
| TAM | CCL2 | 0.218 | **** | 0.256 | **** | -0.3 | **** | -0.327 | **** | -0.063 | 0.156 | -0.084 | 0.0617 | 0.187 | 0.095 | 0.22 | 0.0548 | |||||||
| CD68 | -0.339 | **** | -0.367 | **** | -0.355 | **** | -0.412 | **** | 0.153 | *** | 0.152 | *** | 0.16 | 0.157 | 0.215 | 0.0603 | ||||||||
| IL10 | -0.215 | **** | -0.197 | **** | -0.364 | **** | -0.4 | **** | 0.151 | *** | 0.147 | ** | -0.136 | 0.229 | -0.104 | 0.368 | ||||||||
| M1 Macrophage | INOS (NOS2) | 0.354 | **** | 0.374 | **** | 0.257 | **** | 0.241 | **** | 0.267 | **** | 0.275 | **** | 0.098 | 0.388 | 0.143 | 0.215 | |||||||
| IRF5 | -0.298 | **** | -0.305 | **** | -0.25 | **** | -0.332 | **** | 0.036 | 0.41 | 0.027 | 0.547 | -0.3 | ** | -0.249 | * | ||||||||
| COX2 (PTGS2) | -0.051 | 0.24 | 0.005 | 0.923 | 0.032 | 0.469 | 0.007 | 0.871 | -0.112 | * | -0.101 | * | -0.445 | **** | -0.426 | *** | ||||||||
| M2 Macrophage | CD163 | -0.18 | **** | -0.19 | **** | -0.398 | **** | -0.398 | **** | 0.138 | ** | 0.141 | ** | -0.213 | 0.0581 | -0.19 | 0.098 | |||||||
| VSIG4 | -0.262 | **** | -0.262 | **** | -0.366 | **** | -0.418 | **** | 0.145 | *** | 0.135 | ** | -0.215 | 0.0557 | -0.198 | 0.0842 | ||||||||
| MS4A4A | -0.233 | **** | -0.223 | **** | -0.347 | **** | -0.371 | **** | 0.155 | *** | 0.154 | *** | -0.151 | 0.182 | -0.121 | 0.296 | ||||||||
| Neutrophils | CD66b (CEACAM8) | 0.093 | * | 0.095 | * | -0.056 | 0.204 | -0.045 | 0.332 | 0.212 | **** | 0.209 | **** | NA | NA | NA | NA | |||||||
| CD11b (ITGAM) | -0.273 | **** | -0.271 | **** | -0.282 | **** | -0.373 | **** | 0.039 | 0.374 | 0.026 | 0.558 | 0.057 | 0.617 | 0.063 | 0.585 | ||||||||
| CCR7 | -0.208 | **** | -0.199 | **** | -0.134 | ** | -0.16 | *** | 0.182 | **** | 0.192 | **** | -0.095 | 0.401 | -0.064 | 0.58 | ||||||||
| Natural killer cell | KIR2DL1 | 0.195 | **** | 0.176 | *** | -0.058 | 0.187 | -0.05 | 0.273 | 0.178 | **** | 0.182 | **** | -0.141 | 0.212 | -0.151 | 0.189 | |||||||
| KIR2DL3 | 0.106 | * | 0.087 | 0.0627 | -0.104 | * | -0.113 | * | 0.122 | ** | 0.106 | * | -0.359 | ** | -0.329 | ** | ||||||||
| KIR2DL4 | -0.039 | 0.369 | -0.034 | 0.461 | -0.304 | **** | -0.329 | **** | -0.074 | 0.095 | -0.076 | 0.0929 | -0.211 | 0.0598 | -0.168 | 0.143 | ||||||||
| KIR3DL1 | 0.238 | **** | 0.202 | **** | -0.018 | 0.676 | -0.013 | 0.774 | 0.189 | **** | 0.194 | **** | -0.147 | 0.192 | -0.111 | 0.335 | ||||||||
| KIR3DL2 | 0.012 | 0.789 | -0.011 | 0.814 | -0.087 | * | -0.093 | * | 0.021 | 0.639 | 0.014 | 0.757 | -0.368 | *** | -0.329 | ** | ||||||||
| KIR3DL3 | -0.029 | 0.511 | -0.008 | 0.864 | -0.057 | 0.196 | -0.045 | 0.322 | -0.024 | 0.58 | -0.021 | 0.644 | -0.257 | * | -0.229 | * | ||||||||
| KIR2DS4 | 0.065 | 0.136 | 0.06 | 0.195 | -0.088 | * | -0.109 | * | 0.081 | 0.0656 | 0.078 | 0.083 | -0.28 | * | -0.25 | * | ||||||||
| Dendritic cell | HLA-DPB1 | -0.159 | *** | -0.158 | *** | -0.298 | **** | -0.332 | **** | 0.17 | *** | 0.178 | **** | -0.142 | 0.208 | -0.11 | 0.34 | |||||||
| HLA-DQB1 | -0.049 | 0.258 | -0.041 | 0.375 | -0.244 | **** | -0.271 | **** | 0.14 | ** | 0.126 | ** | -0.254 | * | -0.218 | 0.0567 | ||||||||
| HLA-DRA | -0.192 | **** | -0.209 | **** | -0.348 | **** | -0.378 | **** | 0.125 | ** | 0.121 | ** | -0.254 | * | -0.263 | * | ||||||||
| HLA-DPA1 | -0.186 | **** | -0.188 | **** | -0.329 | **** | -0.363 | **** | 0.122 | ** | 0.126 | ** | -0.238 | * | -0.209 | 0.0683 | ||||||||
| BDCA-1 (CD1C) | 0.116 | ** | 0.156 | *** | -0.184 | **** | -0.197 | **** | 0.204 | **** | 0.202 | **** | 0.106 | 0.349 | 0.139 | 0.229 | ||||||||
| BDCA-4 (NRP1) | 0.24 | **** | 0.261 | **** | -0.208 | **** | -0.172 | *** | -0.061 | 0.166 | -0.065 | 0.146 | -0.299 | ** | -0.252 | * | ||||||||
| CD11c (ITGAX) | -0.316 | **** | -0.319 | **** | -0.123 | ** | -0.172 | *** | 0.1 | * | 0.097 | * | -0.395 | *** | -0.355 | ** | ||||||||
| Th1 | T-bet (TBX21) | 0.057 | 0.193 | 0.084 | 0.0706 | -0.187 | **** | -0.173 | *** | 0.174 | **** | 0.174 | *** | -0.356 | ** | -0.313 | ** | |||||||
| STAT4 | -0.169 | **** | -0.148 | ** | 0.423 | **** | 0.397 | **** | 0.035 | 0.431 | 0.024 | 0.602 | -0.301 | ** | -0.287 | * | ||||||||
| STAT1 | -0.277 | **** | -0.28 | **** | -0.278 | **** | -0.267 | **** | -0.051 | 0.244 | -0.052 | 0.249 | -0.41 | *** | -0.368 | *** | ||||||||
| IFN-γ (IFNG) | -0.303 | **** | -0.301 | **** | -0.114 | ** | -0.141 | ** | 0.002 | 0.956 | -0.011 | 0.801 | -0.362 | *** | -0.337 | ** | ||||||||
| TNF-α (TNF) | -0.066 | 0.127 | -0.058 | 0.214 | -0.133 | ** | -0.157 | *** | 0.001 | 0.977 | -0.018 | 0.691 | -0.378 | *** | -0.34 | ** | ||||||||
| Th2 | GATA3 | -0.119 | ** | -0.091 | 0.0521 | -0.241 | **** | -0.27 | **** | -0.038 | 0.388 | -0.051 | 0.262 | -0.281 | * | -0.219 | 0.0559 | |||||||
| STAT6 | 0.014 | 0.746 | 0.02 | 0.668 | 0.104 | * | 0.03 | 0.517 | 0.289 | **** | 0.284 | **** | -0.07 | 0.539 | -0.042 | 0.716 | ||||||||
| STAT5A | -0.379 | **** | -0.372 | **** | -0.238 | **** | -0.299 | **** | 0.09 | * | 0.095 | * | 0.455 | **** | 0.434 | **** | ||||||||
| IL13 | 0.017 | 0.704 | 0.046 | 0.324 | 0.067 | 0.127 | 0.069 | 0.131 | 0.041 | 0.358 | 0.016 | 0.72 | -0.292 | ** | -0.271 | * | ||||||||
| Tfh | BCL6 | -0.111 | * | -0.13 | ** | -0.262 | **** | -0.241 | **** | 0.037 | 0.403 | 0.057 | 0.21 | 0.112 | 0.321 | 0.09 | 0.437 | |||||||
| IL21 | -0.22 | **** | -0.21 | **** | -0.1 | * | -0.094 | * | 0.03 | 0.504 | 0.041 | 0.364 | -0.26 | * | -0.235 | * | ||||||||
| Th17 | STAT3 | -0.095 | * | -0.091 | 0.0514 | -0.519 | **** | -0.507 | **** | 0.049 | 0.262 | 0.066 | 0.143 | -0.52 | **** | -0.504 | **** | |||||||
| IL17A | -0.063 | 0.146 | -0.009 | 0.846 | -0.013 | 0.766 | 0.009 | 0.852 | 0.1 | * | 0.109 | * | NA | NA | NA | NA | ||||||||
| Treg | FOXP3 | -0.388 | **** | -0.368 | **** | 0.186 | **** | 0.172 | *** | -0.071 | 0.106 | -0.098 | * | -0.243 | * | -0.204 | 0.0745 | |||||||
| CCR8 | -0.323 | **** | -0.31 | **** | -0.051 | 0.248 | -0.055 | 0.233 | -0.016 | 0.723 | -0.028 | 0.532 | -0.288 | ** | -0.241 | * | ||||||||
| STAT5B | 0.258 | **** | 0.241 | **** | -0.25 | **** | -0.228 | **** | 0.175 | **** | 0.178 | **** | 0.155 | 0.17 | 0.141 | 0.22 | ||||||||
| TGFβ (TGFB1) | -0.299 | **** | -0.263 | **** | -0.296 | **** | -0.353 | **** | -0.029 | 0.504 | -0.027 | 0.551 | 0.079 | 0.488 | 0.111 | 0.336 | ||||||||
| T cell exhaustion | PD-1 (PDCD1) | -0.266 | **** | -0.259 | **** | -0.27 | **** | -0.27 | **** | -0.011 | 0.807 | -0.021 | 0.648 | -0.416 | *** | -0.376 | *** | |||||||
| CTLA4 | -0.29 | **** | -0.285 | **** | -0.065 | 0.142 | -0.079 | 0.0856 | 0.017 | 0.705 | -0.002 | 0.962 | -0.313 | ** | -0.273 | * | ||||||||
| LAG3 | -0.303 | **** | -0.282 | **** | -0.254 | **** | -0.26 | **** | -0.069 | 0.12 | -0.082 | 0.0689 | -0.391 | *** | -0.346 | ** | ||||||||
| TIM-3 (HAVCR2) | -0.083 | 0.0561 | -0.103 | * | -0.305 | **** | -0.38 | **** | 0.047 | 0.284 | 0.035 | 0.444 | -0.258 | * | -0.229 | * | ||||||||
| GZMB | 0.008 | 0.849 | 0.034 | 0.467 | -0.048 | 0.273 | -0.045 | 0.327 | -0.031 | 0.485 | -0.047 | 0.303 | -0.361 | *** | -0.312 | ** | ||||||||
KIRC, kidney renal clear cell carcinoma; LGG, Brain Lower Grade Glioma; LUAD, lung adenocarcinoma; UVM, uveal melanoma; TAM, tumor-associated macrophage; Th, T helper cell; Tfh, Follicular helper T cell; Treg, regulatory T cell; Cor, R value of Spearman's correlation; None, correlation without adjustment. Purity, correlation adjusted by purity.
*p<0.05; **p<0.01; ***p<0.001; ****p<0.0001.
Correlation analysis between CA4 and related genes and markers of immune cells in GEPIA.
| Description | Gene markers | KIRC | LGG | LUAD | UVM | |||||||||||||
|---|---|---|---|---|---|---|---|---|---|---|---|---|---|---|---|---|---|---|
| Tumor | Normal | Tumor | Tumor | Normal | Tumor | |||||||||||||
| R | P | R | P | R | P | R | P | R | P | R | P | |||||||
| Monocyte | CD86 | -0.17 | **** | 0.23 | 0.051 | -0.33 | **** | 0.053 | 0.24 | -0.19 | 0.15 | -0.25 | * | |||||
| CD115 (CSF1R) | -0.059 | 0.17 | 0.23 | * | -0.28 | **** | 0.079 | 0.082 | -0.28 | * | -0.15 | 0.2 | ||||||
| TAM | CCL2 | 0.32 | **** | -0.24 | * | -0.33 | **** | -0.014 | 0.76 | 0.0011 | 0.99 | 0.057 | 0.62 | |||||
| CD68 | -0.13 | ** | 0.4 | *** | -0.38 | **** | 0.18 | **** | -0.19 | 0.15 | 0.13 | 0.25 | ||||||
| IL10 | -0.074 | 0.092 | 0.0092 | 0.94 | -0.37 | **** | 0.16 | *** | -0.35 | ** | -0.13 | 0.24 | ||||||
| M1 Macrophage | INOS (NOS2) | 0.46 | **** | 0.068 | 0.57 | 0.27 | **** | 0.3 | **** | 0.46 | *** | 0.038 | 0.74 | |||||
| IRF5 | -0.1 | * | -0.62 | **** | -0.28 | **** | 0.095 | * | -0.28 | * | -0.27 | * | ||||||
| COX2 (PTGS2) | 0.051 | 0.24 | -0.35 | ** | 0.027 | 0.54 | -0.088 | 0.052 | -0.0043 | 0.97 | -0.28 | * | ||||||
| M2 Macrophage | CD163 | -0.1 | * | 0.12 | 0.31 | -0.4 | **** | 0.14 | ** | -0.2 | 0.13 | -0.17 | 0.14 | |||||
| VSIG4 | -0.12 | ** | 0.15 | 0.21 | -0.38 | **** | 0.17 | *** | -0.25 | 0.061 | -0.2 | 0.074 | ||||||
| MS4A4A | -0.069 | 0.12 | 0.26 | * | -0.38 | **** | 0.2 | **** | -0.24 | 0.071 | -0.11 | 0.35 | ||||||
| Th1 | T-bet (TBX21) | 0.19 | **** | 0.36 | ** | -0.22 | **** | 0.2 | **** | 0.43 | *** | -0.34 | ** | |||||
| STAT4 | -0.027 | 0.54 | 0.17 | 0.14 | 0.41 | **** | 0.079 | 0.085 | 0.2 | 0.14 | -0.19 | 0.1 | ||||||
| STAT1 | -0.069 | 0.12 | -0.29 | * | -0.22 | **** | -0.015 | 0.73 | 0.11 | 0.41 | -0.27 | * | ||||||
| IFN-γ (IFNG) | -0.24 | **** | 0.02 | 0.87 | -0.1 | * | -0.0043 | 0.92 | 0.059 | 0.66 | -0.25 | * | ||||||
| TNF-α (TNF) | 0.046 | 0.29 | -0.078 | 0.51 | -0.15 | *** | 0.02 | 0.66 | -0.2 | 0.13 | -0.33 | ** | ||||||
| Th2 | GATA3 | -0.021 | 0.64 | -0.41 | *** | -0.23 | **** | 0.013 | 0.77 | 0.39 | ** | -0.32 | ** | |||||
| STAT6 | 0.25 | **** | -0.4 | *** | 0.052 | 0.24 | 0.28 | **** | 0.19 | 0.15 | -0.2 | 0.083 | ||||||
| STAT5A | -0.1 | * | 0.017 | 0.89 | -0.26 | **** | 0.13 | ** | -0.047 | 0.72 | 0.28 | * | ||||||
| IL13 | 0.12 | ** | -0.067 | 0.58 | -0.018 | 0.68 | 0.069 | 0.13 | -0.079 | 0.55 | -0.34 | ** | ||||||
| Treg | FOXP3 | -0.33 | **** | -0.16 | 0.18 | 0.22 | **** | -0.019 | 0.68 | -0.17 | 0.19 | -0.22 | 0.052 | |||||
| CCR8 | -0.22 | **** | 0.21 | 0.074 | -0.061 | 0.16 | 0.043 | 0.34 | -0.15 | 0.26 | -0.26 | * | ||||||
| STAT5B | 0.41 | **** | -0.093 | 0.44 | -0.18 | **** | 0.23 | **** | 0.41 | ** | 0.015 | 0.9 | ||||||
| TGFβ (TGFB1) | -0.11 | * | -0.57 | **** | -0.36 | **** | 0.014 | 0.76 | -0.05 | 0.7 | -0.054 | 0.64 | ||||||
| T cell exhaustion | PD-1 (PDCD1) | -0.2 | **** | 0.39 | *** | -0.3 | **** | 0.0068 | 0.88 | -0.0078 | 0.95 | -0.37 | *** | |||||
| CTLA4 | -0.2 | **** | 0.15 | 0.22 | -0.1 | * | 0.054 | 0.23 | -0.05 | 0.71 | -0.29 | ** | ||||||
| LAG3 | -0.24 | **** | -0.57 | **** | -0.24 | **** | -0.055 | 0.22 | 0.072 | 0.59 | -0.35 | ** | ||||||
| TIM-3 (HAVCR2) | 0.028 | 0.52 | 0.59 | **** | -0.33 | **** | 0.076 | 0.095 | -0.19 | 0.14 | -0.22 | * | ||||||
| GZMB | 0.089 | * | 0.35 | ** | -0.092 | * | -0.047 | 0.3 | 0.43 | *** | -0.29 | ** | ||||||
KIRC, kidney renal clear cell carcinoma; LGG, Brain Lower Grade Glioma; LUAD, lung adenocarcinoma; UVM, uveal melanoma; TAM, tumor-associated macrophage; Th, T helper cell; Treg, regulatory T cell; R, R value of Spearman's correlation.
*p<0.05; **p<0.01; ***p<0.001; ****p<0.0001.
Differential CA4 expression in KIRC
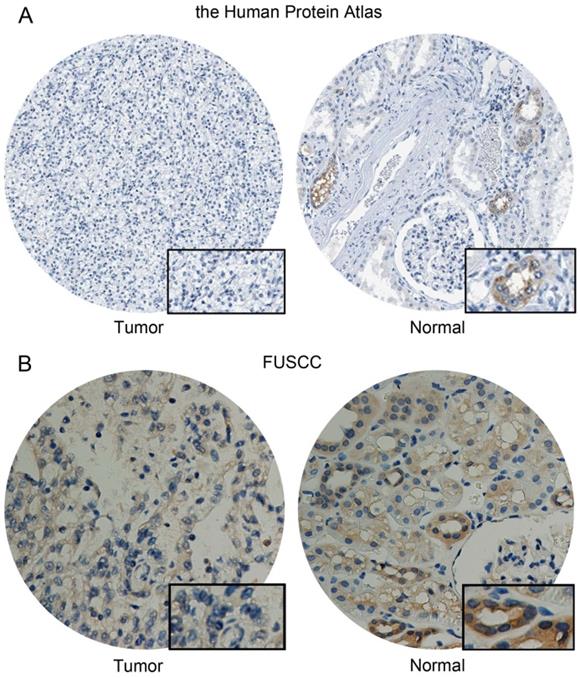
CA4 was detected low expressed in normal cells of kidney tubules, while not detected in KIRC tissues from the Human Protein atlas (Figure 7A). Meanwhile, significantly elevated CA4 expression was found in normal tissues compared with KIRC tissues from FUSCC cohort (Figure 7B).
Differential CA4 expression in 322 KIRC patients from FUSCC cohorts. (A) CA4 was detected low expressed in normal cells of kidney tubules, while not detected in KIRC tissues from the Human Protein atlas. (B) Significantly elevated CA4 expression was found in normal tissues compared with KIRC tissues from FUSCC cohort. KIRC, kidney renal clear cell carcinoma; FUSCC, Fudan University Shanghai Cancer Center.
Discussion
CA isoenzymes make biochemical reaction with other enzymes in diverse ways. CA isoenzymes are triggered up- or down-regulated on the level of genes by normal pathways changes in diverse dysfunctions, which contributes to the major prerequisite of CA as a biomarker 11. Of all Carbonic Anhydrase family, CA2 is the most active CA isoenzyme. The hydration rate of CO2 is close to the diffusion limit, and it has most wide distribution in human. It is expressed in the cytoplasm of almost every tissue or organ 11. Parkilla and his collaborators lately suggested CA2 acted as a marker of gastrointestinal stromal tumors. Compared with low or no protein expression, high expression of CA2 is related to better survival outcomes, suggesting that CA2 can be a potential marker for this interstitial tumor diagnosis 35.
CA4, a fast isoenzyme similar to CA2, binds to the membrane through glycosylphosphatidylinositol anchors 11. It was found that CA4 resisted to the restraint of halogen ions better than CA2 and was suitable for catalyzing the interconversion of CO2/HCO3-. CA4 was reported to express on certain capillary beds, the parietal membrane of kidney, pulmonary microvessels and choroidal capillaries 36.
In our study, CA4 mRNA expressions were found significantly lower in 15 kinds of cancers compared to corresponding normal tissues. However, CA4 expression was found higher within CHOL and LIHC compared to the corresponding normal tissues. Markedly, the decreased CA4 expression is closely related to worse OS and PFS in KIRC, LGG, LUAD and UVM, as well as worse OS within PRAD (p <0.05). This evidence suggests that CA4 plays an anti-tumor role in the four tumors previously described. Therefore, understanding of the mechanism of CA4 promoting tumorigenesis and progression may provide strategies for clinical treatment of tumors.
Tumor microenvironment plays a key part in tumor generating, development, aggression and metastasis 2. Invasive tumors are usually described into various cancer types, along with diverse cells associated with innate and adaptive immunity 37. Lymphocyte is usually considered as the most important tumor-infiltrating immune cell, such as T cell, B cell and NK cell. TILs were often existed in cancers and were considered to be the host's immune response to malignant cells, which reflected actional approaches of “cancer immunoediting” 38. Over the past few decades, increasing studies suggested that better prognosis for many cancers correlated with TILs, indicating the valuable function in resisting tumor development 37,39. TIL represents a heterogeneous cell population such as the immune subgroups categorized depending on the effects of physiology and pathology in the context of immunity. Accordingly, tumor microenvironment may be composed of sophisticated TILs with the consequence of competitive immunostimulatory or immunosuppressive effects. Therefore, TILs is important in regulating anti-tumor immune system 40. The close relationship between clinical results and corresponding TILs was confirmed among diverse cancers, such as melanoma 41 and lung cancer 42. In colon cancer, TILs are considered to be better predictors for prognosis, even compared with classic prognostic factors such as TNM staging 43. For this reason, it was suggested that “Immunoscore”, an designated scoring system, was on the basis of 3 immune components: type, density and location of immune cells 37.
Nowadays, TILs also attract more attentions for cancer immunotherapy because they may be used to be markers for identifying patients who are possibly suitable for immunosuppressive therapy. Immunotherapy as a treatment for cancer has sparked new interest because of hopeful clinical outcomes found in the use of inhibiting immune checkpoint within a variety of cancers, including Hodgkin's disease and melanoma 44,45. In this study, we explored different TIMEs of CA4 in 30 kinds of tumors and calculated the immune scores correlated with CA4 in KIRC, LGG, LUAD and PRAD. Relations between CA4 expression and the abundance of TILs in different tumors were performed in heat map. Additionally, relations between immune scores and CA4 mRNA expression in KIRC, LGG, LUAD and PRAD were performed. These results showed that increased CA4 expression correlated with better prognosis and CA4 expression levels significantly correlated with B cell infiltration within KIRC, B cell, CD4+ T cell, macrophage, neutrophil and dendritic cell infiltration within LGG, B cell infiltration in PRAD, CD8+ T cell, CD4+ T cell and neutrophil infiltration within UVM (|partial.cor| > 0.2 and p<0.05). Therefore, CA4 may play a crucial part in immune cell infiltration and prognosis.
Nevertheless, several limitations should be considered in this study. Most parts of this study were performed in silico and were investigated based on large-scale samples from TCGA. The lack of independent cohorts of patients to validate the prognostic values of CA4 in LGG, LUAD, PRAD and UVM need to be considered. However, considering we have validated significant prognostic implications of CA4 in KIRC, more investigative researches should be performed to further elucidate CA4 as potential biomarker for diagnosis, immunotherapy and prognosis in these cancers in the future. The specific molecular functions of CA4 mRNA expression also need further researches to clarify.
Conclusion
Consequently, our data revealed that decreased CA4 expression was related to worse prognosis in multiple cancers, especially in KIRC, LGG, LUAD, PRAD and UVM. In addition, CA4 is possible to play an important part in immune cell infiltration among these five cancers. Therefore, CA4 is suggested to provide a novel biomarker for diagnosis, immunotherapy and prognosis in these cancers.
Supplementary Material
Supplementary figure.
Acknowledgements
Ethics approval and consent to participate
Study procedures were approved by First Affiliated Hospital of Soochow University (Suzhou, China) included in this research (ID: 2019-076). Written informed consents were acquired from online open-access databases.
Availability of data and material
The datasets analyzed in this study were obtained from the corresponding author upon reasonable request.
Funding
This work is supported by Grants from the National Natural Science Foundation of China (No. 81802525) and National Key Research and Development Project (No.2019YFC1316000).
Author Contributions
The work was performed in co-operation with all authors. ZXF and ZHL defined research topics and discussed analysis. XY, XWH and SSN drafted the manuscript, analyzed data and illustrated the results. YXL, RYR and ZXY assisted in performing data collection, statistical analysis and reference collection. QYY co-worked on statistical analysis and data collection. All authors read and approved the final manuscript.
Abbreviations
CA4, carbonic anhydrase 4; TCGA, the Cancer Genome Atlas; TISIDB, tumor-immune system interactions; OS, overall survival; PFS, progression-free survival; PPI, protein-protein interaction; STRING, search tool for the retrieval of interacting genes; TIMER, tumor immune estimation resource; GEPIA, gene expression profiling interactive analysis; CI, confidence interval; GO, gene ontology; BP, biological processes; CC, cellular components; MF, molecular functions; KEGG, Kyoto Encyclopedia of Genes and Genomes; KIRC, kidney renal clear cell carcinoma; LGG, brain lower grade glioma; LUAD, lung adenocarcinoma; PRAD, prostate adenocarcinoma; UVM, uveal melanoma; BLCA, bladder urothelial carcinoma; BRCA, breast invasive carcinoma; COAD, colon adenocarcinoma; ESCA, esophageal carcinoma; HNSC, head and neck squamous cell carcinoma; KICH, kidney chromophobe; KIRP, kidney renal papillary cell carcinoma; LUSC, lung squamous cell carcinoma; READ, rectum adenocarcinoma; STAD, stomach adenocarcinoma; THCA, thyroid carcinoma; UCEC, uterine corpus endometrial carcinoma; CHOL, cholangiocarcinoma; LIHC, liver hepatocellular carcinoma; SKCM, skin cutaneous melanoma.
Competing Interests
The authors have declared that no competing interest exists.
References
1. Joyce JA, Fearon DT. T cell exclusion, immune privilege, and the tumor microenvironment. Science (80- ). 2015;348:74-80
2. Bremnes RM, Busund LT, Kilver TL, Andersen S, Richardsen E, Paulsen EE, Hald S, Khanehkenari MR, Cooper WA, Kao SC, Donnem T. The role of tumor-infiltrating lymphocytes in development, progression, and prognosis of non-small cell lung cancer. J Thorac Oncol [Internet]. 2016;11:789-800 Available from: http://dx.doi.org/10.1016/j.jtho.2016.01.015
3. Taube JM, Galon J, Sholl LM, Rodig SJ, Cottrell TR, Giraldo NA, Baras AS, Patel SS, Anders RA, Rimm DL, Cimino-Mathews A. Implications of the tumor immune microenvironment for staging and therapeutics. Mod Pathol. 2018;31:214-34
4. Andrews MC, Reuben A, Gopalakrishnan V, Wargo JA. Concepts Collide: Genomic, immune, and microbial influences on the tumor microenvironment and response to cancer therapy. Front Immunol. 2018;9:946
5. Dagogo-jack I, Shaw AT. Tumour heterogeneity and resistance to cancer therapies. Nat Rev Clin Oncol. 2018;15:81-94
6. Desrichard A, Snyder A, Chan TA. Cancer Neoantigens and Applications for Immunotherapy. Clin Cancer Res. 2016;22:807-12
7. Reuben A, Spencer CN, Prieto PA, Gopalakrishnan V, Reddy SM, Miller JP, Mao X, De Macedo MP, Chen J, Song X, Jiang H, Chen PL. et al. Genomic and immune heterogeneity are associated with differential responses to therapy in melanoma. NPJ Genomic Med. 2017 2
8. Kawashima A, Uemura M, Nonomura N. Importance of Multiparametric Evaluation of Immune-Related T-Cell Markers in Renal-Cell Carcinoma. Clin Genitourin Cancer [Internet]. 2019;17:e1147-52 Available from: https://doi.org/10.1016/j.clgc.2019.07.021
9. Wang L, Zhu B, Zhang M, Wang X. Roles of immune microenvironment heterogeneity in therapy-associated biomarkers in lung cancer. Semin Cell Dev Biol [Internet]. 2017;64:90-7 Available from: http://dx.doi.org/10.1016/j.semcdb.2016.09.008
10. Whiteside T. The tumor microenvironment and its role in promoting tumor growth. Oncogene. 2008;27:5904-12
11. Supuran CT. Carbonic anhydrases: Novel therapeutic applications for inhibitors and activators. Nat Rev Drug Discov. 2008;7:168-81
12. Occhipinti R, Boron WF. Role of carbonic anhydrases and inhibitors in acid-base physiology: Insights from mathematical modeling. Int J Mol Sci. 2019;20:E3841
13. Supuran CT. Structure and function of carbonic anhydrases. Biochem J. 2016;473:2023-32
14. Zamanova S, Shabana AM, Mondal UK, Ilies MA. Carbonic anhydrases as disease markers. Expert Opin Ther Pat [Internet]. 2019;29:509-33 Available from: https://doi.org/10.1080/13543776.2019.1629419
15. Potter C, Harris AL. Hypoxia inducible carbonic anhydrase IX, marker of tumour hypoxia, survival pathway and therapy target. Cell Cycle. 2004;3:164-7
16. Ambrosio MR, Serio C Di, Danza G, Rocca BJ, Ginori A, Prudovsky I, Marchionni N, Teresa M, Tarantini F. Carbonic anhydrase IX is a marker of hypoxia and correlates with higher Gleason scores and ISUP grading in prostate cancer. Diagn Pathol [Internet]. 2016;11:45. Available from: http://dx.doi.org/10.1186/s13000-016-0495-1
17. Ilie MI, Hofman V, Ortholan C, Ammadi R El, Bonnetaud C, Havet K, Venissac N, Mouroux J, Mazure NM, Pouysségur J, Hofman P. Overexpression of carbonic anhydrase XII in tissues from resectable non-small cell lung cancers is a biomarker of good prognosis. Int J Cancer. 2011;128:1614-23
18. Watson PH, Chia SK, Wykoff CC, Han C, Leek RD, Sly WS, Gatter KC, Ratcliffe P, Harris AL. Carbonic anhydrase XII is a marker of good prognosis in invasive breast carcinoma. Br J Cancer. 2003;88:1065-70
19. Waheed A, Sly WS. Carbonic anhydrase XII functions in health and disease. Gene [Internet]. 2017;623:33-40 Available from: http://dx.doi.org/10.1016/j.gene.2017.04.027
20. Purkerson JM, Schwartz GJ. The role of carbonic anhydrases in renal physiology. Kidney Int. 2007;71:103-15
21. Sterling D, Alvarez B V, Casey JR. The extracellular component of a transport metabolon: Extracellular loop 4 of the human AE1 Cl-/HCO3- exchanger binds carbonic anhydrase IV. J Biol Chem. 2002;277:25239-46
22. Waheed A, Okuyama T, Heyduk T, Sly WS. Carbonic anhydrase IV: Purification of a secretory form of the recombinant human enzyme and identification of the positions and importance of its disulfide bonds. Arch Biochem Biophys. 1996;333:432-8
23. Alvarez B V, Vithana EN, Yang Z, Koh AH, Yeung K, Yong V, Shandro HJ, Chen Y, Kolatkar P, Palasingam P, Zhang K, Aung T. et al. Identification and characterization of a novel mutation in the carbonic anhydrase IV gene that causes retinitis pigmentosa. Investig Ophthalmol Vis Sci. 2007;48:3459-68
24. Zhang J, Tsoi H, Li X, Wang H, Gao J, Wang K, Go MY, Ng SC, Chan FK, Sung JJ, Yu J. Carbonic anhydrase IV inhibits colon cancer development by inhibiting the Wnt signalling pathway through targeting the WTAP-WT1-TBL1 axis. Gut. 2016;65:1482-93
25. Rhodes DR, Yu J, Shanker K, Deshpande N, Varambally R, Ghosh D, Barrette T, Pandey A, Chinnaiyan AM. ONCOMINE: A Cancer Microarray Database and Integrated Data-Mining Platform. Neoplasia. 2004;6:1-6
26. Tomczak K, Czerwińska P, Wiznerowicz M. The Cancer Genome Atlas (TCGA): an immeasurable source of knowledge. Wspolczesna Onkol. 2015;19:A68-77
27. Camp RL, Dolled-Filhart M, Rimm DL. X-tile: A new bio-informatics tool for biomarker assessment and outcome-based cut-point optimization. Clin Cancer Res. 2004;10:7252-9
28. Warde-Farley D, Donaldson SL, Comes O, Zuberi K, Badrawi R, Chao P, Franz M, Grouios C, Kazi F, Lopes CT, Maitland A, Mostafavi S. et al. The GeneMANIA prediction server: Biological network integration for gene prioritization and predicting gene function. Nucleic Acids Res. 2010;38:W214-20
29. Szklarczyk D, Gable AL, Lyon D, Junge A, Wyder S, Huerta-Cepas J, Simonovic M, Doncheva NT, Morris JH, Bork P, Jensen LJ, Von Mering C. STRING v11: Protein-protein association networks with increased coverage, supporting functional discovery in genome-wide experimental datasets. Nucleic Acids Res. 2019;47:D607-13
30. Smoot ME, Ono K, Ruscheinski J, Wang PL, Ideker T. Cytoscape 2.8: New features for data integration and network visualization. Bioinformatics. 2011;27:431-2
31. Bindea G, Mlecnik B, Hackl H, Charoentong P, Tosolini M, Kirilovsky A, Fridman W-H, Pagès F, Trajanoski Z, Galon J. ClueGO: a Cytoscape plug-in to decipher functionally grouped gene ontology and pathway annotation networks. Bioinformatics. 2009;25:1091-3
32. Bindea G, Galon J, Mlecnik B. CluePedia Cytoscape plugin: Pathway insights using integrated experimental and in silico data. Bioinformatics. 2013;29:661-3
33. Ru B, Wong CN, Tong Y, Zhong JY, Zhong SSW, Wu WC, Chu KC, Wong CY, Lau CY, Chen I, Chan NW, Zhang J. TISIDB: an integrated repository portal for tumor-immune system interactions. Bioinformatics. 2019;35:4200-2
34. Li T, Fan J, Wang B, Traugh N, Chen Q, Liu JS, Li B, Liu XS. TIMER : A Web Server for Comprehensive Analysis of Tumor-Infiltrating Immune Cells. Cancer Res. 2017;77:108-11
35. Parkkila S, Lasota J, Fletcher JA, Ou W, Kivela AJ, Nuorva K, Parkkila A, Ollikainen J, Sly WS, Waheed A, Pastorekova S, Pastorek J. et al. Carbonic anhydrase II. A novel biomarker for gastrointestinal stromal tumors. Mod Pathol. 2010;23:743-50
36. Sly WS, Hu PY. Human carbonic anhydrases and carbonic anhydrase deficiencies. AnnuRevBiochem. 1995;64:375-401
37. Galon J, Angell HK, Bedognetti D, Marincola FM. The Continuum of Cancer Immunosurveillance: Prognostic, Predictive, and Mechanistic Signatures. Immunity. 2013;39:11-26
38. Schreiber RD, Old LJ, Smyth MJ. Cancer immunoediting: Integrating immunity's roles in cancer suppression and promotion. Science (80- ). 2011;331:1565-70
39. Zhang L, Conejo-Garcia JR, Katsaros D, Gimotty PA, Massovrio M, Regnani G, Makrigiannakis A, Gray H, Schlienger K, Liebman MN, Rubin SC, Coukos G. Intratumoral T cells, recurrence and survival in epithelial ovarian cancer. N Engl J Med. 2003;348:203-13
40. Weiss SA, Han SW, Lui K, Tchack J, Shapiro R, Berman R, Zhong J, Krogsgaard M, Osman I, Darvishian F. Immunologic heterogeneity of tumor-infiltrating lymphocyte composition in primary melanoma. Hum Pathol [Internet]. 2016;57:116-25 Available from: http://dx.doi.org/10.1016/j.humpath.2016.07.008
41. Krynitz B, Rozell BL, Lyth J, Smedby KE, Lindelöf B. Cutaneous malignant melanoma in the Swedish organ transplantation cohort: A study of clinicopathological characteristics and mortality. J Am Acad Dermatol. 2015;73:106-13
42. Al-Shibli KI, Donnem T, Al-Saad S, Persson M, Bremnes RM, Busund LT. Prognostic effect of epithelial and stromal lymphocyte infiltration in non-small cell lung cancer. Clin Cancer Res. 2008;14:5220-7
43. Lee N, Zakka LR, Mihm MC, Schatton T. Tumour-infiltrating lymphocytes in melanoma prognosis and cancer immunotherapy. Pathology. 2016;48:177-87
44. Hodi FS, O'Day SJ, McDermott DF, Weber RW, Sosman JA, Haanen JB, Gonzalez R, Robert C, Schadendorf D, Hassel JC, Akerley W, Van Den Eertwegh AJM. et al. Improved survival with ipilimumab in patients with metastatic melanoma. N Engl J Med. 2010;363:711-23
45. Ansell SM, Lesokhin AM, Borrello I, Halwani A, Scott EC, Gutierrez M, Schuster SJ, Millenson MM, Cattry D, Freeman GJ, Rodig SJ, Chapuy B. et al. PD-1 blockade with nivolumab in relapsed or refractory Hodgkin's lymphoma. N Engl J Med. 2015;372:311-9
Author contact
![]() Corresponding authors: Xiao-Feng Zhang M.D. (E-mail: zhangxiaofengedu.cn). Department of Ophthalmology, The First Affiliated Hospital of Soochow University, No. 188 Shizi Street, Suzhou, 215000, PR China. Tel: 86-13915517272. Hai-Liang Zhang M.D. (E-mail: zhanghl918com). Department of Urology, Fudan University Shanghai Cancer Center, No. 270 Dong'an Road, Shanghai, 200032, PR China. Tel: 86-21-64175590-2805; Fax: 86-21-64434556
Corresponding authors: Xiao-Feng Zhang M.D. (E-mail: zhangxiaofengedu.cn). Department of Ophthalmology, The First Affiliated Hospital of Soochow University, No. 188 Shizi Street, Suzhou, 215000, PR China. Tel: 86-13915517272. Hai-Liang Zhang M.D. (E-mail: zhanghl918com). Department of Urology, Fudan University Shanghai Cancer Center, No. 270 Dong'an Road, Shanghai, 200032, PR China. Tel: 86-21-64175590-2805; Fax: 86-21-64434556