Impact Factor ISSN: 1837-9664

 Global reach, higher impact
J Cancer 2020; 11(7):1768-1779. doi:10.7150/jca.38741 This issue Cite
Research Paper
Construction and validation of an eight-gene signature with great prognostic value in bladder cancer
Xin Yan1,2, Xun Fu1, Zi-Xin Guo1, Xiao-Ping Liu1, Tong-Zu Liu1, Sheng Li1,2,3 ![]()
1. Department of Urology, Zhongnan Hospital of Wuhan University, Wuhan 430071, China.
2. Department of Biological Repositories, Zhongnan Hospital of Wuhan University, Wuhan 430071, China.
3. Human Genetics Resource Preservation Center of Hubei Province, Wuhan 430071, China.
Received 2019-7-25; Accepted 2019-11-30; Published 2020-1-17
Abstract
Bladder cancer (BC) is one of the most common malignancies in urinary system with a common malignancy in urinary system with a high mortality and recurrence rate, so we attempt to construct a gene signature to predict the prognosis of BCs. We initially established a co-expression network by performing WGCNA analysis and further identified magenta module as key module (P = 8e-05, R2 = 0.4). Subsequently, we screened 12 genes associated with survival from the key module, which were selected to construct an eight-gene signature by establishing a LASSO Cox model. Moreover, we reckoned the risk score (RS) of each sample, through which we could divide samples into two groups (the high-risk and low-risk groups) and verify the signature, in the training set and 3 validation sets (internal test set, GSE13507and E-MTAB-4321). This signature could distinguish between the high- and low- risk patients well (survival analysis: P = 0.015; AUC: 0.61 at 1 year, 0.61 at 3 years and 0.61 at 5 years). In the validation sets, this signature also showed good performance, which was consistent with the training test. Furthermore, we plotted a nomogram to predict the possibility of the overall survival (OS) and three calibration curves to predict the effectiveness of the nomogram, which suggested good value and clinical utility of the nomogram. In conclusion, we established an eight-gene signature, which was probably effective in the prediction of prognosis of patients with BC.
Keywords: bladder cancer, LASSO, WGCNA, grade, survival, gene signature, nomogram, overall survival, prognosis
Introduction
BC is the tenth most common type of cancer worldwide, with approximately morbidity of 3.0% and mortality of 2.1% [1]. In addition, BC is a malignancy with a poor prognosis and a high recurrence rate (30-70%), the five-year survival rate of which is approximately 50-70% as reported [2]. Thus, many patients may lose the best opportunities to be diagnosed and cured because of the high morbidity and mortality as well as the poor prognosis, which means that some new methods to diagnose and predict the prognosis of BC are required.
We have noticed that some studies identified novel prognostic biomarkers for BC by using bioinformatics methods [3, 4], which means it is promising to utilize biomarkers to predict the prognosis of patients [5]. But almost all these studies only explore the predictive value of a single biomarker [6]. Actually, the effect of just a single biomarker for predicting prognosis is probably not sufficient in BC. Thus, by performing least absolute shrinkage and selection operator (LASSO) Cox regression model, the aim of this study was to develop and validate a more effective and useful multi-gene signature and further establish a prognostic nomogram based on several biomarkers obtained through the up-front bioinformatics analysis, which might be of great and predictive value for the prognosis of BC patients.
Materials and methods
Data collection and data preprocessing
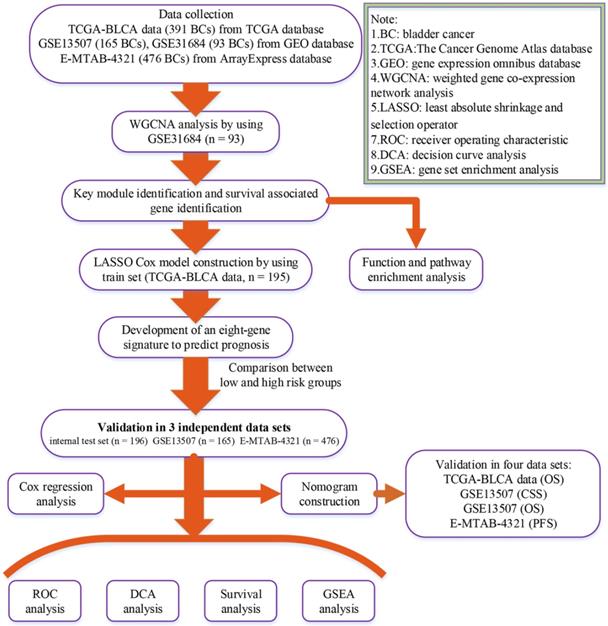
A flow chart of the study was shown in Figure 1. Data GSE31684 [7, 8] including 93 BCs was downloaded from Gene Expression Omnibus (GEO) database (https://www.ncbi.nlm.nih.gov/geo/) for weighted gene co-expression network analysis (WGCNA), which was performed on Affymetrix Human Genome U133 Plus 2.0 Array (GPL570). We firstly annotated GSE31684 by transforming probes into genes and then calculated variances of genes across all samples. Only the top 5,000 most variant genes were picked out for constructing a co-expression network. Moreover, based on The Cancer Genome Atlas (TCGA) database (https:// gdc‐portal.nci.nih.gov/), the mRNA-seq expression profile and clinical information of BC patients were downloaded for LASSO Cox regression analysis. Totally 391 samples were included after getting rid of samples without complete survival information. 391 BCs were randomly assigned into two groups at the rate of 1:1. 195 samples formed the training set, which was used to construct a LASSO Cox model. The test set including 196 BCs was used to verify this model, which was regarded as an internal validation set. Furthermore, we also downloaded two other independent datasets GSE13507 [9, 10] including 165 BCs from GEO database and E-MTAB-4321 including 476 BCs from ArrayExpress database (https://www.ebi.ac.uk/arrayexpress/) for external validation. “DEseq.2” [11] in R software was used for normalization and log2 transformation for TCGA-BLCA data displayed as count number. As for GSE13507 and GSE31684, we downloaded the Raw data and annotated the probes based on the corresponding annotation files. Then normalization and log2 transformation were performed by using R package “affy” [12]. Normalized expression matrix of E-MTAB-4321 was directly downloaded from ArrayExpress database for subsequent analysis. Some important clinical features including age, gender, grade, and stage were available in Table 1.
Flow chart indicating the process used to select target genes included in the analysis.
Clinical characteristics of patients with BC in each study.
| Characteristics | Training dataset | Internal test dataset | Entire TCGA dataset | GSE31684 | GSE13507 | E-MTAB-4321 |
|---|---|---|---|---|---|---|
| Number of patients | 195 | 196 | 391 | 93 | 165 | 476 |
| Age(median, IQR*) | 68(61, 76) | 70(61, 77) | 69(61, 77) | 69(62, 77) | 65(59,74) | 69(62, 76) |
| ≥ 65 | 120 | 136 | 256 | 67 | 96 | 323 |
| < 65 | 74 | 60 | 134 | 26 | 69 | 153 |
| NA | 1 | 0 | 1 | 0 | 0 | |
| Gender | ||||||
| Male | 142 | 145 | 287 | 68 | 135 | 367 |
| Female | 53 | 51 | 104 | 25 | 30 | 109 |
| Stage | ||||||
| I | 1 | 1 | 2 | 15 | 104 | 457 |
| II | 55 | 62 | 117 | 17 | 31 | 16 |
| III | 70 | 69 | 139 | 42 | 19 | 0 |
| IV | 67 | 64 | 131 | 19 | 11 | 0 |
| NA | 2 | 0 | 2 | 0 | 0 | 3 |
| Grade | ||||||
| Low | 5 | 7 | 12 | 6 | 105 | 277 |
| High | 187 | 189 | 376 | 87 | 60 | 192 |
| NA | 3 | 0 | 3 | 0 | 0 | 7 |
*IQR: interquartile range.
WGCNA analysis to screen out a key module
We initially checked the expression data profile of top 2,500 genes whether they fit the co-expression network construction by using sample network method. A sample was considered to be array outlier when its Z.Ku < -2.5, which was weeded out from the profile. Then based on R package “WGCNA” [13], we constructed a co-expression network. In order to classify genes into gene modules, three independent methods including manual (interactive) branch cutting approach, automatic single block analysis and 2 block analysis were used. In the process, we set a relatively large minimum module size (minClusterSize = 30) and a medium sensitivity (deepSplit = 2) for branch splitting. Furthermore, we identified key modules correlated with grade which interested us most through two methods. We firstly quantized the correlation between module eigengenes and traits, and further quantify the relationship by calculating Gene Significance (GS). Through the data processing, we got the average value of GS of all the genes in a module, called Module Significance (MS). The most positively relevant module was considered to be key module according to the results.
Functional enrichment and pathway enrichment analysis
Gene Ontology (GO) enrichment analysis and Kyoto Encyclopedia of Genes and Genomes (KEGG) pathway analysis were performed for genes within the key module based on “clusterProfiler” [14] in R software. Gene sets with P value less than 0.05 were referred to be significantly enriched.
Genes associated with survival identification
Having completed aforesaid identification of gene module, we preliminarily picked out genes according to the standard: |cor.geneModuleMembership| > 0.5 and |cor.geneTraitSignificance| > 0.2. Furthermore, we utilized overall survival (OS) analysis to pick out genes related to survival from those preliminarily picked genes by an online tool called Kaplan-Meier Plotter (https://kmplot.com/analysis/). Genes with significant P value (P < 0.05) in OS analysis would be thought as survival associated genes.
Constructing and verifying a multi-gene signature
For the construction of LASSO Cox model, we extracted the expression data of survival associated genes based on the training set. We afterwards performed LASSO Cox regression analysis by R package “glmnet” [15], after which genes signature containing most helpful biomarkers for prognosis was obtained and then the risk score of each sample in all the datasets was calculated through the signature. Furthermore, we divided samples in all the datasets into high- and low- risk groups relying on their own median risk score. Then we performed survival analysis by using R package “survival” [16] and time-dependent (1-year, 3-year, and 5-year) receiver operating characteristic (ROC) analysis by using R package “timeROC” [17] in all the datasets (training set, internal test set, GSE13507, and E-MTAB-4321) to verify the prognostic value of the multi-gene-based classifier.
Univariate and multivariate Cox regression analysis
To complete the Cox proportion hazard regression analysis, the multi-gene signature (using this signature as feature and the risk score as feature value) and other significant clinical features including gender, age, pathologic stage, and histologic grade were included in cox univariate analysis of overall survival (OS) by using TCGA-BLCA data, and elements in aforesaid analysis whose P value was less than 0.1 were brought into cox multivariate analysis. R package “forestplot” [18] was used to visualize the results.
Nomogram construction and validation
Before the nomogram construction, cross-validation was performed to deal with over-fitting of the model. Package “rms” in R software was utilized to plot not only the nomogram but also calibrate curve which could test the nomogram. 45° line in the calibrate curve represented the best prediction. In addition, decision curve analysis (DCA) was conducted through R package “rmda” [19] to ensure if the multi-gene signature was clinically helpful. Moreover, we calculated the C-index (Concordance index) and AUC (area under curve, based on R package “pROC” [20]) between the actual observation frequency and the predicted probability to estimate the accuracy of the nomogram. TCGA-BLCA was used for internal validation and GSE13507 and E-MTAB-4321 were used for external validation.
Gene set enrichment analysis (GSEA)
We firstly reckoned the median risk score on the basis of aforesaid dataset GSE31684 (the dataset used for WGCNA analysis) for the reason of the understanding of underlying functions of the multiple-gene signature. Afterwards, 93 BC samples were split into two groups (high-risk group and low-risk group) through the median risk score. We set “c2.cp.kegg.v6.2.symbols.gmt”as the reference gene set, and further performed GSEA [21] among the two groups. KEGG signaling pathways were filtered by a cut-off criteria of nominal P < 0.05, |ES| > 0.6, and FDR < 25%.
Results
Key module identification
3 outlier samples were weeded out by using sample network methods, totally 90 samples were used for constructing a co-expression network (Figure S1). As shown in Figure S2, beta (β) = 4 (scale free R2 = 0.85) was further set as the soft-thresholding for adjacencies calculation. Furthermore, 11 modules were identified in total by classifying genes into gene modules and merging modules (Figure S3). Genes without being classified into any other module formed the grey module, which was abandoned for further analysis. Among these modules, the magenta module was the most correlated one with grade positively (P =8e-05, R2 = 0.4) (Figure 2A), which was considered to be key module in this study. In addition, the MS of magenta module was higher than those of other modules suggested by Figure 2B-C. A network heatmap and a classical MDS plot were showed in Figure S4.
Identification of modules associated with the clinical traits of BC and bioinformatics analysis of genes in the hub module. (A) Heatmap of the correlation between module eigengenes and clinical traits of BC. (B) Distribution of average gene significance and errors in the modules associated with grade of BC. (C) Scatter plot of module eigengenes related to grade in the magenta module. (D) Biological process of genes in the hub module. (E) KEGG pathway enrichment of genes in the hub module.
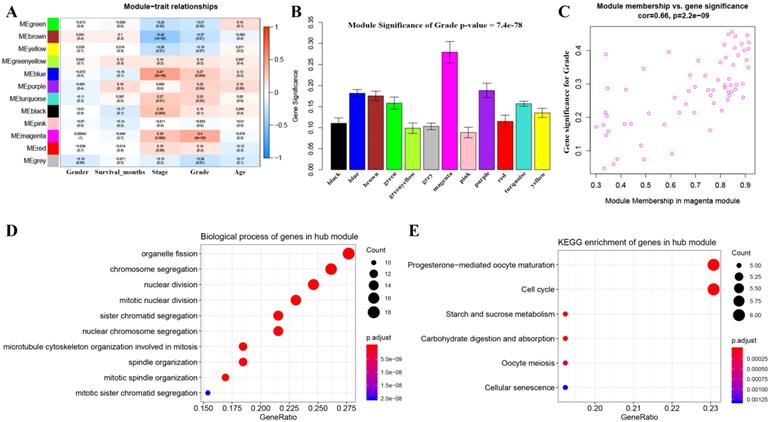
GO and KEGG pathway analysis
Totally 137 biological processes (BPs) were shown in Table S1, which were enriched by genes in the key module. The top 10 BPs were organelle fission, chromosome segregation, nuclear division, mitotic nuclear division, sister chromatid segregation, nuclear chromosome segregation, microtubule cytoskeleton organization involved in mitosis, spindle organization, mitotic spindle organization, and mitotic sister chromatid segregation as shown in Figure 2D. Moreover, six KEGG pathways including progesterone-mediated oocyte maturation, cell cycle, starch and sucrose metabolism, carbohydrate digestion and absorption, oocyte meiosis, and cellular senescence were significantly enriched by genes in the key module suggested by Figure 2E.
Survival associated gene identification
At first, we preliminarily selected 45 genes from the key module, which contained 65 genes originally, through the criterion:|cor.geneModuleMembership| > 0.5, and |cor.geneTraitSignificance| > 0.2. Moreover, we used Kaplan-Meier Plotter to preform OS analysis for the 45 genes, and 12 genes associated with survival were eventually identified for subsequent analysis. The results of OS analysis of the 45 genes were showed in Table S2.
Developing an eight-gene signature for predicting OS
After identifying 12 biomarkers significantly correlated to survival of BCs, we further calculated the relative regression coefficient of the 12 genes by performing LASSO analysis. Eight genes including ASPM, C4orf46, CCNB1, DIAPH3, MLF1, MTFR2, NSUN6, and OIP5 were screened out to establish a multi-gene signature on account of the coefficient suggested by the LASSO model (Figure 3A). In addition, we also calculated the risk score (RS) of each sample by combining the relative expression levels (represented by relative expression values) and relative regression coefficients of the genes in the classifier as follows: RS = -0.135 × ASPM expression value - 0.142 × C4orf46 expression value + 0.632 × CCNB1 expression value + 0.105 × DIAPH3 expression value + 0.803 × MLF1 expression value - 0.456 × MTFR2 expression value - 0.287 × NSUN6 expression value + 0.05 × OIP5 expression value. Moreover, among the eight biomarkers, CCNB1, DIAPH3, MLF1, and OIP5 had positive coefficients meanwhile ASPM, C4orf46, MTFR2, and NSUN6 had had negative coefficients. According to the median-RS (RS = 7.373) in training set, 195 samples were divided into high-risk group (n = 97) and low-risk group (n = 98). The result of survival analysis indicated that high-risk group had a poor OS of BC patients (P = 0.015, Figure 3B). In the training set, the AUC values of the eight-gene signature were 0.61 at 1 year, 0.61 at 3 years, as well as 0.61 at 5 years suggested by Figure 3C.
(A) Plot of partial likelihood deviance for the 12 genes associated with survival in the training set. Survival analysis of the association between risk score and overall survival time of BC in (B) training set, (D) internal test set, (F) entire set. Time dependent ROC analyses at 1,3, and 5 years in (C) training set, (E) internal test set, (G) entire set.
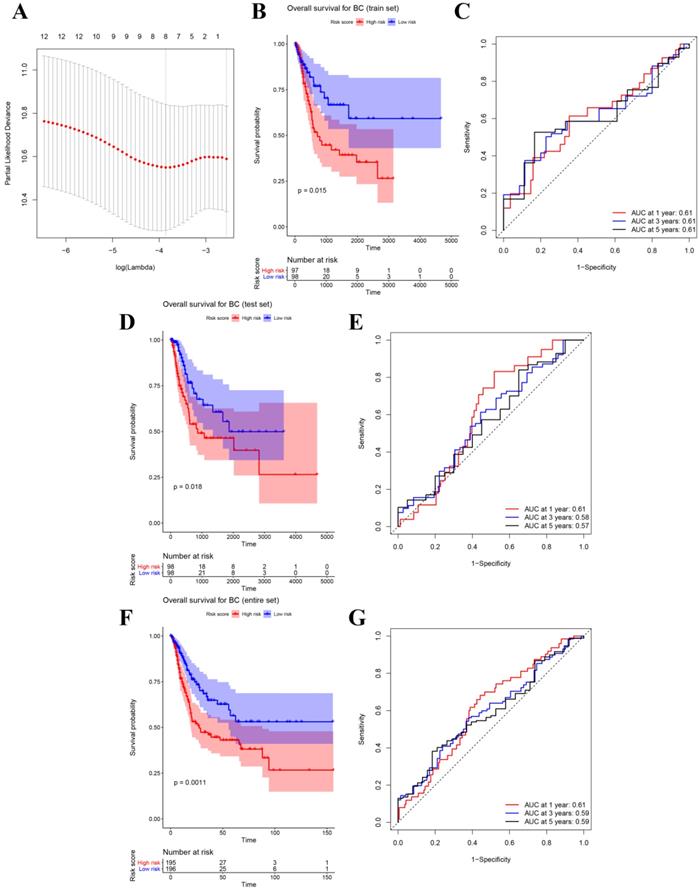
Prognostic value of the eight-gene signature
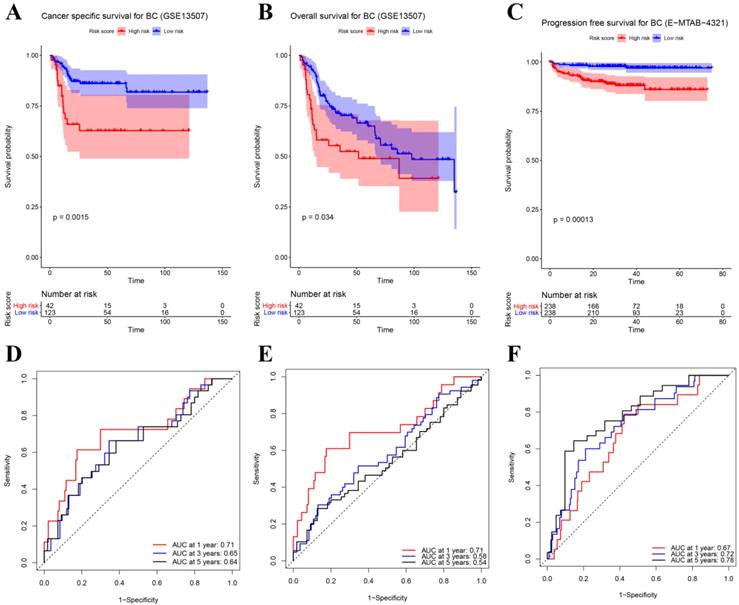
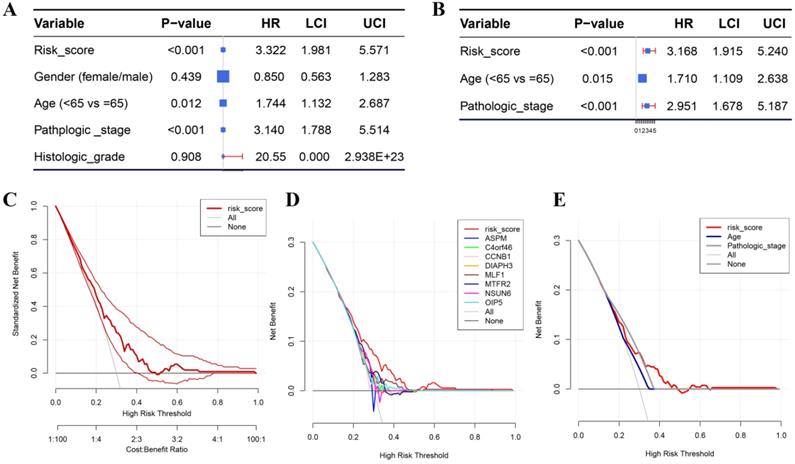
Besides the training set, we also produced 3 validation sets (internal test set, GSE13507 and E-MTAB-4321) to confirm the results we obtained from the training set. With the same methods we mentioned above, we calculated the risk score of each sample in these validation sets and the median-RS in each validation set was set as the cut-off criteria to split samples into high- and low- risk groups (median-RS: internal test set: 7.370; GSE13507: 5.558; E-MTAB-4321: 8.193). According to the result of survival analysis, high-risk group was more correlated to a lower survival rate in internal test set (P = 0.018, Figure 3D), entire set (consisting of the internal test set and training set, P = 0.001, Figure 3F), GSE13507(Cancer-specific survival (CSS): P = 0.002; OS: P = 0.034, Figure 4A-B) and E-MTAB-4321 (Progression-free survival (PFS): P < 0.001, Figure 4C). Moreover, the prognostic accuracy of the eight-gene signature in the internal test set was 0.61 at 1 year, 0.58 at 3 years, and 0.57 at 5 years as shown in Figure 3E (entire set: 0.61 at 1 year, 0.59 at 3 years, and 0.59 at 5 years (Figure 3G)). The AUC values of the multi-gene signature for CSS in GSE13507 were 0.71 at 1 year, 0.65 at 3 years, and 0.64 at 5 years meanwhile 0.71 at 1 year, 0.58 at 3 years, and 0.54 at 5 years for OS (Figure 4D-E). In addition, as shown in Figure 4F, the prognostic accuracy of the 8-gene signature in E-MTAB-4321 was 0.67 at 1 year, 0.72 at 3 years and 0.78 at 5 years. Furthermore, the eight-gene signature and significant clinical factors were included in the univariate Cox analysis. Figure 5A indicated that risk score (Hazard Ratio(HR) = 3.322, 95%CI: 1.981-5.571, P < 0.001), age (HR = 1.744, 95%CI: 1.132-2.687, P = 0.012) and pathologic stage (HR = 3.140, 95%CI: 1.788-5.514, P < 0.001) were influential features of OS among those important factors, which were used for multivariate Cox analysis. The result of multivariate Cox analysis suggested that these three variables were still associated with OS of BC patients even through the adjustment of other features (Figure 5B). In addition, the DCA analysis indicated that this eight-gene signature showed good potential for clinical application whatever the Threshold Probability (Pt) as shown in Figure 5C. Furthermore, although this signature also showed better performance than any other single biomarker (Figure 5D), we could not distinguish this signature from age and pathologic stage well when Pt was approximately less than 0.35 (Figure 5E).
(A) Survival analysis of the association between risk score and cancer-specific survival (CSS) time of BC in GSE13507. (B) Survival analysis of the association between risk score and overall survival (OS) time of BC in GSE13507. (C) Survival analysis of the association between risk score and progression-free survival time of BC in E-MTAB-4321. Time dependent ROC analyses at 1,3, and 5 years in (D) GSE13507-CSS, (E) GSE13507-OS, (F) E-MTAB-4321.
(A) Forest plot summary of analyses of OS univariate analysis of Risk score, gender, age, pathologic stage and histologic grade by using TCGA-BC data. (B) Forest plot summary of analyses of OS univariate analysis of Risk score, age and pathologic stage by using TCGA-BC data. DCA for assessment of the clinical utility of the 8-gene signature (C), single biomarkers (D), and clinical factors (E). The x‐axis represents the percentage of threshold probability, and the y‐axis represents the net benefit. DCA: decision curve analysis.
Nomogram construction and its clinical utility
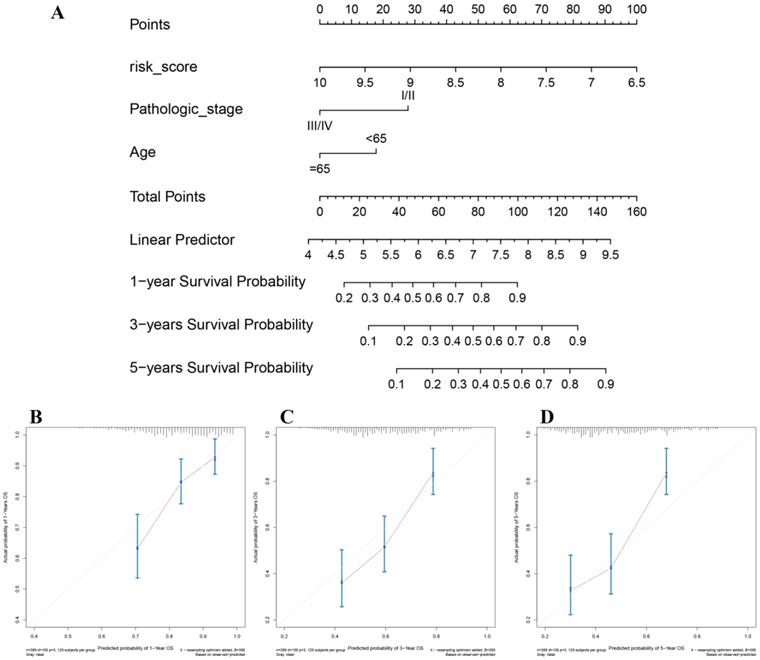
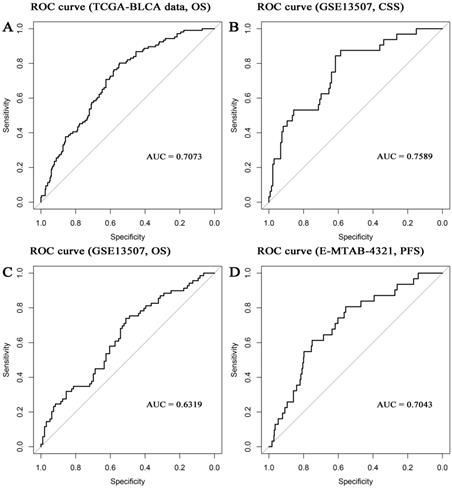
In the present study, the 8-gene signature, pathologic stage, and age were incorporated to construct a nomogram with the aim of creating a quantitative method for the possibility prediction of the OS at 1, 3, and 5 years for patients with BC (Figure 6A). In the calibration curve, diagonal line (ideal model) represented the best prediction. Nomogram-predicted probability of survival was plotted on the x-axis meanwhile the actual survival was plotted on the y-axis. The higher the coincidence degree of the fitting line (red line) and the diagonal line was the better performance the nomogram exhibited. According to the calibration curve, the nomogram owned fine prediction effectiveness compared with the ideal model especially for nomogram's 1-year or 3-year OS estimates (Figure 6B-D). In the nomogram, lower total points indicated a worse outcome. The nomogram showed high accuracy as the C-index and AUC suggested. This nomogram could effectively predict OS of patients with BC by using TGCA-BLCA data (C-index: 0.671; AUC: 0.707; Figure 7A) and GSE13507 (C-index: 0.666; AUC: 0.632; Figure 7C). The C-index was 0.772 and AUC was 0.759 accurately (based on GSE13507; Figure 7B), which determined that the nomogram also performed well to predict CSS as well as PFS (E-MTAB-4321: C-index: 0.708; AUC: 0.704; Figure 7D).
The nomogram for predicting proportion of patients with 1-, 3- or 5-year OS (A). The calibration plots for predicting 1- (B), 3- (C) or 5- (D) year OS.
Receiver operating characteristic (ROC) curves and area under the curve (AUC) statistics to evaluate the diagnostic efficiency of the nomogram in TCGA-BLCA data (A, overall survival (OS)), GSE13507 (B, cancer-specific survival (CSS)), GSE13507 (C, OS), and E-MTAB-4321 (D, progression-free survival (PFS)).
Identification of eight-gene signature associated biological pathways
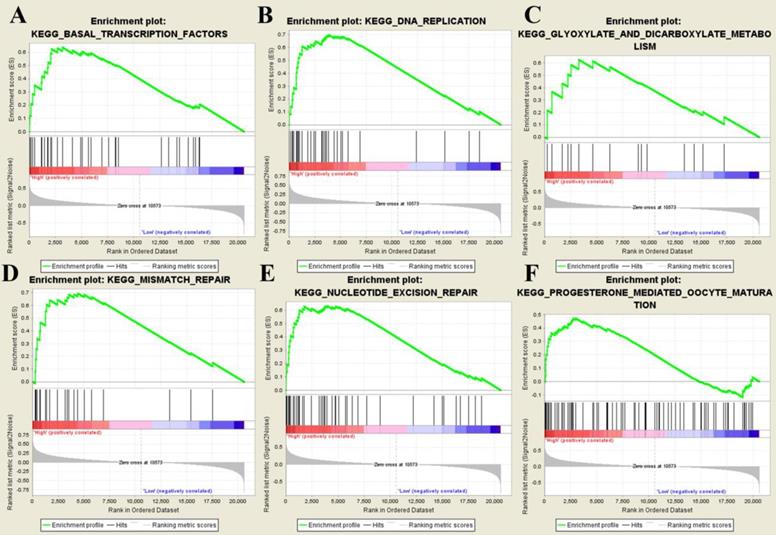
After splitting samples into high- and low- risk groups, we further performed GSEA based on GSE31684. Six risk score-related KEGG signaling pathways including basal transcription factors, DNA replication, glyoxylate and dicarboxylate metabolism, mismatch repair, nucleotide excision repair, and progesterone-mediated oocyte maturation were enriched as shown in Figure 8.
Gene set enrichment analysis. The six significant KEGG pathways including basal transcription factors (A), DNA replication (B), glyoxylate and dicarboxylate metabolism (C), mismatch repair (D), nucleotide excision repair (E), and progesterone-mediated oocyte maturation (F).
Discussion
As the 10th most common form of cancer worldwide, BC carries a poor prognosis with an estimated 549,000 new cases and 200,000 deaths [1]. Until now, cystoscopy is still the golden standard for diagnosis of BC [22]. BC has caused a lot of troubles; the most major problem is that BC is of high rate of recurrence. 30-70% of BCs will relapse as reported [23]. Thus, we aimed to screen several effective biomarkers and further establish a multi-gene signature for the prognosis of patients with BC.
With the development of high-throughput sequencing and bioinformatics, more and more bioinformatics methods have been used to develop novel biomarkers associated with tumor progression [24], survival [25] or prognosis [26] of malignancies, which might greatly aid the early diagnosis and evaluation of prognosis in malignant tumors. Among these methods, WGCNA has been successfully applied in the identification of novel diagnostic and prognostic biomarkers for malignancies [27, 28]. We have made great efforts to apply this method in finding out prognosis biomarkers of patients with BC in our previous study [29]. Therefore, we started with identifying key modules in this study by constructing a co-expression network and 12 genes associated with overall survival of BC were further selected by using Kaplan-Meier Plotter. Considering that a lot of studies have focused on establishing a multi-gene signature rather than using a single biomarker as a diagnostic or prognostic biomarker in present [30, 31], we attempted to develop a multi-gene signature in this study. LASSO is a more popular approach compared with Cox proportional hazard regression analysis for constructing prognostic gene signature models, with an advantage of preventing overfitting [32]. Thus, based on the 12 biomarkers, we established an eight-gene signature which could predict prognosis of BC patients by constructed a LASSO Cox model. We further validated this signature by performing survival analysis and ROC analysis based on three other independent datasets (test set, GSE13507, E-MTAB-4321). We firstly divided patients into high- and low- risk groups according to the risk score of each patient. In the training set, the eight-gene-based classifier had the ability to distinguish the high-risk group patients from those in the low-risk group effectively. The results of survival analysis and ROC curve in the validation datasets were consistent with our findings in the training set, which made our results convincing.
Previous study had proved that tumor stage was significant associated with patient prognosis [33]. The incidence of BC increased with age, with high risk age from 50 to 70 [34]. Our study indicated that both of tumor stage and age were significant prognostic features by performing Cox regression analysis using the TCGA-BLCA data, which was consistent with the results from previous studies. Interestingly, we found that this signature was not only independent of tumor stage and age, but also was associated with OS even had been adjusted by other clinical features. These results demonstrated that the signature could distinguish high- and low- risk groups well, which might have great predictive value of prognosis for patients with BC.
The biological role of genes in the multi-gene signature was explored by performing GSEA analysis. Six KEGG pathways were finally identified including basal transcription factors, DNA replication, glyoxylate and dicarboxylate metabolism, mismatch repair, nucleotide excision repair, and progesterone mediated oocyte maturation. We further explore genes in this signature by carrying out a literature review. Abnormal spindle microtubule assembly (ASPM), the human ortholog of the Drosophila melanogaster 'abnormal spindle' gene (asp), was the most common mutant gene associated with microcephaly primary type 5 [35]. ASPM was essential for normal mitotic spindle function, which could correctly guide the movement of spindles and maintain symmetric division of cytoplasm in mitosis [36]. ASPM was found to up-regulate in some malignancies, such as breast cancer and gastric cancer [37]. Some studies proved that the up-regulation of ASPM was associated with invasion, recurrence and poor prognosis of tumors [38, 39]. Chromosome 4 open reading frame 46 (C4orf46), also known as renal cancer differentiation gene 1 (RCDG1), encoded a small, conserved protein of unknown function which was expressed in some tissues [40]. RCDG1 was significantly down-regulated in renal cell carcinoma (RCC) suggested by a recent study [40]. As for cyclin B1 (CCNB1), the protein encoded by cyclin B1 (CCNB1) was a regulatory protein involved in mitosis, which was necessary for proper control of the G2/M transition phase in cell cycle [41]. CCNB1 could combine with p34 (cdc2) and further form the maturation-promoting factor (MPF) [42]. As for diaphanous related formin 3 (DIAPH3), the protein encoded by this gene was a binding protein of actin, which participated in composing cytoskeleton proteins [43]. DIAPH3 played an important role in the infiltration and metastasis of cancerous cells, which might be a potential therapeutic target for cancer treatment [44]. Myeloid leukemia factor 1 (MLF1) encoded an oncoprotein which was associated with the phenotypic determination of hemopoietic cells [45]. Previous study had proved that the translocations between MLF1 and nucleophosmin were related to myelodyplastic syndrome and acute myeloid [46]. Mitochondrial fission regulator 2 (MTFR2) was poor studied in malignancies, a recent study identified this gene as one of the most correlated genes to dual specificity protein kinase TTK (TTK) in glioblastoma (GBM) [47]. Expression of TTK was up-regulated in GBM, which was thought to be associated with poor prognosis of patients with GBM [47]. NOP2/Sun RNA methyltransferase 6 (NSUN6) was a human RNA methyltransferase that catalyzed formation of m5C72 in specific tRNAs [48]. NSUN6 localized to the cytoplasm, which was largely colocalized with marker proteins for the Golgi apparatus and pericentriolar matrix [49]. Opa interacting protein 5 (OIP5) was a member of cancer-testis antigen (CTA) family, which might be a novel therapeutic target for cancer therapy because of the high expression of this gene in colorectal cancer [49], lung cancer [50], and esophageal cancer [50]. Protein encoded by OIP5 was essential for recruitment of centromere protein A (CENPA) by the mediator Holliday junction recognition protein in centromeres [51].
Although our conclusions have been well validated by multiple independent data sets, we have not further validated our conclusions through large-scale prospective clinical and molecular biology experiments, which we believe may be the largest limitation in this study. So, we will conduct large-scale prospective clinical trials and molecular biology experiments in subsequent studies to further confirm our conclusions and related molecular biological mechanisms.
Conclusions
To sum up, we have presented a systematic and comprehensive analysis for data from TCGA, GEO, and ArrayExpress databases by using WGCNA and LASSO as the main methods. We identified 12 genes associated with overall survival of BC patients and further developed an eight-gene signature which was of great value to predict prognosis of BC. This eight-gene-based classifier might be of great value for making prognostic evaluations. However, the eight-gene signature must be validated by using clinical trials and more advanced methods in bioinformatics field.
Abbreviations
ASPM: Abnormal spindle microtubule assembly; AUC: Area under curve; BC: Bladder cancer; BP: Biological process; C4orf46: Chromosome 4 open reading frame 46; CCNB1: cyclin B1; CENPA: Centromere protein A; CSS: Cancer-specific survival; CTA: cancer-testis antigen; DCA: Decision curve analysis; DIAPH3: Diaphanous related formin 3; GBM: glioblastoma; GEO: Gene Expression Omnibus; GO: Gene Ontology; GS: Gene Significance; GSEA: Gene set enrichment analysis; KEGG: Kyoto Encyclopedia of Genes and Genomes; LASSO: Least absolute shrinkage and selection operator; MLF1: Myeloid leukemia factor 1; MPF: maturation-promoting factor; MS: Module Significance; MTFR2: Mitochondrial fission regulator 2; NSUN6: NOP2/Sun RNA methyltransferase 6; OIP5: Opa interacting protein 5; OS: Overall survival; Pt: Threshold Probability; RCDG1: Renal cancer differentiation gene 1; ROC: Receiver operating characteristic; RS: Risk score; TCGA: The Cancer Genome Atlas; WGCNA: Weighted gene co-expression network analysis.
Supplementary Material
Supplementary figures and tables.
Acknowledgements
We would like to acknowledge the TCGA and GEO database developed by the National Institutes of Health (NIH).
Funding
This work was supported by the Zhongnan Hospital of Wuhan University Science, Technology and Innovation Seed Fund (znpy2017050) and the 351 Talent Project of Wuhan University (Luojia Young Scholars: SL); and National Natural Science Foundation of China (81802541).
Author's contributions
S. L., and T. L. conceived and designed the study, X. Y., Z. G., and X. L. performed the analysis procedures, X. Y., Z. G., X. F., and X. L. analyzed the results, S. L., and T. L. contributed analysis tools, X. Y. contributed to the writing of the manuscript. All authors reviewed the manuscript.
Competing Interests
The authors have declared that no competing interest exists.
References
1. Bray F, Ferlay J, Soerjomataram I, Siegel RL, Torre LA, Jemal A. Global cancer statistics 2018: GLOBOCAN estimates of incidence and mortality worldwide for 36 cancers in 185 countries. CA Cancer J Clin. 2018;68:394-424
2. Matsuda T, Hori M. Five-year relative survival rate of bladder cancer in the USA, Europe and Japan. Jpn J Clin Oncol. 2014;44:776
3. Di Y, Chen D, Yu W, Yan L. Bladder cancer stage-associated hub genes revealed by WGCNA co-expression network analysis. Hereditas. 2019;156:7
4. Shi S, Tian B. Identification of biomarkers associated with progression and prognosis in bladder cancer via co-expression analysis. Cancer Biomark. 2019;24:183-193
5. Kamat AM, Hahn NM, Efstathiou JA, Lerner SP, Malmstrom PU, Choi W. et al. Bladder cancer. Lancet. 2016;388:2796-2810
6. Meng XY, Shi MJ, Zeng ZH, Chen C, Liu TZ, Wu QJ. et al. The role of col5a2 in patients with muscle-invasive bladder cancer: a bioinformatics analysis of public datasets involving 787 subjects and 29 cell lines. Front Oncol. 2018;8:659
7. Riester M, Taylor JM, Feifer A, Koppie T, Rosenberg JE, Downey RJ. et al. Combination of a novel gene expression signature with a clinical nomogram improves the prediction of survival in high-risk bladder cancer. Clin Cancer Res. 2012;18:1323-1333
8. Guillaume A, Eric L, Martin F, Anne J, Windy L, Hanin O. et al. Integrated genomic characterization of adrenocortical carcinoma. Nat Genet. 2014;46:607-612
9. Kim WJ, Kim EJ, Kim SK, Kim YJ, Ha YS, Jeong P. et al. Predictive value of progression-related gene classifier in primary non-muscle invasive bladder cancer. Mol Cancer. 2010;9:3
10. Lee JS, Leem SH, Lee SY, Kim SC, Park ES, Kim SB. et al. Expression signature of E2F1 and its associated genes predict superficial to invasive progression of bladder tumors. J Clin Oncol. 2010;28:2660-2667
11. Love MI, Huber W, Anders S. Moderated estimation of fold change and dispersion for RNA-seq data with DESeq2. Genome Biology. 2014;15:550
12. Gautier L, Cope LBolstad BM, Irizarry RA. affy - analysis of Affymetrix GeneChip data at the probe level. Bioinformatics. 2004;20:307-315
13. Langfelder P, Horvath S. WGCNA: an R package for weighted correlation network analysis. BMC Bioinformatics. 2008;9:559
14. Yu G, Wang LG, Han Y, He QY. clusterProfiler: an R package for comparing biological themes among gene clusters. Omics. 2012;16:284-287
15. Jerome F, Trevor H, Robert T. Regularization Paths for Generalized Linear Models via Coordinate Descent. Journal of Statistical Software. 2010;33:1-22
16. Therneau TM. survival: Survival Analysis. Technometrics. 2015;46:111-112
17. Paul B, Jean-Francois D, Helene JG. Estimating and Comparing time-dependent areas under receiver operating characteristic curves for censored event times with competing risks. Statistics in Medicine. 2013;32:5381-5397
18. Gordon M, Lumley T. forestplot: Advanced Forest Plot Using 'grid' Graphics. 2016.
19. Vickers AJ, Elkin EB. Decision curve analysis: a novel method for evaluating prediction models. Med Decis Making. 2006;26:565
20. Robin X, Turck N, Hainard A, Tiberti N, Lisacek F, Sanchez JC. et al. pROC: an open-source package for R and S+ to analyze and compare ROC curves. BMC Bioinformatics. 2011;12:77
21. Subramanian A, Tamayo P, Mootha VK, Mukherjee S, Ebert BL, Gillette MA. et al. Gene set enrichment analysis: a knowledge-based approach for interpreting genome-wide expression profiles. Proc Natl Acad Sci U S A. 2005;102:15545-50
22. Sun M, Trinh QD. Diagnosis and staging of bladder cancer. Hematol Oncol Clin North Am. 2015;29:205-218
23. Hussein AA, Dibaj S, Hinata N, Field E, O'Leary K, Kuvshinoff B. et al. Development and validation of a quality assurance score for robot-assisted radical cystectomy: a 10-year analysis. Urology. 2016;97:124-129
24. Wu P, Liu JL, Pei SM, Wu CP, Yang K, Wang SP. et al. Integrated genomic analysis identifies clinically relevant subtypes of renal clear cell carcinoma. BMC Cancer. 2018;18:287
25. Li S, Liu X, Liu T, Meng X, Yin X, Fang C. et al. Identification of biomarkers correlated with the tnm staging and overall survival of patients with bladder cancer. Front Physiol. 2017;8:947
26. Zhu Z, Jin Z, Deng Y, Wei L, Yuan X, Zhang M. et al. Co-expression network analysis identifies four hub genes associated with prognosis in soft tissue sarcoma. Front Genet. 2019;10:37
27. Zhao B, You Y, Wan Z, Ma Y, Huo Y, Liu H. et al. Weighted correlation network and differential expression analyses identify candidate genes associated with BRAF gene in melanoma. BMC Med Genet. 2019;20:54
28. Li Q, Chen W, Song M, Chen W, Yang Z, Yang A. Weighted gene co-expression network analysis and prognostic analysis identifies hub genes and the molecular mechanism related to head and neck squamous cell carcinoma. Cancer Biol Ther. 2019;20:750-759
29. Yan X, Guo ZX, Liu XP, Feng YJ, Zhao YJ, Liu TZ. et al. Four novel biomarkers for bladder cancer identified by weighted gene coexpression network analysis. J Cell Physiol. 2019;234:19073-19087
30. Zhang Y, Li H, Zhang W, Che Y, Bai W, Huang G. LASSO based CoxPH model identifies an 11-lncRNA signature for prognosis prediction in gastric cancer. Mol Med Rep. 2018;18:5579-5593
31. Ma X, Tao R, Li L, Chen H, Liu Z, Bai J. et al. Identification of a 5-microRNA signature and hub miRNA-mRNA interactions associated with pancreatic cancer. Oncol Rep. 2019;41:292-300
32. Goeman JJ. L1 penalized estimation in the Cox proportional hazards model. Biom J. 2010;52:70-84
33. Veeratterapillay R, Simren R, El-Sherif A, Johnson MI, Soomro N, Heer R. Accuracy of the revised 2010 TNM classification in predicting the prognosis of patients treated for renal cell cancer in the north east of England. J Clin Pathol. 2012;65:367-371
34. Turati F, Bosetti C, Polesel J, Serraino D, Montella M, Libra M. et al. Family history of cancer and the risk of bladder cancer: A case-control study from Italy. Cancer Epidemiol. 2017;48:29-35
35. Bond J, Roberts E, Mochida GH, Hampshire DJ, Scott S, Askham JM. et al. ASPM is a major determinant of cerebral cortical size. Nat Genet. 2002;32:316-320
36. Khan MA, Windpassinger C, Ali MZ, Zubair M, Gul H, Abbas S. et al. Molecular genetic analysis of consanguineous families with primary microcephaly identified pathogenic variants in the ASPM gene. J Genet. 2017;96:383-387
37. Kouprina N, Pavlicek A, Collins NK, Nakano M, Noskov VN, Ohzeki J. et al. The microcephaly ASPM gene is expressed in proliferating tissues and encodes for a mitotic spindle protein. Hum Mol Genet. 2005;14:2155-2165
38. Lin SY, Pan HW, Liu SH, Jeng YM, Hu FC, Peng SY. et al. ASPM is a novel marker for vascular invasion, early recurrence, and poor prognosis of hepatocellular carcinoma. Clin Cancer Res. 2008;14:4814-4820
39. Alsiary R, Bruning-Richardson A, Bond J, Morrison EE, Wilkinson N, Bell SM. Deregulation of microcephalin and ASPM expression are correlated with epithelial ovarian cancer progression. Plos One. 2014;9:e97059
40. Yu Z, Ni L, Chen D, Su Z, Yu W, Zhang Q. et al. Expression and clinical significance of RCDG1 in renal cell carcinoma: a novel renal cancer associated gene. Mol Med Rep. 2014;10:1583-1589
41. Petrachkova T, Wortinger LA, Bard AJ, Singh J, Warga RM, Kane DA. Lack of Cyclin B1 in zebrafish causes lengthening of G2 and M phases. Dev Biol. 2019;451:167-179
42. Zhang H, Zhang X, Li X, Meng WB, Bai ZT, Rui SZ. et al. Effect of CCNB1 silencing on cell cycle, senescence, and apoptosis through the p53 signaling pathway in pancreatic cancer. J Cell Physiol. 2018;234:619-631
43. Hager MH, Morley S, Bielenberg DR, Gao S, Morello M, Holcomb IN. et al. DIAPH3 governs the cellular transition to the amoeboid tumour phenotype. Embo Mol Med. 2012;4:743-760
44. Morley S, You S, Pollan S, Choi J, Zhou B, Hager MH. et al. Regulation of microtubule dynamics by DIAPH3 influences amoeboid tumor cell mechanics and sensitivity to taxanes. Sci Rep. 2015;5:12136
45. Nakamae I, Kato JY, Yokoyama T, Ito H, Yoneda-Kato N. Myeloid leukemia factor 1 stabilizes tumor suppressor C/EBPalpha to prevent Trib1-driven acute myeloid leukemia. Blood Adv. 2017;1:1682-1693
46. Naoe T, Suzuki T, Kiyoi H, Urano T. Nucleophosmin: a versatile molecule associated with hematological malignancies. Cancer Sci. 2006;97:963-969
47. Wang J, Xie Y, Bai X, Wang N, Yu H, Deng Z. et al. Targeting dual specificity protein kinase TTK attenuates tumorigenesis of glioblastoma. Oncotarget. 2018;9:3081-3088
48. Haag S, Warda AS, Kretschmer J, Gunnigmann MA, Hobartner C, Bohnsack MT. NSUN6 is a human RNA methyltransferase that catalyzes formation of m5C72 in specific tRNAs. Rna. 2015;21:1532-1543
49. Li J, Li H, Long T, Dong H, Wang ED, Liu RJ. Archaeal NSUN6 catalyzes m5C72 modification on a wide-range of specific tRNAs. Nucleic Acids Res. 2019;47:2041-2055
50. Koinuma J, Akiyama H, Fujita M, Hosokawa M, Tsuchiya E, Kondo S. et al. Characterization of an Opa interacting protein 5 involved in lung and esophageal carcinogenesis. Cancer Sci. 2012;103:577-586
51. Li B, Pu K, Wu X. Identifying novel biomarkers in hepatocellular carcinoma by weighted gene co-expression network analysis. J Cell Biochem. 2019 [Epub ahead of print]
Author contact
![]() Corresponding author: Sheng Li, Department of Biological Repositories, Zhongnan Hospital of Wuhan University, 169 Donghu Road, Wuhan 430071, China. Email address: lisheng-znyyedu.cn
Corresponding author: Sheng Li, Department of Biological Repositories, Zhongnan Hospital of Wuhan University, 169 Donghu Road, Wuhan 430071, China. Email address: lisheng-znyyedu.cn