Impact Factor ISSN: 1837-9664

 Global reach, higher impact
J Cancer 2020; 11(5):1182-1194. doi:10.7150/jca.37313 This issue Cite
Research Paper
Enhanced expression of FCER1G predicts positive prognosis in multiple myeloma
Lin Fu1,2,3, Zhiheng Cheng4, Fen Dong5, Liang Quan1,2, Longzhen Cui6, Yan Liu6, Tiansheng Zeng7, Wenhui Huang1,2, Jinghong Chen2, Ying Pang1, Xu Ye1, Guangsheng Wu8, Tingting Qian1,2 ![]() , Yang Chen9
, Yang Chen9 ![]() , Chaozeng Si10
, Chaozeng Si10 ![]()
1. Department of Hematology, The Second Affiliated Hospital of Guangzhou Medical University, Guangzhou, 510260, China.
2. Translational Medicine Center, State Key Laboratory of Respiratory Disease, The Second Affiliated Hospital of Guangzhou Medical University, Guangzhou 510260, China.
3. Department of Hematology, Huaihe Hospital of Henan University, Kaifeng, China.
4. Department of Pathology and Medical Biology, University Medical Center Groningen, University of Groningen, Groningen, Netherlands.
5. Institute of Clinical Medical Sciences, China-Japan Friendship Hospital, Beijing, 100029, China.
6. Translational Medicine Center, Huaihe Hospital of Henan University, Kaifeng, China.
7. Department of Biomedical Sciences, University of Sassari, Sassari, 07100, Italy.
8. Department of Hematology, First Affiliated Hospital, Medical College of Shihezi University, Shihezi 832008, China.
9. MOE Key Laboratory of Bioinformatics; Bioinformatics Division and Center for Synthetic & Systems Biology, TNLIST; Department of Automation, Tsinghua University, Beijing, 100084, China.
10. Department of Operations and Information Management, China-Japan Friendship Hospital, Beijing, 100029, China.
Received 2019-6-4; Accepted 2019-11-3; Published 2020-1-1
Abstract
Background: Multiple myeloma (MM) is the second most common hematologic malignancy worldwide and does not have sufficient prognostic indicators. FCER1G (Fc fragment Of IgE receptor Ig) is located on chromosome 1q23.3 and is involved in the innate immunity. Early studies have shown that FCER1G participates in many immune-related pathways encompassing multiple cell types. Meanwhile, it is associated with many malignancies. However, the relationship between MM and FCER1G has not been studied.
Methods: In this study, we integrated nine independent gene expression omnibus (GEO) datasets and analyzed the associations of FCER1G expression and myeloma progression, ISS stage, 1q21 amplification and survival in 2296 myeloma patients and 48 healthy donors.
Results: The expression of FCER1G showed a decreasing trend with the advance of myeloma. As ISS stage and 1q21 amplification level increased, the expression of FCER1G decreased (P = 0.0012 and 0.0036, respectively). MM patients with high FCER1G expression consistently had longer EFS and OS across three large sample datasets (EFS: P = 0.0057, 0.0049, OS: P = 0.0014, 0.00065, 0.0019 and 0.0029, respectively). Meanwhile, univariate and multivariate analysis indicated that high FCER1G expression was an independent favorable prognostic factor for EFS and OS in MM patients (EFS: P = 0.006, 0.027, OS: P =0.002,0.025, respectively).
Conclusions: The expression level of FCER1G negatively correlated with myeloma progression, and high FCER1G expression may be applied as a favorable biomarker in MM patients.
Keywords: Multiple myeloma, FCER1G, Prognosis, Gene expression profile, Bioinformatics analysis
Background
Multiple myeloma (MM) is a hematologic malignancy characterized by the monoclonal expansion of bone marrow plasma cells (BMPCs) [1-3]. The International Staging System (ISS) divides MM into three categories based on the levels of β2-microglobulin and albumin at diagnosis, which are surrogate markers of tumor burden. Additionally, 1q21 amplification is considered a high-risk genetic feature, which is the most common chromosomal aberration in MM [4, 5]. In recent years, genetic biomarkers are starting to play an increasingly important role in the prognosis of myeloma [6, 7]. Therefore, it is necessary to investigate novel biomarkers to predict the prognosis of MM, so as to help improve the prognostication and treatment of MM.
FCER1G is a protein coding gene located on chromosome 1q23.3 [8]. It has been reported that FCER1G interacts with other factors and participates in various nuclear pathways [9]. Specifically, FCER1G is a constitutive component of the high-affinity immunoglobulin E (IgE) receptor and interleukin-3 receptor complex. It is mainly involved in mediating the allergic inflammatory signaling of mast cells, selectively mediating the production of interleukin 4 (IL4) by basophils, and initiating the transfer from T-cells to the effector T-helper 2 subset [10, 11]. It also forms a functional signaling complex together with the pattern recognition receptors CLEC4D and CLEC4E in myeloid cells. Previous studies have shown that FCER1G is an innate immunity gene and may be involved in the development of eczema, meningioma and childhood leukemia [12-14]. FCER1G is associated with the progression of clear cell renal cell carcinoma (ccRCC) and may improve prognosis by affecting the immune-related pathways. In addition, FCER1G is underexpressed in acute myeloid leukemia [15]. Moreover, FCER1G is a critical molecule in signaling pathways that are widely involved in a variety of immune responses and cell types [16]. However, the prognostic role of FCER1G in MM remains largely unknown.
Here, we explored the relationship between FCER1G expression and myeloma progression, ISS stage, 1q21 amplification, and survival, using the gene expression data of 2296 MM patients and 48 healthy donors. We were able to demonstrate that high expression of FCER1G was a good indicator of MM and was related to positive outcomes.
Methods
Data source
In this study, we selected 2296 myeloma patients and 48 healthy donors from the Gene Expression Omnibus database (GEO). In order to assess the relationship between FCER1G expression and the prognosis of MM patients, the sample was divided into two cohorts. In the first cohort, there were six independent microarray datasets (GSE39754, GSE5900, GSE2113, GSE6477, GSE47552, GSE13591). This cohort included 48 healthy donors and 640 MM patients in different stages of monoclonal gammopathy (104 monoclonal gammopathy of undetermined significance (MGUS), 69 smoldering myeloma (SMM), 452 multiple myeloma (MM) and 15 plasma cell leukaemia (PCL)). This cohort was used for microarray expression analysis.
The second cohort consisted of three big independent microarray datasets of MM patients, GSE2658, GSE4204 and GSE24080. In GSE2658, the gene expression data of 559 MM patients was evaluated by the Affymetrix Human Genome U133 Plus 2.0 Array. Samples in GSE4204 were pre-treatment bone marrow aspirates from 538 MM patients. In GSE24080, the gene expression profiling of highly purified bone marrow plasma cells was performed in 559 newly diagnosed MM patients. This cohort was mainly used for survival analysis, and the expression of FCER1G in different 1q21 amplification levels and different ISS stages was also described.
All the samples were classified according to the International Myeloma Working Group criteria [17]. The diagnosis of MM (ICD-10 C90.0) was established in accordance with the World Health Organization guidelines[18]. The diagnosis of MGUS require more than 10% plasma cell infiltration in the bone marrow, while the levels of monoclonal protein could not exceed 30 g/L and there would be no evidence of related organ or tissue impairment (ROTI) defined as hypercalcemia, renal impairment, anemia, or bone lesions attributed to plasma-cell proliferation. SMM was defined with bone marrow plasmacytosis exceeding 10%, monoclonal protein level greater than 30 g/L, in the absence of ROTI [19]. The diagnostic definition of PCL is based on Kyle's criteria, where peripheral blood plasma cell absolute count greater than 2 × 10⁹/L or percentage of the while blood cells more than 20% [20, 21].
In GSE39754, the DNA microarray data of CD138+ myeloma cells from 170 newly diagnosed MM patients, and plasma cells (PCs) from 6 normal donors, were quality controlled and normalized with the aroma Affymetrix package. The gene expression level was estimated with a probe level model (PLM) [22]. In GSE5900, International Myeloma Working Group criteria were used to classify patients as having MGUS, SMM, or symptomatic MM [19]. In GSE6477, Bone marrow aspirate samples were obtained and enriched for CD138+ cells. In GSE64552, bone marrow samples were obtained from 20 patients with MGUS, 33 with high-risk SMM and 41 with MM. All samples corresponded to newly diagnosed untreated patients [22]. In GSE2113, the gene expression profiles of purified plasma cells (PCs) were purified from bone marrow Series, after red blood cell lysis with 0.86% ammonium chloride, using CD138 immunomagnetic microbeads [22]. In GSE13591, pathological bone marrow specimens from 41 MM and 4 plasma cell leukemia (PCL) patients at diagnosis (27 males; median age 67 years, range 46-85) were obtained. The plasma cells of the samples were purified (≥90%) from the bone marrow samples. Samples in GSE2658 and GSE4204 were pre-treatment bone marrow aspirates from multiple myeloma patients [23, 24]. The GSE24080 dataset was contributed by the Myeloma Institute for Research and Therapy at the University of Arkansas for Medical Sciences (UAMS, Little Rock, AR, USA). Gene expression profiling of highly purified bone marrow plasma cells was performed in newly diagnosed patients with MM. Plasma cells were enriched by anti-CD138 immunomagnetic bead selection of mononuclear cell fractions of bone marrow aspirates in a central laboratory [25].
All clinical and molecular information and microarray datasets of these patients were publicly accessible at the Gene Expression Omnibus (http://www.ncbi.nlm.nih.gov/geo). All experiment design, quality control, and data normalization were in line with the standard Affymetrix protocols. The research was conducted in accordance with the International Conference and the Declaration of Helsinki.
Microarray analysis
All microarray data were identified in GEO, and we employed statistical analysis to investigate significantly abnormally expressed genes on every microarray dataset. Briefly, gene expression data were obtained by using Affymetrix human Genome 133 plus 2.0. All designs and quality control of the microarray experiment and data normalization were in line with the standard Affymetrix protocols. Patients with FCER1G expression values above the median for all MM patients were classified as FCER1Ghigh, and the others were considered to be FCER1Glow. P-value < 0.05 in unpaired t-test analysis and fold change (FC, log2) > 0.5 or < -0.5 was utilized to determine the differential expression of genes (DEGs).
Statistical analysis
All statistical analysis was performed by R software 3.5.0. Each dataset was first evaluated for normality of distribution by the Kolmogorov-Smirnov test to decide whether a non-parametric rank-based analysis or a parametric analysis should be used. The Fisher exact and Wilcoxon rank-sum tests were used to test hypotheses in categorical and continuous variables, respectively. The samples in the second cohort were divided into two groups (FCER1Ghigh, n = 280, FCER1Glow, n = 279) based on the median expression values of FCER1G. Different gene expression analysis was performed by the limma package [26]. The Kaplan-Meier method and Cox regression multivariate analysis were used to estimate the survival analysis, with group comparisons made by using the log-rank test. Clusterprofiler package was used to identify GO enrichment terms and KEGG pathways [27]. For all statistical analysis, P-value< 0.05 was considered significant.
Results
The expression level of FCER1G decreased with the progression of multiple myeloma
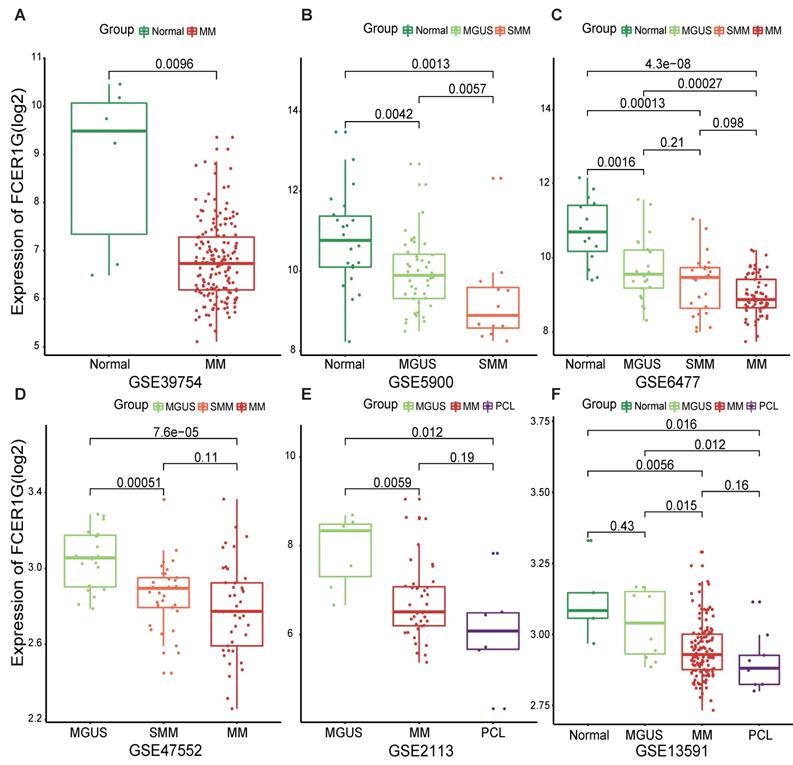
In order to understand the expression of FCER1G in MM patients and other different myeloma stages, we employed six datasets to analyze the expression level of it. We observed that the expression level of FCER1G decreased with the progression of myeloma. Remarkably lower expression of FCER1G was found in 170 MM patients than in 6 normal donors (P = 0.0096, Fig. 1A). In GSE5900, a significant decrease of FCER1G expression in Normal (n = 22), MGUS (n = 44) and SMM (n = 12) was noticed (P = 0.0042, 0.0057, 0.0013, severally, Fig. 1B). An obvious downtrend of FCER1G expression alongside the progression of disease was further validated in GSE6477, including Normal (n = 15), MGUS (n = 22), SMM (n = 24) and MM (n = 69) (P = 0.0016, 0.21, 0.096, 0.00013, 0.00027, 4.3e-08, respectively, Fig. 1C). Moreover, the expression level of FCER1G decreased from MGUS (n = 20) to SMM (n = 33) and MM (n = 41), (P = 0.00051, 0.11, 7.6e-05 severally, Fig. 1D). The same trend was also found in GSE2113 dataset among MGUS (n = 7), MM (n = 39), and PCL (n = 6) (P = 0.0059, 0.19, 0.012, Fig. 1E), as well as in the GSE13591 dataset including normal donor (n = 5), MGUS (n = 11), MM (n = 133) and PCL (n = 9) (Fig. 1F). In summary, the expression of FCER1G decreased with the evolution of monoclonal gammopathy, suggesting that FCER1G might be involved in the malignant progression of myeloma.
The expression level of FCER1G in several GEO datasets of Normal and myeloma patients in different stages. The X-axis represents the sample type, the Y-axis represent FCER1G expression level(log2). A MM patients (n= 170) compared with Normal samples (n= 6). B The different expression of FCER1G in Normal (n= 22), MGUS (n= 44), and SMM (n= 12). C Expression value of FCER1G in Normal (n= 15) and other different stages of 115 myeloma patients. MGUS (n= 22), SMM (n= 24), and MM (n= 69). D FCER1G expression level in different subtypes of myeloma patients. MGUS (n= 20), SMM (n= 33), MM (n= 41). E Comparison of FCER1G expression levels in 3 different stages of myeloma patients: MGUS (n= 7), MM (n= 39), and PCL (n= 6). F The correlation of FCER1G expression level between Normal (n= 5) and 3 different myeloma stages: MGUS (n= 11), MM (n= 133), and PCL (n= 9).
The expression of FCER1G in MM patients between different ISS stages
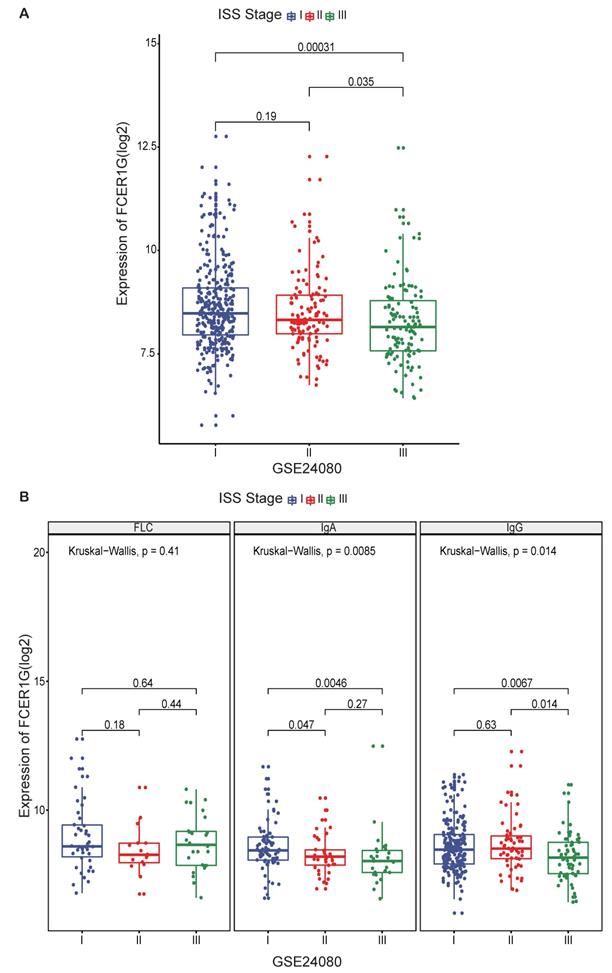
To further investigate the value of FCER1G expression, we compared the expression level of FCER1G at different ISS stages in 559 MM patients. A trend of decreasing FCER1G expression level in stages I, II and III (Fig. 2A, P = 0.19, 0.035, 0.00031). We also compared the expression of FCER1G in different serotypes of different ISS stages. In serum immunoglobulin A (IgA) group and serum immunoglobulin G (IgG) group, the expression of FCER1G in stage I, II and III decreased gradually. However, there was no statistical significance in the serum free light chain (FLC) group (Fig. 2B, FLC: P = 0.41, IgA: P = 0.0085, IgG: P = 0.014, Kruskal-Wallis test). These results indicated that low expression of FCER1G correlated with the severity of MM.
The expression of FCER1G in different ISS stages of MM patients. The X-axis represents the ISS stage while the Y-axis represents FCER1G expression value(log2). A The expression level of FCER1G had a decreasing trend with the ISS stage increases, Kruskal-Wallis test. B FCER1G expression pattern in different serotypes. FLC, P= 0.41, IgA, P= 0.0085, IgG, P= 0.014 respectively, Kruskal-Wallis test.
Differences in clinical and other classic prognostic biomarkers in MM between FCER1Ghigh and FCER1Glow groups
Using the GSE24080 dataset of 559 MM patients, we also analyzed the baseline characteristics between high and low FCER1G expression groups. We divided the samples into two groups based on the median value of FCER1G expression: FCER1Glow (n = 279) and FCER1Ghigh (n = 280). Between the two groups, there are no significant differences in the demographic factors, such as age, gender and race. However, FCER1G was more likely to be associated with isotype (P = 0.019), cytogenetic abnormality (P = 0.021) and different therapy options (P = 0.013). Additionally, the MM patients with low FCER1G expression were more likely to have a higher beta-2 microglobulin (B2M), creatinine (CREAT), aspirate plasma cells (ASPC) ,bone marrow biopsy plasma cells (BMPC) and lower hemoglobin (HGB), which were all important factors in MM prognosis (P< 0.001, = 0.038, < 0.001, < 0.001, = 0.006, respectively). Moreover, the FCER1Glow group was more likely to have a higher expression of CDK4, GPRC5D, HK2, TP53 (P = 0.002, 0.001, 0.005, 0.008, respectively) and lower expression of WT1, CXCL12, DEK, CD74, DAPK3, FGFR3, XBP1, KISS1, IGHG1, MS4A1, RGS13, S1PR1 (P = 0.006, <0.001, <0.001, =0.001, =0.004, <0.001, <0.001, =0.01, <0.001, <0.001, <0.001, <0.001) (Table 1).
Patients' characteristics in the GSE24080 dataset of 559 MM patients according to FCER1G expression levels.
| FCER1Glow, n=279 | FCER1Ghigh, n=280 | P-value | ||
|---|---|---|---|---|
| AGE, mean(range) | 57.39(29.70-76.50) | 56.97(24.83-75) | 0.787 | |
| Gender (%) | female | 116(41.58) | 106(37.86) | 0.417 |
| male | 163(58.42) | 174(62.14) | ||
| RACE (%) | other | 27(9.68) | 35(12.5) | 0.353 |
| white | 252(90.32) | 245(87.5%) | ||
| ISOTYPE (%) | FLC | 35(12.54) | 49(17.50) | 0.019 |
| IgA | 79(28.32) | 54(19.29) | ||
| IgG | 148(53.05) | 165(58.93) | ||
| B2M (mean(sd)) | 5.625(6.62) | 3.842(3.53) | <0.001 | |
| CRP (mean(sd)) | 11.986(24.25) | 11.278(21.72) | 0.717 | |
| CREAT (mean(sd)) | 1.434(1.46) | 1.211(1.05) | 0.038 | |
| LDH (mean(sd)) | 173.05(69.06) | 170.907(62.77) | 0.701 | |
| ALB (mean(sd)) | 4.033(0.58) | 4.065(0.59) | 0.511 | |
| HGB (mean(sd)) | 11.042(1.84) | 11.464(1.76) | 0.006 | |
| ASPC (mean(sd)) | 46.779(23.63) | 38.431(24.36) | <0.001 | |
| BMPC (mean(sd)) | 52.49(25.53) | 40.262(25.63) | <0.001 | |
| MRI (mean(sd)) | 11.197(14.65) | 10.872(14.44) | 0.799 | |
| Cytogenetic abnormality (%) | No | 162(58.06) | 190(67.86) | 0.021 |
| Yes | 117(41.94) | 90(32.14) | ||
| High CCND1, no (%) | 130(46.59) | 150(53.57) | 0.118 | |
| High WT1, no (%) | 123(44.09) | 157(56.07) | 0.006 | |
| High CXCL12, no (%) | 71(25.45) | 209(74.64) | <0.001 | |
| High DEK, no (%) | 107(38.35) | 173(61.79) | <0.001 | |
| High CD74, no (%) | 119(42.65) | 161(57.5) | 0.001 | |
| High NRAS, no (%) | 143(51.25) | 137(48.93) | 0.642 | |
| High CDK4, no (%) | 159(56.99) | 121(43.21) | 0.002 | |
| High BRAF, no (%) | 150(53.76) | 130(46.43) | 0.099 | |
| High LIG4, no (%) | 134(48.03) | 146(52.14) | 0.374 | |
| High GPRC5D, no (%) | 160(57.35) | 120(42.86) | 0.001 | |
| High DAPK3, no (%) | 122(43.73) | 158(56.43) | 0.004 | |
| High FGFR3, no (%) | 105(37.63) | 175(62.5) | <0.001 | |
| High XBP1, no (%) | 116(41.58) | 164(58.57) | <0.001 | |
| High KISS1, no (%) | 124(44.44) | 156(55.71) | 0.01 | |
| High PTPN11, no (%) | 139(49.82) | 141(50.36) | 0.966 | |
| High IDH2, no (%) | 144(51.61) | 136(48.57) | 0.526 | |
| High HRAS, no (%) | 139(49.82) | 141(50.36) | 0.966 | |
| High HK2, no (%) | 157(56.27) | 123(43.93) | 0.005 | |
| High IGHG1, no (%) | 109(39.07) | 171(61.07) | <0.001 | |
| High MS4A1, no (%) | 110(39.43) | 170(60.71) | <0.001 | |
| High RGS13, no (%) | 115(41.22) | 165(58.93) | <0.001 | |
| High RRAS2, no (%) | 131(46.95) | 149(53.21) | 0.163 | |
| High S1PR1, no (%) | 112(40.14) | 168(60) | <0.001 | |
| High TP53, no (%) | 156(55.91) | 124(44.29) | 0.008 | |
| Therapy (%) | TT2 | 187(67.03) | 158(56.43) | 0.013 |
| TT3 | 92(32.97) | 122(43.57) |
AGE: Age at registration (years); B2M: Beta-2 microglobulin, mg/l; CRP: C-reactive protein, mg/l; CREAT: Creatinine, mg/dl; LDH: Lactate dehydrogenase, U/l; ALB: Albumin, 35 g/l; HGB: Haemoglobin, g/dl; ASPC: Aspirate plasma cells (%); BMPC: Bone marrow biopsy plasma cells (%); MRI: Number of magnetic resonance imaging (MRI)- defined focal lesions (skull, spine, pelvis); Cytogenetic abnormality: An indicator of the detection of cytogenetic abnormalities; no: number of patients.
Prognostic value of FCER1G expression in MM
By using the Cox regression model, we computed multivariate hazard ratios for different variables of 559 MM patients. Univariate analysis results showed that FCER1G and albumin (ALB), beta-2 microglobulin (B2M), bone marrow biopsy plasma cells (BMPC), hemoglobin (HGB), number of magnetic resonance imaging (MRI) were all closely related to EFS and OS with significant P values (Table 2). Furthermore, in multivariate analysis for EFS, the hazard ratio of hemoglobin was 0.66 (P = 0.023), while the hazard ratio of FCER1G expression was 0.7 (P = 0.024). These two factors were significantly related to the EFS in MM patients. For OS, the hazard ratio of beta-2 microglobulin was 1.66 (P = 0.007) and the hazard ratio of FCER1G expression was 0.69 (P = 0.02), indicating that both had a close association with OS. The hazard ratio of albumin and number of magnetic resonance imaging were 0.58 and 1.93 (P = 0.001, <0.001). FCER1G expression value was a stable factor affecting the survival level of MM patients (Table 3).
Univariate analysis for EFS and OS.
| Variables | EFS | OS | ||
|---|---|---|---|---|
| HR(95%CI) | P-value | HR(95%CI) | P-value | |
| FCER1G(high vs. low) | 0.65(0.48-0.88) | 0.006 | 0.62(0.45-0.84) | 0.002 |
| AGE(≥60 vs. <60) | 0.97(0.71-1.32) | 0.839 | 1.4(1.04-1.89) | 0.028 |
| Gender | 1.05(0.77-1.43) | 0.75 | 0.97(0.72-1.32) | 0.85 |
| ALB | 0.76(0.56-1.02) | 0.071 | 0.49(0.36-0.67) | < 0.001 |
| B2M | 1.72(1.27-2.33) | < 0.001 | 2.21(1.64-3) | < 0.001 |
| BMPC | 1.63(1.18-2.27) | 0.003 | 1.82(1.29-2.56) | 0.001 |
| HGB | 0.54(0.39-0.74) | < 0.001 | 0.62(0.45-0.84) | 0.002 |
| MRI | 1.26(0.93-1.71) | 0.141 | 1.9(1.38-2.61) | < 0.001 |
EFS: event-free survival; OS: overall survival; CR: complete remission; HR: hazard ratio; CI: confidence interval; ALB: Albumin(35 g/l); B2M: Beta-2 microglobulin(mg/l); BMPC: Bone marrow biopsy plasma cells (%); HGB: Haemoglobin(g/dl); MRI: Number of magnetic resonance imaging (MRI)- defined focal lesions (skull, spine, pelvis).
Multivariate analysis for EFS and OS
| Variables | EFS | OS | ||
|---|---|---|---|---|
| HR(95%CI) | P-value | HR(95%CI) | P-value | |
| FCER1G(high vs. low) | 0.7(0.51-0.95) | 0.024 | 0.69(0.51-0.94) | 0.02 |
| AGE(≥60 vs. <60) | 0.91(0.66-1.24) | 0.549 | 1.3(0.96-1.76) | 0.086 |
| Gender | 1.13(0.82-1.54) | 0.451 | 0.99(0.73-1.34) | 0.949 |
| ALB | 0.85(0.62-1.16) | 0.313 | 0.58(0.42-0.79) | 0.001 |
| B2M | 1.26(0.88-1.82) | 0.209 | 1.66(1.15-2.39) | 0.007 |
| BMPC | 1.31(0.91-1.88) | 0.145 | 1.34(0.92-1.96) | 0.13 |
| HGB | 0.66(0.46-0.94) | 0.023 | 0.95(0.67-1.34) | 0.756 |
| MRI | 1.3(0.96-1.77) | 0.095 | 1.93(1.4-2.65) | < 0.001 |
EFS: event-free survival; OS: overall survival; CR: complete remission; HR: hazard ratio; CI: confidence interval; ALB: Albumin, 35 g/l; B2M: Beta-2 microglobulin, mg/l; BMPC: Bone marrow biopsy plasma cells (%); HGB: Haemoglobin, g/dl; MRI: Number of magnetic resonance imaging (MRI)- defined focal lesions (skull, spine, pelvis).
The expression of FCER1G in different amplification levels of 1q21
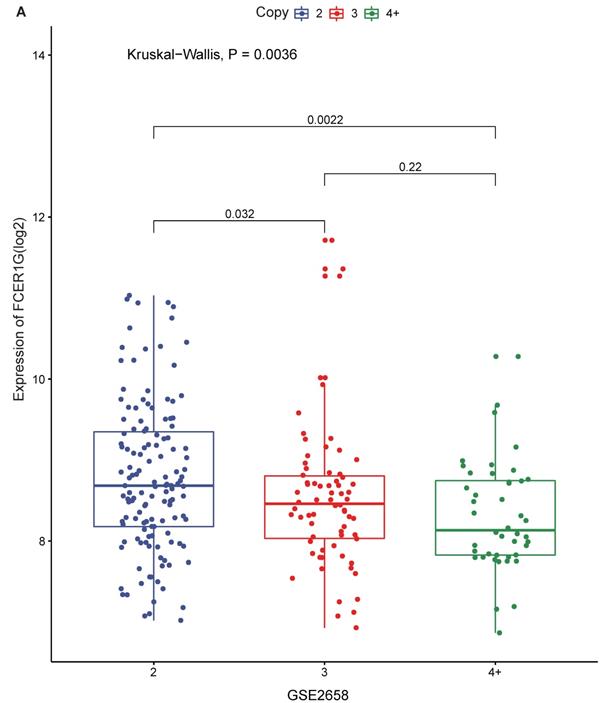
1q21 amplification is associated with poor prognosis, and FCER1G is located on chromosome 1q23.3. We compared FCER1G expression level under the different amplification of 1q21. There was a statistically significant difference of the expression levels between different levels of 1q21 amplification. The expression of FCER1G was decreased with the amplification of 1q21 (Fig. 3A, P = 0.0036, Kruskal-Wallis test).
The expression of FCER1G in different amplification levels of 1q21. The X-axis represents the 1q21 amplification, the Y-axis represents the FCER1G expression level. A FCER1G expression levels at different amplification levels of 1q21 in 248 MM patients. The expression value was measured as log2. P= 0.022, Kruskal-Wallis test.
FCER1G predicts the survival level in MM
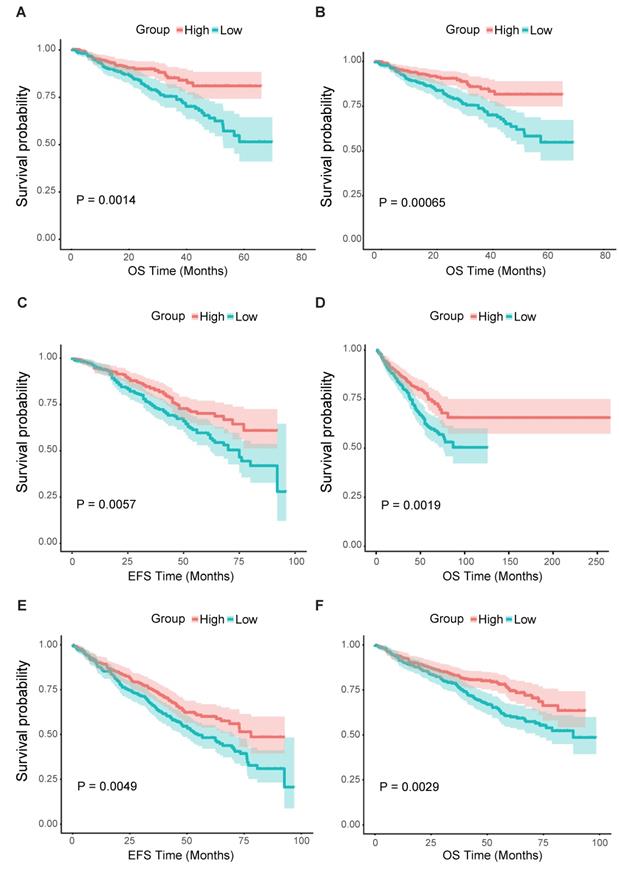
From all the results above, we could assume that the low expression of FCER1G was related to adverse outcomes of MM. Thus, we further analyzed the survival level in the second cohort. We found that the FCER1Glow group had significantly shorter OS compared to the FCER1Ghigh group in two independent datasets of GSE2658 and GSE4204 (Fig. 4A and B, P = 0.0014, 0.00065, respectively). The same prognostic value of FCER1G in MM was also found in GSE24080 (Fig. 4C and D, OS, P = 0.0019, EFS, P = 0.0057). Likewise, the survival level retains similar results at the milestone points of Year 2008 (Fig. 4E and F, OS, P = 0.0029, EFS, P = 0.0049).
Survival analysis of FCER1Ghigh and FCER1Glow group. The X-axis represents the survival time(month) and the Y-axis represents survival probability. Kaplan-Meier survival curves showed that FCER1Ghigh predicts good endpoint in both event-free survival time (EFS) and overall survival (OS), Log-rank test. A OS between FCER1Ghigh and FCER1Glow in GSE2658 dataset with P= 0.0014. B OS analysis in GSE2404 of 538 pre-treatment MM patients with P= 0.00065. C, D The survival analysis of EFS and OS in FCER1Ghigh and FCER1Glow groups of 559 MM patients in GSE24080 dataset. EFS: P= 0.0057, OS: P= 0.0019. E, F The EFS and OS results at the milestone points of 2008 in GSE24080 with P= 0.0049, P= 0.0029 respectively.
Different expression and pathway analysis for DEGs of FCER1Ghigh versus FCER1Glow
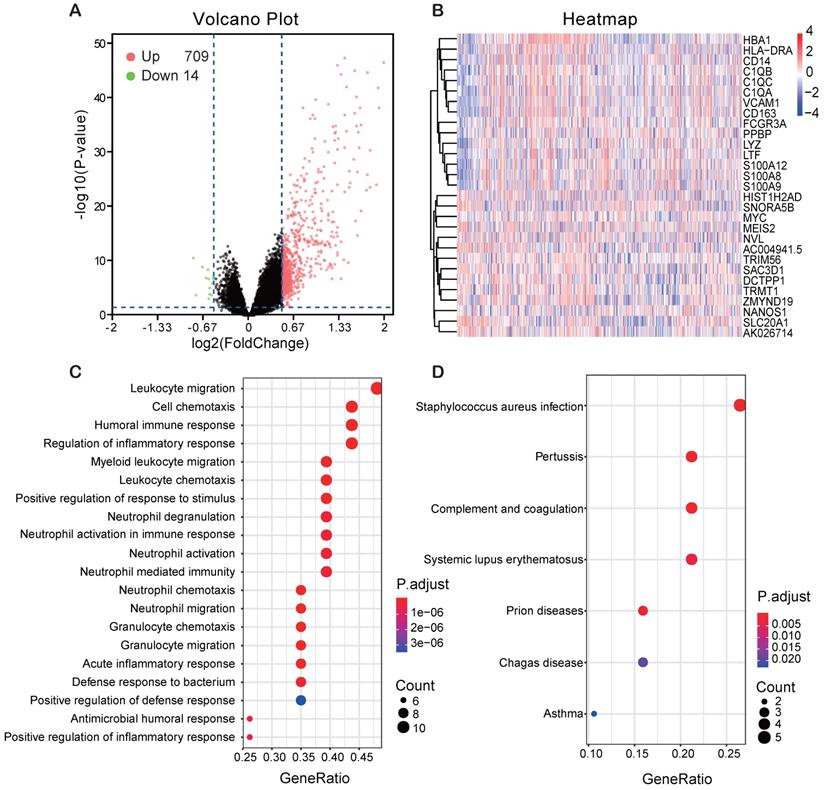
In order to find the genes associating with FCER1G, we analyzed the differential expression values of FCER1Ghigh versus FCER1Glow. As many as 709 genes were up-regulated and 14 genes were down-regulated (P< 0.05, (FC, log2)> 0.5 or < -0.5, Fig. 5A). Heatmap showed the top 15 up-regulated genes and 14 down-regulated genes (Fig. 5B). By using the DEGs, we analyzed the enriched GO terms and KEGG pathways. Among the biological process terms of GO, most of DEGs were enriched in leukocyte migration (GO:0050900), cell chemotaxis (GO:0060326), humoral immune response (GO:0006959), and regulation of inflammatory response (GO:0050727) (Fig. 5C). In the KEGG analysis results, Staphylococcus aureus infection (hsa05150), Systemic lupus erythematosus (hsa05322) and complement and coagulation cascades (hsa04610) were the most enriched pathways (Fig. 5D).
Different expression genes (DEGs) and the results of GO enrichment and KEGG pathway analysis. A Volcano plot of the DEGs expression between FCER1Ghigh and FCER1Glow. Cut-off criteria for DEGs significance was P< 0.05 and the absolute value of the log2 fold change> 0.5. The Y-axis displays the -log10 P-value for each gene, while the X-axis displays the log2 fold change for that gene relative to FCER1G expression. Green dots represent 14 down-regulated genes, the red circle represents 709 up-regulated genes, and black dots indicate non-significance genes. B Heatmap shows top 15 up-regulated genes and top 14 down-regulated genes. The red represents high expression, the white represents intermediate expression, and the blue represents low expression. C, D GO and KEGG results for differential expression genes. The X-axis represents gene ratio and the Y-axis represents different enriched pathways.
Module screening from the PPI network
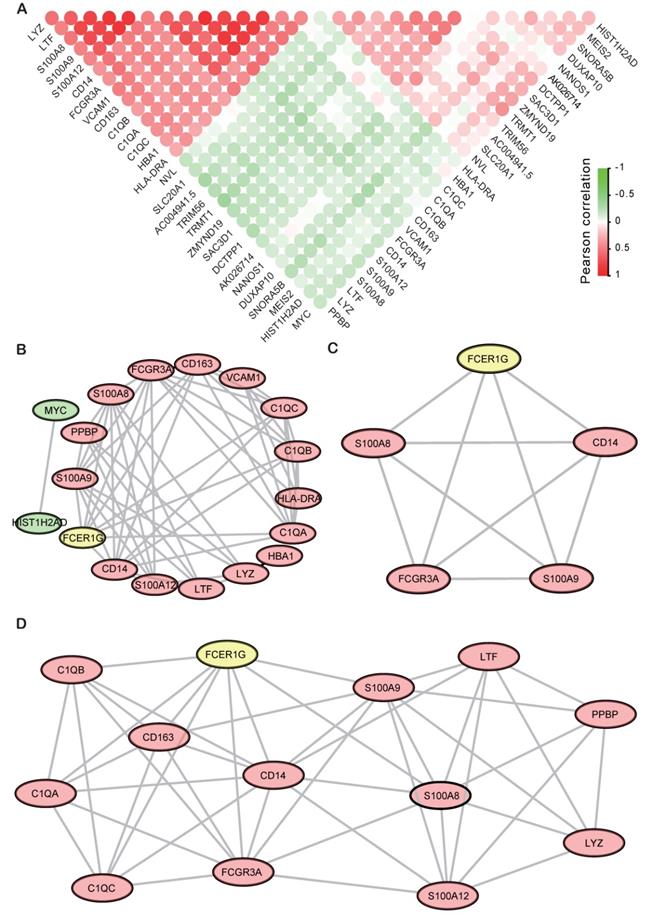
Finally, all the top 29 DEGs of FCER1Ghigh versus FCER1Glow were used to calculate the correlativity between those genes (Fig. 6A). We also screened the protein-protein interaction (PPI) network in the String database by using the top 29 DEGs [28]. Most of the up-regulated genes and two down-regulated genes (MYC and HIST1H2AD) were interactional in the PPI network (Fig. 6B). Then we discovered two sub-networks by using MCODE in Cytoscape (Fig. 6C, D). In the PPI network, C1QB, C1QA, C1QC, CD163, CD14, S100A8, S100A9, LTF, LYZ and FCGR3A were all reported to be associated with MM in early research. FCER1G acts as a core gene in both the general network and two subnetworks.
The Correlation analysis and PPI results of DEGs. A The correlation analysis of DEGs with the Pearson correlation coefficient, the red circle means positive correlation while green means negative correlation. B PPI network of top DEGs of top 15 up-regulated genes and 14 down-regulated genes. C, D Sub-networks analysis of the PPI network by using MCODE APP in Cytoscape.
Discussion
Our research demonstrated that the expression level of FCER1G showed a decreasing trend in the deterioration of plasma cell malignancy. Higher expression of FCER1G in MM patients was associated with favorable prognosis. Likewise, the GO and KEGG pathways mainly enriched in defense response, immune response, and inflammatory response. PPI network also revealed that many cancer-associated genes interacted with FCER1G. All of these results show that FCER1G may be a tumor suppressor gene in myeloma.
Early studies found that FCER1G transduced activation signals from various immunoreceptors [10, 29]. It was functionally linked to mediate neutrophil activation and was also involved in platelet activation. Associated diseases included Bleeding Disorder, Platelet-Type, 11(BDPLT11) and Mitochondrial Complex I Deficiency. FCER1G also engaged in many immune responses and played a tumor-promoting role in many kinds of tumors, such as meningioma, Clear cell renal cell carcinoma (ccRCC), childhood leukemia and Acute Myeloid Leukemia(AML) [12, 14, 15, 30]. It was also reported that the demethylation of FCER1G was induced by IL15 in the NKp30+CD8+ T cell population exhibiting high natural killer-like antitumor potential [31]. FCER1G inhibits the expression of certain Alzheimer's disease susceptibility genes by participating in Herpes simplex (HSV-1) escape strategy [9]. Interestingly, the abundant expression of FCER1G was found in the circulating tumor cells of a prostate cancer patient who was sensitive to docetaxel chemotherapeutic reagent [32].
In the PPI network, many important genes that were associated with MM had been screened. S100A9 was reported significantly down-regulated in MM patients and further support MM survival by stimulating angiogenesis and cytokine secretion [33, 34]. S100A9 was directly implicated in promoting Myeloid-derived suppressor cells (MDSC), which plays a critical role in the MM progression and can be considered as a therapeutic target in this disease [35]. C1QB, C1QA, and C1QC were all the complement c1q chains. Early reports showed that complement c1q acts in the tumor micro environment as a cancer-promoting factor independently of complement activation [36]. LTF has identified as a Cereblon (CRBN) binding protein and established relevance to MM biology [37]. LYZ was found as an element of the 9-genes prognostic signature and might be an independent prognostic factor in patients with multiple myeloma [38]. HLA-DRA plays an important role in bone lesions common in MM patients by participating in the immune response activation pathway [39]. CD163 is a tumor-associated macrophage marker, the high level of Monocyte/macrophage-derived soluble CD163 was associated with higher stage according to the ISS and with other known prognostic factors in multiple myeloma [40, 41]. MYC activation is associated with hyperdiploid MM and shorter survival, and also plays a causal role in the progression of monoclonal gammopathy to multiple myeloma. MYC protein overexpression is a feature of progression and adverse prognosis in multiple myeloma [42-45]. In recent research, it was also proved that sialyltransferase inhibition leads to inhibition of tumor cell interactions with VCAM1, and improves survival in a human multiple myeloma mouse model [46]. FCGR3A was proved to be associated with anti-tumor response. [47]. The polymorphisms of FCGR3A play an important role in First-Relapsed ovarian cancer, metastatic breast cancer, and metastatic colorectal cancer [48-51]. Early research also found that FCGR3A was associated with infections of MM patients [52].
The PPI results showed that FCER1G was a hub gene in the network and directly interact with many MM associated genes. As we demonstrated previously, downregulation of FCER1G expression was closely related to the deterioration of myeloma. Combined with GO and KEGG analysis results above, FCER1G might interact with other MM associated genes and was mainly involved in leukocyte migration, cell chemotaxis, and immune and inflammatory response pathway, and therefore exerted an anti-cancer effect in multiple myeloma.
Conclusions
To sum up, we have clearly demonstrated that high FCER1G expression was a good prognostic factor in MM patients. The expression level of FCER1G decreased with the progression of myeloma. Moreover, GO term enrichment, KEGG pathways, and PPI networks involved in MM provided insights into the pathogenesis processes associated with varying FCER1G expression. The underexpression of FCER1G could serve as a promising therapeutic target for MM patients.
However, in this research, the exact pathophysiologic role of FCER1G in myeloma cells was not been fully demonstrated. Further studies including the molecular mechanism and deeper genomic research of FCER1G in myeloma deterioration will be urgently required.
Abbreviations
MM: Multiple myeloma; FCER1G: Fc fragment Of IgE receptor Ig; BMPCs: bone marrow plasma cells; ISS: International Staging System; IgE: immunoglobulin E; DEGs: different expression genes; MGUS: monoclonal gammopathy of undetermined significance; MM: multiple myeloma; SMM: smouldering myeloma; PCL: plasma cell leukaemia; GEO: gene expression omnibus; PCs: purified plasma cells; ROTI: related organ or tissue impairment; B2M: beta-2 microglobulin; CREAT: Creatinine; ASPC: Aspirate plasma cells; HGB: hemoglobin; MRI: magnetic resonance imaging; OS: overall survival; EFS: event-free survival; HR: hazard ratio; CI: confidence interval; GO: gene Ontology; KEGG: Kyoto encyclopedia of genes and genomes; PPI: Protein-protein interaction; BP: biological processes; CC: cell component; MF: molecular function; MDSC: Myeloid-derived suppressor cells.
Acknowledgements
We thank the GEO Database and all the providers of datasets used in this report. We also thank Yifan Pang for helping to modify the English language.
Authors' contributions
All the authors conceived the study. Chaozeng Si and Lin Fu performed the analysis and Fen Dong helped the statistical analysis section. Lin Fu, Chaozeng Si and Zhiheng Cheng drafted the initial manuscript. Tingting Qian, Liang Quan, Wenhui Huang, Jinghong Chen and Longzhen Cui obtained and assembled the data. Ying Pang, Xu Ye, Guangsheng Wu, Yan Liu and Tiansheng Zeng contributed to the interpretation of the data. Tingting Qian, Yang Chen and Chaozeng Si designed the study and led the whole project. All the authors revised and approved the final version of the manuscript.
Availability of data and materials
The datasets of this report were generated by GEO.
Ethical approval and consent to participate
This study was approved by the Helsinki declaration and its subsequent amendments.
Funding
This work was supported by grants from Xinjiang Joint Fund of National Natural Science Foundation of China [U1903117], the National Natural Science Foundation of China [81500118, 31871343, 81600089] and the National Basic Research Program of China [2017YFA0505503].
Competing Interests
The authors have declared that no competing interest exists.
References
1. Weaver CJ, Tariman JD. Multiple Myeloma Genomics: A Systematic Review. Semin Oncol Nurs. 2017;33:237-53
2. Riccomi G, Fornaciari G, Giuffra V. Multiple myeloma in paleopathology: A critical review. Int J Paleopathol. 2018;24:201-12
3. Multiple myeloma. 2018 update on diagnosis, risk-stratification, and management. Am J Hematol. 2018;93:981-1114
4. Chen D, Zhou D, Xu J. et al. Prognostic Value of 1q21 Gain in Multiple Myeloma. Clin Lymphoma Myeloma Leuk. 2019;19:e159-e64
5. Yu W, Guo R, Qu X. et al. The amplification of 1q21 is an adverse prognostic factor in patients with multiple myeloma in a Chinese population. Onco Targets Ther. 2016;9:295-302
6. Levin A, Hari P, Dhakal B. Novel biomarkers in multiple myeloma. Transl Res. 2018;201:49-59
7. Ryland GL, Jones K, Chin M. et al. Novel genomic findings in multiple myeloma identified through routine diagnostic sequencing. J Clin Pathol. 2018;71:895-9
8. Kuster H, Thompson H, Kinet JP. Characterization and expression of the gene for the human Fc receptor gamma subunit. Definition of a new gene family. J Biol Chem. 1990;265:6448-52
9. Carter CJ. Interactions between the products of the Herpes simplex genome and Alzheimer's disease susceptibility genes: relevance to pathological-signalling cascades. Neurochem Int. 2008;52:920-34
10. Sweet RA, Nickerson KM, Cullen JL. et al. B Cell-Extrinsic Myd88 and Fcer1g Negatively Regulate Autoreactive and Normal B Cell Immune Responses. J Immunol. 2017;199:885-93
11. Le Coniat M, Kinet JP, Berger R. The human genes for the alpha and gamma subunits of the mast cell receptor for immunoglobulin E are located on human chromosome band 1q23. Immunogenetics. 1990;32:183-6
12. Rajaraman P, Brenner AV, Neta G. et al. Risk of meningioma and common variation in genes related to innate immunity. Cancer Epidemiol Biomarkers Prev. 2010;19:1356-61
13. Mahachie John JM, Baurecht H, Rodriguez E. et al. Analysis of the high affinity IgE receptor genes reveals epistatic effects of FCER1A variants on eczema risk. Allergy. 2010;65:875-82
14. Han S, Lan Q, Park AK. et al. Polymorphisms in innate immunity genes and risk of childhood leukemia. Hum Immunol. 2010;71:727-30
15. Chen L, Yuan L, Wang Y. et al. Co-expression network analysis identified FCER1G in association with progression and prognosis in human clear cell renal cell carcinoma. Int J Biol Sci. 2017;13:1361-72
16. Liang Y, Zhao M, Liang G. et al. [Construction of special reporter to detect DNA methylation regulatory activity in FCER1G gene promoter through patch-methylation]. Zhong Nan Da Xue Xue Bao Yi Xue Ban. 2013;38:120-4
17. International Myeloma Working G. Criteria for the classification of monoclonal gammopathies, multiple myeloma and related disorders: a report of the International Myeloma Working Group. Br J Haematol. 2003;121:749-57
18. Mitchell JS, Li N, Weinhold N. et al. Genome-wide association study identifies multiple susceptibility loci for multiple myeloma. Nat Commun. 2016;7:12050
19. Zhan F, Barlogie B, Arzoumanian V. et al. Gene-expression signature of benign monoclonal gammopathy evident in multiple myeloma is linked to good prognosis. Blood. 2007;109:1692-700
20. Mina R, D'Agostino M, Cerrato C. et al. Plasma cell leukemia: update on biology and therapy. Leuk Lymphoma. 2017;58:1538-47
21. Kyle RA, Maldonado JE, Bayrd ED. Plasma cell leukemia. Report on 17 cases. Arch Intern Med. 1974;133:813-8
22. Chauhan D, Tian Z, Nicholson B. et al. A small molecule inhibitor of ubiquitin-specific protease-7 induces apoptosis in multiple myeloma cells and overcomes bortezomib resistance. Cancer cell. 2012;22:345-58
23. Driscoll JJ, Pelluru D, Lefkimmiatis K. et al. The sumoylation pathway is dysregulated in multiple myeloma and is associated with adverse patient outcome. Blood. 2010;115:2827-34
24. Zhan F, Huang Y, Colla S. et al. The molecular classification of multiple myeloma. Blood. 2006;108:2020-8
25. Shi L, Campbell G, Jones WD. et al. The MicroArray Quality Control (MAQC)-II study of common practices for the development and validation of microarray-based predictive models. Nat Biotechnol. 2010;28:827-38
26. Ritchie ME, Phipson B, Wu D. et al. limma powers differential expression analyses for RNA-sequencing and microarray studies. Nucleic Acids Res. 2015;43:e47
27. Yu G, Wang LG, Han Y. et al. clusterProfiler: an R package for comparing biological themes among gene clusters. OMICS. 2012;16:284-7
28. Szklarczyk D, Gable AL, Lyon D. et al. STRING v11: protein-protein association networks with increased coverage, supporting functional discovery in genome-wide experimental datasets. Nucleic Acids Res. 2019;47:D607-D13
29. Shah S, Gibson AW, Ji C. et al. Regulation of FcRgamma function by site-specific serine phosphorylation. J Leukoc Biol. 2017;101:421-8
30. Handschuh L, Kazmierczak M, Milewski MC. et al. Gene expression profiling of acute myeloid leukemia samples from adult patients with AML-M1 and -M2 through boutique microarrays, real-time PCR and droplet digital PCR. Int J Oncol. 2018;52:656-78
31. Correia MP, Stojanovic A, Bauer K. et al. Distinct human circulating NKp30(+)FcepsilonRIgamma(+)CD8(+) T cell population exhibiting high natural killer-like antitumor potential. Proc Natl Acad Sci U S A. 2018;115:E5980-E9
32. Hwang JE, Joung JY, Shin SP. et al. Ad5/35E1aPSESE4: A novel approach to marking circulating prostate tumor cells with a replication competent adenovirus controlled by PSA/PSMA transcription regulatory elements. Cancer Lett. 2016;372:57-64
33. De Veirman K, De Beule N, Maes K. et al. Extracellular S100A9 Protein in Bone Marrow Supports Multiple Myeloma Survival by Stimulating Angiogenesis and Cytokine Secretion. Cancer Immunol Res. 2017;5:839-46
34. Lozano E, Diaz T, Mena MP. et al. Loss of the Immune Checkpoint CD85j/LILRB1 on Malignant Plasma Cells Contributes to Immune Escape in Multiple Myeloma. J Immunol. 2018;200:2581-91
35. Ramachandran IR, Martner A, Pisklakova A. et al. Myeloid-derived suppressor cells regulate growth of multiple myeloma by inhibiting T cells in bone marrow. J Immunol. 2013;190:3815-23
36. Bulla R, Tripodo C, Rami D. et al. C1q acts in the tumour microenvironment as a cancer-promoting factor independently of complement activation. Nat Commun. 2016;7:10346
37. Zhu YX, Braggio E, Shi CX. et al. Identification of cereblon-binding proteins and relationship with response and survival after IMiDs in multiple myeloma. Blood. 2014;124:536-45
38. Liu XP, Yin XH, Meng XY. et al. Development and Validation of a 9-Gene Prognostic Signature in Patients With Multiple Myeloma. Front Oncol. 2018;8:615
39. Fernando RC, Mazzotti DR, Azevedo H. et al. Transcriptome Analysis of Mesenchymal Stem Cells from Multiple Myeloma Patients Reveals Downregulation of Genes Involved in Cell Cycle Progression, Immune Response, and Bone Metabolism. Sci Rep. 2019;9:1056
40. Andersen MN, Abildgaard N, Maniecki MB. et al. Monocyte/macrophage-derived soluble CD163: a novel biomarker in multiple myeloma. Eur J Haematol. 2014;93:41-7
41. Yang LL, Wu L, Yu GT. et al. CD317 Signature in Head and Neck Cancer Indicates Poor Prognosis. J Dent Res. 2018;97:787-94
42. Chng WJ, Huang GF, Chung TH. et al. Clinical and biological implications of MYC activation: a common difference between MGUS and newly diagnosed multiple myeloma. Leukemia. 2011;25:1026-35
43. Chesi M, Robbiani DF, Sebag M. et al. AID-dependent activation of a MYC transgene induces multiple myeloma in a conditional mouse model of post-germinal center malignancies. Cancer Cell. 2008;13:167-80
44. Diaz T, Rodriguez V, Lozano E. et al. The BET bromodomain inhibitor CPI203 improves lenalidomide and dexamethasone activity in in vitro and in vivo models of multiple myeloma by blockade of Ikaros and MYC signaling. Haematologica. 2017;102:1776-84
45. Moller HEH, Preiss BS, Pedersen P. et al. Myc protein overexpression is a feature of progression and adverse prognosis in multiple myeloma. Eur J Haematol. 2018
46. Natoni A, Farrell ML, Harris S. et al. Sialyltransferase inhibition leads to inhibition of tumor cell interactions with E-selectin, VCAM1, and MADCAM1, and improves survival in a human multiple myeloma mouse model. Haematologica. 2019
47. Magnes T, Melchardt T, Hufnagl C. et al. The influence of FCGR2A and FCGR3A polymorphisms on the survival of patients with recurrent or metastatic squamous cell head and neck cancer treated with cetuximab. Pharmacogenomics J. 2018;18:474-9
48. Wang W, Somers EB, Ross EN. et al. FCGR2A and FCGR3A Genotypes Correlate with Farletuzumab Response in Patients with First-Relapsed Ovarian Cancer Exhibiting Low CA125. Cytogenet Genome Res. 2017;152:169-79
49. Gavin PG, Song N, Kim SR. et al. Association of Polymorphisms in FCGR2A and FCGR3A With Degree of Trastuzumab Benefit in the Adjuvant Treatment of ERBB2/HER2-Positive Breast Cancer: Analysis of the NSABP B-31 Trial. JAMA Oncol. 2017;3:335-41
50. Ying HQ, Wang F, Chen XL. et al. FCGR2A, FCGR3A polymorphisms and therapeutic efficacy of anti-EGFR monoclonal antibody in metastatic colorectal cancer. Oncotarget. 2015;6:28071-83
51. Kjersem JB, Skovlund E, Ikdahl T. et al. FCGR2A and FCGR3A polymorphisms and clinical outcome in metastatic colorectal cancer patients treated with first-line 5-fluorouracil/folinic acid and oxaliplatin +/- cetuximab. BMC Cancer. 2014;14:340
52. Molle I, Ostergaard M, Melsvik D. et al. Infectious complications after chemotherapy and stem cell transplantation in multiple myeloma: implications of Fc gamma receptor and myeloperoxidase promoter polymorphisms. Leuk Lymphoma. 2008;49:1116-22
Author contact
![]() Corresponding authors: Tingting Qian, E-mail: qiantingting.08com; Yang Chen, E-mail: ycedu.cn; Chaozeng Si, E-mail: supersicom.
Corresponding authors: Tingting Qian, E-mail: qiantingting.08com; Yang Chen, E-mail: ycedu.cn; Chaozeng Si, E-mail: supersicom.