Impact Factor ISSN: 1837-9664

 Global reach, higher impact
J Cancer 2019; 10(23):5883-5890. doi:10.7150/jca.32267 This issue Cite
Research Paper
The transcriptome difference between colorectal tumor and normal tissues revealed by single-cell sequencing
Guo-Liang Zhang1, Le-Lin Pan1, Tao Huang2 ![]() , Jin-Hai Wang1
, Jin-Hai Wang1 ![]()
1. Department of Colorectal Surgery, The First Affiliated Hospital, College of Medicine, Zhejiang University, Hangzhou 310003, Zhejiang, China
2. Shanghai Institute of Nutrition and Health, Shanghai Institutes for Biological Sciences, Chinese Academy of Sciences, Shanghai 200031, China
Received 2018-12-14; Accepted 2019-6-17; Published 2019-10-11
Abstract
The previous cancer studies were difficult to reproduce since the tumor tissues were analyzed directly. But the tumor tissues were actually a mixture of different cancer cells. The transcriptome of single-cell was much robust than the transcriptome of a mixed tissue. The single-cell transcriptome had much smaller variance. In this study, we analyzed the single-cell transcriptome of 272 colorectal cancer (CRC) epithelial cells and 160 normal epithelial cells and identified 342 discriminative transcripts using advanced machine learning methods. The most discriminative transcripts were LGALS4, PHGR1, C15orf48, HEPACAM2, PERP, FABP1, FCGBP, MT1G, TSPAN1 and CKB. We further clustered the 342 transcripts into two categories. The upregulated transcripts in CRC epithelial cells were significantly enriched in Ribosome, Protein processing in endoplasmic reticulum, Antigen processing and presentation and p53 signaling pathway. The downregulated transcripts in CRC epithelial cells were significantly enriched in Mineral absorption, Aldosterone-regulated sodium reabsorption and Oxidative phosphorylation pathways. The biological analysis of the discriminative transcripts revealed the possible mechanism of colorectal cancer.
Keywords: colorectal cancer, single-cell sequencing, transcriptome, support vector machine, minimal redundancy maximal relevance, incremental feature selection
Introduction
Colorectal cancer (CRC) is a major human digestive tract tumor throughout the world and the incidence increases with increasing age [1]. According to the latest world health organization (WHO) statistics, colorectal cancer is the third most common malignancy, second only to lung cancer and gastric cancer [2]. The occurrence of colorectal cancer is caused by many factors, such as heredity and environment, which is a complicated process involving multiple transcripts and stages.
Pathogenic mechanisms of CRC are clinically important because they are associated with the patient's prognosis and response to treatment [1]. The pathogenesis leading to colorectal cancer can be included in following types: chromosomal instability (CIN), microsatellite instability (MSI)/mismatch repair (MMR) and CpG island methylator phenotype (CIMP) [3].
Sufficient evidence has been shown that abnormal signal transduction exists in the initiation and progression of tumor. Cell signal transduction pathways associated with colorectal cancer mainly include Wnt-β-catenin, PI3K/Akt and TGF-β signaling pathway [4-6]. On the other hand, transcripts like c-MYC, KRAS, BRAF, PIK3CA, SMAD2 and SMAD4 can also be considered as predictive biomarkers for patient's prognosis [7].
The single-cell transcriptome sequencing is a newly developed technology and measures the sum of all the RNA in a particular cell [8]. Through high throughput sequencing, it is possible to obtain almost all transcriptional sequence information of a specific tissue or organ comprehensively and rapidly. This technology has been widely used in the fields of basic research, clinical diagnosis and drug development [9]. Moreover, it can also be used for tumor heterogeneity research and the discovery of aberrant proliferative cell types to look for new pathogenesis and mechanisms [10].
Intestinal epithelial cells act as an important barrier to prevent bacterial endotoxin and other toxin into human body. The intestinal epithelium is composed of at least seven different cell types [11], the main function of which is the absorption of nutrients, toxins and drugs. Recent studies suggest that intestinal epithelial cells play an important role in maintaining the intestinal immune homeostasis [12], and the aberrant cell signaling in epithelial junctions has been reported to be associated with the development of colorectal cancer [13].
We analyzed the single-cell transcriptome of 272 CRC epithelial cells and 160 normal epithelial cells. With advanced feature selection methods, we identified 342 discriminative transcripts that showed transcript expression difference between colorectal tumor and normal cells. We found that the upregulated transcripts in CRC epithelial cells were significantly enriched in Ribosome, Protein processing in endoplasmic reticulum, Antigen processing and presentation and p53 signaling pathway while the downregulated transcripts in CRC epithelial cells were significantly enriched in Mineral absorption, Aldosterone-regulated sodium reabsorption and Oxidative phosphorylation pathways. Several identified transcripts, such as LGALS4, FABP1, MT1G, TSPAN1 and CKB, showed great promises as candidates for CRC diagnosis and therapy.
Materials and Methods
The single-cell transcriptome of CRC and normal epithelial cells
We downloaded the processed FPKM (Fragments Per Kilobase of transcript per Million mapped reads) single-cell transcriptome of 272 CRC epithelial cells and 160 normal epithelial cells from GEO (Transcript Expression Omnibus) database under accession number of GSE81861 [14]. Li et al. [14] collected the normal mucosa and CRC tissue and performed single cell sequencing. There were Myeloid, B cell, T cell, Mast, Endo and Epithelial cells in these colorectal tissues. Since most of them were epithelial cells, we focused on epithelial cells. All the data we used have passed the criteria of NODG (number of detected genes) ≥ 1,000, ROER (rate of exonic reads) ≥ 5% and ER (exonic reads) ≥ 0.1 million. More information of data quality control can be found in Li et al. [14]
Our goal is to identify the discriminative transcripts using machine learning methods. The 272 CRC epithelial cells were considered as positive samples and 160 normal epithelial cells were considered as negative samples. To filter the noisy transcripts, we only kept the 32,610 transcripts with maximum FPKM (Fragments Per Kilobase Million) across the CRC epithelial cells and normal epithelial cells greater than 5, as features.
The minimal Redundancy Maximal Relevance method
The mutation information based mRMR (minimal Redundancy Maximal Relevance) method (http://home.penglab.com/proj/mRMR/) [15] was originally developed to analyze image data but then it showed great power in selecting discriminative features in various areas [16-21].
Let us use to denote all the 32,610 transcripts,
  to denote the selected m transcripts, and
  to denote the to-be-selected n transcripts. The relevance
  of transcript
  from
from  with cell type
  was calculated with mutual information (I) equation [22, 23]:
(1)
The redundancy R of the transcript  from
from  with the selected transcripts in
  are
are
(2)
The goal is to select the transcript  from
from  that has maximum relevance with cell type
  and minimum redundancy with the selected transcripts in
(3)
When  becomes empty, all the transcripts are ranked
(4)
The rank can represent the discriminating ability of the transcript. Since the mRMR have already reduced the redundancy, the discriminative transcripts will be compact. We focused on the top 500 mRMR transcripts for further analysis.
Incremental Feature Selection method
To determine how many mRMR transcripts should be selected, Incremental Feature Selection (IFS) method [24-30] was applied. As a wrapped feature selection method, IFS method evaluated the performances of SVM (Support Vector Machine) classifiers constructed based on different transcript combinations. We used the function svm with default parameters in R package e1071 (https://CRAN.R-project.org/package=e1071) to construct the SVM classifier.
Since the transcripts have been ranked using mRMR, it is unnecessary to try all transcript combinations. As a greedy optimization method, each time, one transcript was added into the previous transcript set [31-34] and the classification performance of the updated transcript set was evaluated with leave-one-out cross validation (LOOCV).
The Sensitivity (Sn), Specificity (Sp), Accuracy (ACC) and Mathew's correlation coefficient (MCC) were used to evaluate the prediction performance:
(5)
(6)
(7)
(8)
where TP, TN, FP and FN were the number of true positive, true negative, false positive and false negative samples.
With the performances of all possible IFS combinations, an IFS curve was plotted to visually select the optimized transcript combination. The x-axis was the number of used transcripts and the y-axis was the LOOCV performance. Since the sample size of CRC epithelial cells and normal epithelial cells were quite different, we used the MCC as the major performance evaluator. The peak of IFS curve indicated that the optimal transcript set with highest MCC.
The up and down regulated transcripts in CRC epithelial cells
The mRMR and IFS methods can identify the transcripts that can classify the CRC epithelial cells and normal epithelial cells, but they can't tell which transcripts were upregulated or downregulated in CRC epithelial cells. To visually investigate the transcript-cell relationship, we applied two-way hierarchical clustering of both CRC/normal epithelial cells and selected transcripts. From the heatmap, we can not only explore whether the CRC and normal epithelial cells were clustered into different groups, but also know which transcripts were upregulated or downregulated in CRC epithelial cells.
Results
The transcripts were ranked with mRMR method
The mRMR method ranks the transcripts based on both their relevance with the cell types and their redundancy with other transcripts. Since it considered the redundancy, the selected transcripts will be representative and a small number of top transcripts will be discriminative for cell types. We identified the top 500 most discriminative transcripts using the mRMR method. These 500 transcripts had enough power to discriminate cell types.
The optimal transcript combinations were identified with IFS method
Since the mRMR result was only transcript ranks, it is still difficult to determine how many top transcripts should be chosen. As a greedy optimization method, the IFS method can quickly discovery the optimal transcript combinations with great performance. We tried different combinations of top transcripts and recorded the performance of the SVM classifier constructed based on these transcripts. Then the IFS curve was plotted in Figure 1 to visually select the transcript combinations. In the IFS curve, the x-axis was the number of transcripts and the y-axis was the LOOCV MCC.
The IFS curve of how the classifiers based on different number of transcripts performance. The x-axis was the number of transcripts used to build the classifier and y-axis was the prediction MCC evaluated with LOOCV. The peak of IFS curve was MCC of 0.906 when 342 transcripts were used.
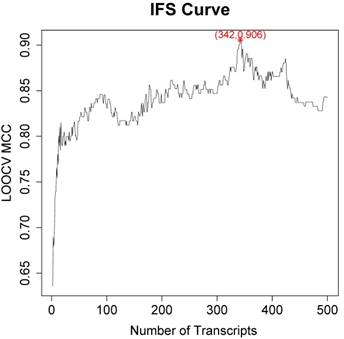
It was found that when the top 342 transcripts were used, the MCC was the highest. The sensitivity, specificity, accuracy and MCC of the 342-transcript classifier were 0.967, 0.938, 0.956 and 0.906, respectively. The 342 selected transcripts were given in Table S1.
The biological analysis of top transcripts
There was local peak in Figure 1 with MCC around 0.8 when top 20 transcripts were used. Since 342 transcripts were too much to analyze one-by-one, we analyzed the top 20 transcripts which were given in Table 1.
The top 20 mRMR transcripts
| Order | Chromosome | Start Position | End Position | Transcript Name | Transcript ID | Score |
|---|---|---|---|---|---|---|
| 1 | chr19 | 39292310 | 39304004 | LGALS4 | ENSG00000171747.4 | 0.138 |
| 2 | chr15 | 40643233 | 40648635 | PHGR1 | ENSG00000233041.4 | 0.085 |
| 3 | chr15 | 45722726 | 45878488 | C15orf48 | ENSG00000166920.6 | 0.067 |
| 4 | chr7 | 92817898 | 92855837 | HEPACAM2 | ENSG00000188175.5 | 0.065 |
| 5 | chr16 | 56659386 | 56661024 | MT1E | ENSG00000169715.10 | 0.066 |
| 6 | chr6 | 138409641 | 138428648 | PERP | ENSG00000112378.11 | 0.061 |
| 7 | chr10 | 85933493 | 85945050 | C10orf99 | ENSG00000188373.4 | 0.063 |
| 8 | chr1 | 45249256 | 45253377 | BEST4 | ENSG00000142959.4 | 0.059 |
| 9 | chr13 | 27825445 | 27830828 | RPL21 | ENSG00000122026.6 | 0.054 |
| 10 | chr2 | 88422509 | 88427635 | FABP1 | ENSG00000163586.5 | 0.055 |
| 11 | chr12 | 39040623 | 39303394 | CPNE8 | ENSG00000139117.9 | 0.054 |
| 12 | chr12 | 56544579 | 56584068 | MYL6 | ENSG00000092841.14 | 0.053 |
| 13 | chr19 | 40353962 | 40440533 | FCGBP | ENSG00000090920.9 | 0.052 |
| 14 | chr20 | 1290618 | 1373806 | SDCBP2 | ENSG00000125775.10 | 0.053 |
| 15 | chr16 | 56700642 | 56701977 | MT1G | ENSG00000125144.9 | 0.053 |
| 16 | chr6 | 31795511 | 31798031 | HSPA1B | ENSG00000204388.5 | 0.052 |
| 17 | chr5 | 179041178 | 179061785 | HNRNPH1 | ENSG00000169045.13 | 0.051 |
| 18 | chr1 | 46505811 | 46651630 | TSPAN1 | ENSG00000117472.5 | 0.051 |
| 19 | chr16 | 56662970 | 56667898 | MT1M | ENSG00000205364.3 | 0.051 |
| 20 | chr14 | 103985995 | 103989448 | CKB | ENSG00000166165.8 | 0.051 |
The first transcript was LGALS4 which predominantly expressed in small intestine, colon, and rectum, and was under expressed in colorectal cancer. It acts as a tumor suppressor in colorectal carcinoma and suppresses cancer cell growth, migration, and invasion [35]. It is a dual function protein: promote cell proliferation and chemokine secretion in galectin-4-expressing colorectal cancer cells, but induce apoptosis in galectin-4-negative colorectal cancer cells [36].
The second transcript was PHGR1 which has been reported to play an essential role in gastrointestinal epithelium and has demonstrated potentials for clinical application in colorectal cancer lymph node metastases detection [37].
The third transcript was C15orf48. It was mainly expressed in esophagus, stomach, small intestine, colon and placenta. The associations between and squamous cell carcinoma has been reported [38].
The fourth transcript was HEPACAM2, a protein of the immunoglobulin superfamily, which plays a role in mitosis. Its expression level was increased in adenomas, the benign stage of tumor glandular tissues, such as the mucosa of small intestine and colon [39]. It seems to be involved in cell-cell adhesion and play an important role in tumor metastasis [39].
Another top promising transcript was PERP. It is the component of intercellular desmosome junctions and plays a role in cell-cell adhesion and stratified epithelial integrity. It is involved in p53 Pathway in CRC [40].
FABP1 ranked 10th and encoded the fatty acid binding protein. It is down regulated in colorectal carcinogenesis and associated with poorer prognosis. Lower expression of FABP1 indicated liver metastasis of CRC. FABP1 expression was observed throughout cancer development [41].
The 13th transcript was FCGBP. The FCGBP expression significantly decreased the overall survival of CRC patients and may be a potential therapeutic target for metastatic CRC patients [42].
The 15th transcript MT1G was related to metabolism and response to metal ions. It is silenced through epigenetic mechanisms during colorectal cancer progression, and its loss is associated with poor survival of CRC [43].
TSPAN1, a member of the transmembrane 4 superfamily, ranked 18th. The expression level of TSPAN1 is increased in colorectal carcinoma and is an independent prognostic factor for the colorectal adenocarcinoma patients [44]. It can be regulated by miR-638 which inhibits TSPAN1 and serve as a tumor suppressor [45].
The 20th transcript in Table 1 was CKB. Interestingly, CKB is overexpressed in most cancer types, but not in CRC. In CRC, CKB is downregulated. The downregulation of CKB promotes EMT and accelerate colon cancer progression [46].
The transcripts were up or down regulated in CRC epithelial cells
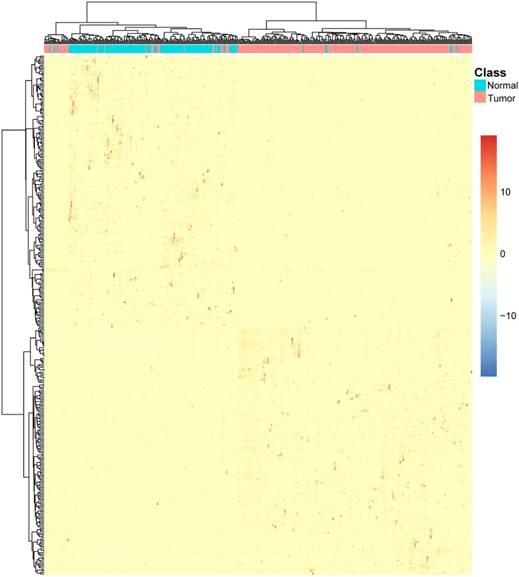
To intuitively explore the transcript-cell relationship, we plotted two-way hierarchical clustering of both CRC/normal epithelial cells and 342 transcripts in Figure 2. It can be seen that the CRC epithelial cells and normal epithelial cells were clearly clustered into two groups and correspondingly, the 342 transcripts were also clustered into two groups. The top cluster of transcripts were highly expressed in normal epithelial cells and the bottom cluster of transcripts were highly expressed in CRC epithelial cells.
The heatmap of the 342 transcripts in CRC epithelial cells and normal epithelial cells. Each row corresponded to the scaled transcript expressed level of a transcript. The warmer colors indicated higher expression level and the colder colors indicated lower expression levels. Each column corresponded to an epithelial cell. The red ones were tumor epithelial cells and the green ones were normal epithelial cells. It can be seen that the CRC epithelial cells and normal epithelial cells were clearly clustered into two groups and correspondingly, the 342 transcripts were also clustered into two groups. The top cluster of transcripts were highly expressed in normal epithelial cells and the bottom cluster of transcripts were highly expressed in CRC epithelial cells.
We enriched the up regulated transcripts and down regulated transcripts onto KEGG pathway and GO terms using hypergeometric test [47-53].
The significantly enriched KEGG pathways of the up regulated transcripts in CRC epithelial cells was given in Table 2. It can be seen that Ribosome, Protein processing in endoplasmic reticulum, Antigen processing and presentation, p53 signaling pathway were enriched.
The significantly enriched KEGG pathways of the up regulated transcripts in CRC epithelial cells
| KEGG pathway | FDR* | P value | Transcripts |
|---|---|---|---|
| hsa03010 Ribosome | 0.00136 | 4.32E-06 | RPS4Y1, RPS18, RPS27A, RPL7, RPL13, RPL18A, RPL21, RPL23, RPL38 |
| hsa04141 Protein processing in endoplasmic reticulum | 0.0456 | 0.000422 | HSPA5, HSPA1B, HSPA6, HSP90AA1, HSP90AB1, HSPH1, PPP1R15A |
| hsa04612 Antigen processing and presentation | 0.0456 | 0.000436 | HSPA1B, HSPA6, HSP90AA1, HSP90AB1, HSPA5 |
| hsa05215 Prostate cancer | 0.0981 | 0.00125 | ETV5, MDM2, HSP90AA1, HSP90AB1, GSTP1 |
| hsa04115 p53 signaling pathway | 0.153 | 0.00244 | ATR, MDM2, PERP, SESN3 |
*: FDR<0.2
The significantly enriched KEGG pathways of the down regulated transcripts in CRC epithelial cells was given in Table 3. It can be seen that in CRC epithelial cells, the activity of Mineral absorption, Aldosterone-regulated sodium reabsorption and Oxidative phosphorylation were decreased. Han et al. have also reported that the differentially expressed genes (DEGs) of Colorectal cancer were enriched in mineral absorption [54].
The significantly enriched KEGG pathways of the down regulated transcripts in CRC epithelial cells
| KEGG pathway | FDR* | P value | Transcripts |
|---|---|---|---|
| hsa04978 Mineral absorption | 0.000195 | 6.21E-07 | SLC26A3, MT1E, MT1F, MT1G, MT1M, MT1X, MT2A |
| hsa04960 Aldosterone-regulated sodium reabsorption | 0.000236 | 1.50E-06 | HSD11B2, NR3C2, SCNN1A, SCNN1G, SGK1, NEDD4L |
| hsa00190 Oxidative phosphorylation | 0.0295 | 0.000347 | NDUFB1, COX6B1, COX7A2, COX7C, ATP5C1, ATP5G1, ATP5H |
| hsa04972 Pancreatic secretion | 0.029 | 0.000376 | PLA2G10, CLCA1, CLCA4, SLC26A3, SLC4A4, CA2 |
| hsa05012 Parkinson's disease | 0.0311 | 0.000516 | NDUFB1, COX6B1, COX7A2, COX7C, ATP5C1, ATP5G1, ATP5H |
| hsa00910 Nitrogen metabolism | 0.0311 | 0.000595 | CA1, CA7, CA2 |
*: FDR<0.05
The significantly enriched GO biological process (BP), molecular function (MF) and cellular component (CC) terms of the up regulated transcripts in CRC epithelial cells was given in Table S2. The significantly enriched GO biological process (BP), molecular function (MF) and cellular component (CC) terms of the down regulated transcripts in CRC epithelial cells was given in Table S3.
The network of the key transcripts in CRC epithelial cells
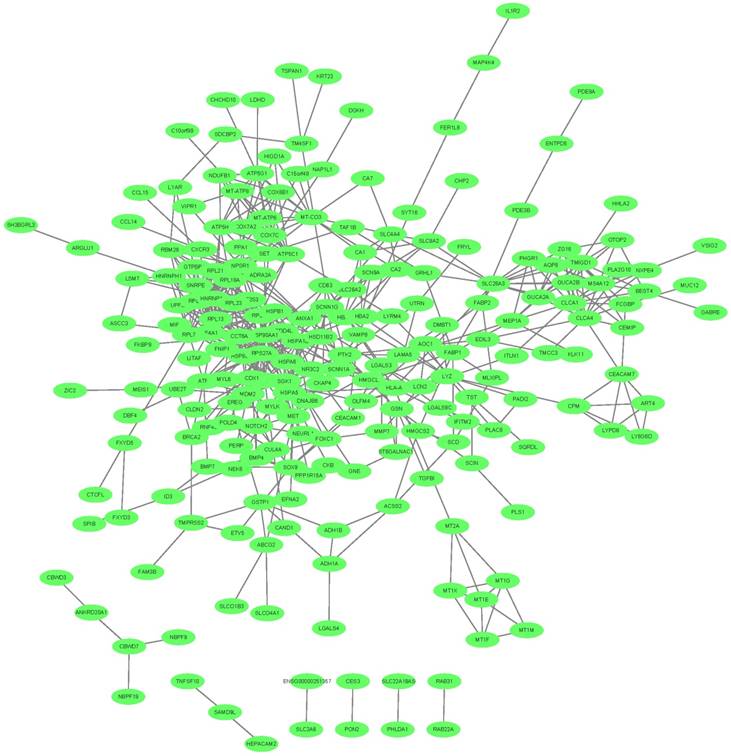
We mapped the 342 key transcripts in CRC epithelial cells onto STRING network [55] and constructed their interaction network with confidence score greater than 0.4. The network was shown in Figure 3. 280 genes can be mapped and they had 578 interactions which were much more than expected 349 edges with PPI (Protein-Protein Interaction) enrichment p-value smaller than 1.0e-16. They were biologically connected as a group.
The network of the key transcripts in CRC epithelial cells. The 342 key transcripts in CRC epithelial cells were mapped onto STRING network. The 280 mapped genes had 578 interactions which were much more than expected with PPI (Protein-Protein Interaction) enrichment p-value smaller than 1.0e-16. They were closely connected.
Compare the key transcripts with other CRC signature genes
We compared the 342 key transcripts with other CRC signature genes. Chu et al. did a meta-analysis of the differentially expressed genes between colorectal tumors and normal mucosa in 16 datasets and identified a 55-gene CRC signature [56]. Table S4 listed the 55 CRC signature genes from Chu et al. [56]. We did hypergeometric test of the overlap between the 55 CRC signature genes and our 342 genes. There were 22 overlapped genes: ABCG2, AQP8, CA1, CA7, CDH3, CHP2, CLCA1, CLCA4, CPM, FCGBP, GUCA2A, GUCA2B, KIAA1199, KLK11, MMP7, MS4A12, MT1M, NR3C2, SLC26A3, SLC4A4, SPIB, ZG16. The p-value was 2.2e-30 and the odds ratio was 75.5. Their overlap was very significant.
Discussion
Overall, in CRC epithelial cells, the biological processes of SRP-dependent co-translational protein targeting to membrane, co-translational protein targeting to membrane, protein targeting to ER, establishment of protein localization to endoplasmic reticulum, negative regulation of cell cycle arrest, response to oxidative stress, negative regulation of programmed cell death, regulation of cellular response to stress, negative regulation of cell death, regulation of cell cycle process, regulation of cell cycle, cellular response to stress, ribosome biogenesis and cell death were enriched for the up regulated transcripts. Many of them were typical cancer related pathways. For the down regulated transcripts in CRC epithelial cells, they were enriched onto cellular response to zinc ion, response to zinc ion, cellular response to cadmium ion and digestion biological processes. These were epithelial cell specific functions in normal tissues but disrupted in tumor tissue.
Tumor heterogeneity is a key issue for cancer diagnosis and treatment. The traditional analysis of tumor tissues from cancer patients are usually difficult to reproduce since the tumor tissue is a mixture of different cells. The single cell sequencing enables the gene expression profiles on cell level. In this study, we analyzed the single-cell transcriptome of CRC epithelial cells and normal epithelial cells and identified the differentially expressed transcripts using advanced machine learning methods. It was found that the upregulated transcripts in CRC epithelial cells were significantly enriched in Ribosome, Protein processing in endoplasmic reticulum, Antigen processing and presentation and p53 signaling pathway while the downregulated transcripts in CRC epithelial cells were significantly enriched in Mineral absorption, Aldosterone-regulated sodium reabsorption and Oxidative phosphorylation pathways. The biological analysis of selected transcripts revealed the possible mechanism of colorectal cancer.
Supplementary Material
Supplementary tables.
Acknowledgements
This study was supported by National Natural Science Foundation of China (31701151), National Key R&D Program of China (2018YFC0910403), Shanghai Municipal Science and Technology Major Project (Grant No. 2017SHZDZX01), Shanghai Sailing Program (16YF1413800) and The Youth Innovation Promotion Association of Chinese Academy of Sciences (CAS) (2016245).
Author contributions
Dr. Zhang GL and Wang JH contributed to the study design. Pan LL conducted the literature search. Huang T and Wang JH acquired the data. Zhang GL and Pan LL wrote the article. Huang T and Wang JH revised the article and gave the final approval of the version to be submitted. All authors read and approved the final manuscript.
Competing Interests
The authors have declared that no competing interest exists.
References
1. Brenner H, Kloor M, Pox CP. Colorectal cancer. Lancet (London, England). 2014;383:1490-502
2. Siegel R, Desantis C, Jemal A. Colorectal cancer statistics, 2014. CA: a cancer journal for clinicians. 2014;64:104-17
3. Zhang TM, Huang T, Wang RF. Cross talk of chromosome instability, CpG island methylator phenotype and mismatch repair in colorectal cancer. Oncol Lett. 2018;16:1736-46
4. Sebio A, Kahn M, Lenz HJ. The potential of targeting Wnt/beta-catenin in colon cancer. Expert opinion on therapeutic targets. 2014;18:611-5
5. Gong J, Shen N, Zhang HM, Zhong R, Chen W, Miao X. et al. A genetic variant in microRNA target site of TGF-beta signaling pathway increases the risk of colorectal cancer in a Chinese population. Tumour biology: the journal of the International Society for Oncodevelopmental Biology and Medicine. 2014;35:4301-6
6. Sun Y, Tian H, Wang L. Effects of PTEN on the proliferation and apoptosis of colorectal cancer cells via the phosphoinositol-3-kinase/Akt pathway. Oncology reports. 2015;33:1828-36
7. Marmol I, Sanchez-de-Diego C, Pradilla Dieste A, Cerrada E, Rodriguez Yoldi MJ. Colorectal Carcinoma: A General Overview and Future Perspectives in Colorectal Cancer. International journal of molecular sciences. 2017:18
8. Liang J, Cai W, Sun Z. Single-cell sequencing technologies: current and future. Journal of genetics and genomics = Yi chuan xue bao. 2014;41:513-28
9. Baslan T, Hicks J. Unravelling biology and shifting paradigms in cancer with single-cell sequencing. Nature reviews Cancer. 2017;17:557-69
10. Ellsworth DL, Blackburn HL, Shriver CD, Rabizadeh S, Soon-Shiong P, Ellsworth RE. Single-cell sequencing and tumorigenesis: improved understanding of tumor evolution and metastasis. Clinical and translational medicine. 2017;6:15
11. Gerbe F, Legraverend C, Jay P. The intestinal epithelium tuft cells: specification and function. Cellular and molecular life sciences: CMLS. 2012;69:2907-17
12. Wang J, Hu G, Lin Z, He L, Xu L, Zhang Y. Characteristic and functional analysis of a newly established porcine small intestinal epithelial cell line. PloS one. 2014;9:e110916
13. Ferreira AR, Felgueiras J, Fardilha M. Signaling pathways in anchoring junctions of epithelial cells: cell-to-cell and cell-to-extracellular matrix interactions. Journal of receptor and signal transduction research. 2015;35:67-75
14. Li H, Courtois ET, Sengupta D, Tan Y, Chen KH, Goh JJL. et al. Reference component analysis of single-cell transcriptomes elucidates cellular heterogeneity in human colorectal tumors. Nature genetics. 2017;49:708-18
15. Peng H, Long F, Ding C. Feature selection based on mutual information: criteria of max-dependency, max-relevance, and min-redundancy. IEEE Trans Pattern Anal Mach Intell. 2005;27:1226-38
16. Zhou Y, Zhang N, Li BQ, Huang T, Cai YD, Kong XY. A method to distinguish between lysine acetylation and lysine ubiquitination with feature selection and analysis. Journal of Biomolecular Structure and Dynamics. 2015:1-12
17. Zhao TH, Jiang M, Huang T, Li BQ, Zhang N, Li HP. et al. A novel method of predicting protein disordered regions based on sequence features. BioMed Research International. 2013;2013:414327
18. Niu B, Huang G, Zheng L, Wang X, Chen F, Zhang Y. et al. Prediction of substrate-enzyme-product interaction based on molecular descriptors and physicochemical properties. BioMed Research International. 2013;2013:674215
19. Zhang N, Wang M, Zhang P, Huang T. Classification of cancers based on copy number variation landscapes. Biochimica et Biophysica Acta (BBA) - General Subjects. 2016;1860:2750-5
20. Liu L, Chen L, Zhang YH, Wei L, Cheng S, Kong X. et al. Analysis and prediction of drug-drug interaction by minimum redundancy maximum relevance and incremental feature selection. Journal of Biomolecular Structure & Dynamics. 2017;35:312-29
21. Li J, Huang T. Predicting and analyzing early wake-up associated gene expressions by integrating GWAS and eQTL studies. Biochimica et Biophysica Acta (BBA) - Molecular Basis of Disease. 2017
22. Huang T, Cai Y-D. An Information-Theoretic Machine Learning Approach to Expression QTL Analysis. PLoS ONE. 2013;8:e67899
23. Sun L, Yu Y, Huang T, An P, Yu D, Yu Z. et al. Associations between ionomic profile and metabolic abnormalities in human population. PLoS ONE. 2012;7:e38845
24. Zhang N, Huang T, Cai YD. Discriminating between deleterious and neutral non-frameshifting indels based on protein interaction networks and hybrid properties. Mol Genet Genomics. 2014
25. Shu Y, Zhang N, Kong X, Huang T, Cai YD. Predicting A-to-I RNA Editing by Feature Selection and Random Forest. PLoS ONE. 2014;9:e110607
26. Li BQ, You J, Huang T, Cai YD. Classification of non-small cell lung cancer based on copy number alterations. PLoS ONE. 2014;9:e88300
27. Jiang Y, Huang T, Chen L, Gao YF, Cai Y, Chou KC. Signal propagation in protein interaction network during colorectal cancer progression. BioMed Research International. 2013;2013:287019
28. Zhang PW, Chen L, Huang T, Zhang N, Kong XY, Cai YD. Classifying ten types of major cancers based on reverse phase protein array profiles. PLoS ONE. 2015;10:e0123147
29. Huang T, Shu Y, Cai Y-D. Genetic differences among ethnic groups. BMC Genomics. 2015;16:1093
30. Chen L, Li J, Zhang YH, Feng K, Wang S, Zhang Y. et al. Identification of gene expression signatures across different types of neural stem cells with the Monte-Carlo feature selection method. J Cell Biochem. 2017
31. Pan X, Hu X, Zhang Y-H, Chen L, Zhu L, Wan S. et al. Identification of the copy number variant biomarkers for breast cancer subtypes. Molecular Genetics and Genomics. 2019;294:95-110
32. Chen L, Zhang S, Pan X, Hu X, Zhang YH, Yuan F. et al. HIV infection alters the human epigenetic landscape. Gene Ther. 2019;26:29-39
33. Chen L, Zhang Y-H, Pan X, Liu M, Wang S, Huang T. et al. Tissue Expression Difference between mRNAs and lncRNAs. International Journal of Molecular Sciences. 2018;19:3416
34. Chen L, Pan X, Zhang Y-H, Liu M, Huang T, Cai Y-D. Classification of Widely and Rarely Expressed Genes with Recurrent Neural Network. Computational and Structural Biotechnology Journal. 2019;17:49-60
35. Wu MM, Li CF, Lin LF, Wang AS, Pu YS, Wang HH. et al. Promoter hypermethylation of LGALS4 correlates with poor prognosis in patients with urothelial carcinoma. Oncotarget. 2017;8:23787-802
36. Rao US, Rao PS. Surface-bound galectin-4 regulates gene transcription and secretion of chemokines in human colorectal cancer cell lines. Tumour biology: the journal of the International Society for Oncodevelopmental Biology and Medicine. 2017;39:1010428317691687
37. Oltedal S, Skaland I, Maple-Grodem J, Tjensvoll K, Janssen EAM, Gilje B. et al. Expression profiling and intracellular localization studies of the novel Proline-, Histidine-, and Glycine-rich protein 1 suggest an essential role in gastro-intestinal epithelium and a potential clinical application in colorectal cancer diagnostics. BMC gastroenterology. 2018;18:26
38. Su A, Ra S, Li X, Zhou J, Binder S. Differentiating cutaneous squamous cell carcinoma and pseudoepitheliomatous hyperplasia by multiplex qRT-PCR. Modern pathology: an official journal of the United States and Canadian Academy of Pathology, Inc. 2013;26:1433-7
39. Klopfleisch R, Klose P, da Costa A, Brunnberg L, Gruber AD. HEPACAM1 and 2 are differentially regulated in canine mammary adenomas and carcinomas and its lymph node metastases. BMC veterinary research. 2010;6:15
40. Li XL, Zhou J, Chen ZR, Chng WJ. P53 mutations in colorectal cancer - molecular pathogenesis and pharmacological reactivation. World journal of gastroenterology. 2015;21:84-93
41. Ostasiewicz B, Ostasiewicz P, Dus-Szachniewicz K, Ostasiewicz K, Ziolkowski P. Quantitative analysis of gene expression in fixed colorectal carcinoma samples as a method for biomarker validation. Molecular medicine reports. 2016;13:5084-92
42. Qi C, Hong L, Cheng Z, Yin Q. Identification of metastasis-associated genes in colorectal cancer using metaDE and survival analysis. Oncology letters. 2016;11:568-74
43. Arriaga JM, Greco A, Mordoh J, Bianchini M. Metallothionein 1G and zinc sensitize human colorectal cancer cells to chemotherapy. Molecular cancer therapeutics. 2014;13:1369-81
44. Chen L, Zhu YY, Zhang XJ, Wang GL, Li XY, He S. et al. TSPAN1 protein expression: a significant prognostic indicator for patients with colorectal adenocarcinoma. World journal of gastroenterology. 2009;15:2270-6
45. Zhang J, Fei B, Wang Q, Song M, Yin Y, Zhang B. et al. MicroRNA-638 inhibits cell proliferation, invasion and regulates cell cycle by targeting tetraspanin 1 in human colorectal carcinoma. Oncotarget. 2014;5:12083-96
46. Mooney SM, Rajagopalan K, Williams BH, Zeng Y, Christudass CS, Li Y. et al. Creatine kinase brain overexpression protects colorectal cells from various metabolic and non-metabolic stresses. Journal of cellular biochemistry. 2011;112:1066-75
47. Chen L, Zhang Y-H, Wang S, Zhang Y, Huang T, Cai Y-D. Prediction and analysis of essential genes using the enrichments of gene ontology and KEGG pathways. PLOS ONE. 2017;12:e0184129
48. Chen L, Zhang Y-H, Lu G, Huang T, Cai Y-D. Analysis of cancer-related lncRNAs using gene ontology and KEGG pathways. Artificial Intelligence in Medicine. 2017;76:27-36
49. Zhang YH, Chu C, Wang S, Chen L, Lu J, Kong X. et al. The Use of Gene Ontology Term and KEGG Pathway Enrichment for Analysis of Drug Half-Life. PLoS ONE. 2016;11:e0165496
50. Chen L, Zhang Y-H, Zheng M, Huang T, Cai Y-D. Identification of compound-protein interactions through the analysis of gene ontology, KEGG enrichment for proteins and molecular fragments of compounds. Molecular Genetics and Genomics. 2016
51. Chen L, Chu C, Lu J, Kong X, Huang T, Cai YD. Gene Ontology and KEGG Pathway Enrichment Analysis of a Drug Target-Based Classification System. PLoS ONE. 2015;10:e0126492
52. Yang J, Chen L, Kong X, Huang T, Cai YD. Analysis of Tumor Suppressor Genes Based on Gene Ontology and the KEGG Pathway. PLoS ONE. 2014;9:e107202
53. Li Z, Li BQ, Jiang M, Chen L, Zhang J, Liu L. et al. Prediction and analysis of retinoblastoma related genes through gene ontology and KEGG. BioMed Research International. 2013;2013:304029
54. Han B, Feng D, Yu X, Zhang Y, Liu Y, Zhou L. Identification and Interaction Analysis of Molecular Markers in Colorectal Cancer by Integrated Bioinformatics Analysis. Medical science monitor: international medical journal of experimental and clinical research. 2018;24:6059-69
55. Szklarczyk D, Gable AL, Lyon D, Junge A, Wyder S, Huerta-Cepas J. et al. STRING v11: protein-protein association networks with increased coverage, supporting functional discovery in genome-wide experimental datasets. Nucleic acids research. 2018
56. Chu CM, Yao CT, Chang YT, Chou HL, Chou YC, Chen KH. et al. Gene expression profiling of colorectal tumors and normal mucosa by microarrays meta-analysis using prediction analysis of microarray, artificial neural network, classification, and regression trees. Disease markers. 2014;2014:634123
Author contact
![]() Corresponding authors: Jin-Hai Wang, Department of Colorectal Surgery, The First Affiliated Hospital, College of Medicine, Zhejiang University, Hangzhou 310003, Zhejiang, China, Email: wangyxedu.cn, Tel: +86-571-87236131 or Tao Huang, Shanghai Institute of Nutrition and Health, Shanghai Institutes for Biological Sciences, Chinese Academy of Sciences, Shanghai 200031, China, Email: huangtaoac.cn, Tel: +86-21-54923269
Corresponding authors: Jin-Hai Wang, Department of Colorectal Surgery, The First Affiliated Hospital, College of Medicine, Zhejiang University, Hangzhou 310003, Zhejiang, China, Email: wangyxedu.cn, Tel: +86-571-87236131 or Tao Huang, Shanghai Institute of Nutrition and Health, Shanghai Institutes for Biological Sciences, Chinese Academy of Sciences, Shanghai 200031, China, Email: huangtaoac.cn, Tel: +86-21-54923269