Impact Factor ISSN: 1837-9664

 Global reach, higher impact
J Cancer 2019; 10(21):5173-5190. doi:10.7150/jca.29655 This issue Cite
Research Paper
Diagnostic and prognostic biomarkers of Human Leukocyte Antigen complex for hepatitis B virus-related hepatocellular carcinoma
Xiang-Kun Wang1, Xi-Wen Liao1, Cheng-Kun Yang1, Ting-Dong Yu1, Zheng-Qian Liu1, Yi-Zhen Gong2, Ke-Tuan Huang1, Xian-Min Zeng1, Chuang-Ye Han1, Guang-Zhi Zhu1, Wei Qin1, Tao Peng1 ![]()
1. Department of Hepatobiliary Surgery, The First Affiliated Hospital of Guangxi Medical University, Nanning, 530021, Guangxi Province, China
2. Department of Colorectal and Anal Surgery, The First Affiliated Hospital of Guangxi Medical University, Nanning, 530021, Guangxi Province, China
Received 2018-9-2; Accepted 2019-7-25; Published 2019-8-28
Abstract
Background: Hepatitis B virus infection had been identified its relationship with liver diseases, including liver tumors. We aimed to explore diagnostic and prognostic values between the Human Leukocyte Antigen (HLA) complex and hepatocellular carcinoma (HCC).
Methods: We used the GSE14520 dataset to explore diagnostic and prognostic significance between HLA complex and HCC. A nomogram was constructed to predict survival probability of HCC prognosis. Gene set enrichment analysis was explored using gene ontologies and metabolic pathways. Validation of prognostic values of the HLA complex was performed in the Kaplan-Meier Plotter website.
Results: We found that HLA-C showed the diagnostic value (P <0.0001, area under curve: 0.784, sensitivity: 93.14%, specificity: 62.26%). In addition, HLA-DQA1 and HLA-F showed prognostic values for overall survival, and HLA-A, HLA-C, HLA-DPA1 and HLA-DQA1 showed prognostic values for recurrence-free survival (all P ≤ 0.05, elevated 0.927, 0.992, 1.023, 0.918, 0.937 multiples compared to non-tumor tissues, respectively). Gene set enrichment analysis found that they were involved in antigen processing and toll like receptor signalling pathway, etc. The nomogram was evaluated for survival probability of HCC prognosis. Validation analysis indicated that HLA-C, HLA-DPA1, HLA-E, HLA-F and HLA-G were associated with HCC prognosis of overall survival (all P ≤ 0.05, elevated 0.988 and 0.997 multiples compared to non-tumor tissues, respectively).
Conclusion: HLA-C might be a diagnostic and prognostic biomarker for HCC. HLA-DPA1 and HLA-F might be prognostic biomarkers for HCC.
Introduction
In less developed countries, liver cancer was the second leading cause of cancer-related deaths worldwide in the male population [1]. It was estimated that roughly 782,500 cases of new liver cancer and 745,500 deaths occurred in 2012, with China accounting for 50% of all the new cases and deaths [1]. Hepatocellular carcinoma (HCC) accounted for 70% to 90% of primary liver cancers worldwide [2]. Aetiologically, many factors, such as dietary aflatoxin exposure, alcohol consumption [3], hepatitis B virus (HBV) infection, hepatitis C virus infection, diabetes mellitus, obesity [4] and cirrhosis [5], had been reported to be associated with the development of HCC. Meanwhile, many treatments had been applied, such as radical hepatectomy, liver transplantation, percutaneous ethanol injection, radiofrequency ablation and transarterial chemoembolisation [5]. Even with these advances, the prognosis of HCC patients remained poor, with the 5-year survival rate less than 15% [6, 7]. Currently, the diagnosis of HCC had relied on α-fetoprotein (AFP) levels. However, the sensitivity and specificity of AFP levels were not sufficient for HCC diagnosis, as patients with cirrhosis and chronic hepatitis could show elevated AFP levels [8]. Therefore, it was of significance to identify new biomarkers for the early diagnosis of HCC.
Human Leukocyte Antigen (HLA) complex, ~4Mb and on chromosome 6 p21 in humans, is composed of HLA-A, HLA-B, HLA-C, HLA-DMA, HLA-DMB, HLA-DOA, HLA-DOB, HLA-DPA1, HLA-DPB1, HLA-DQA1, HLA-DQB1, HLA-DQB2, HLA-DRA, HLA-DRB1, HLA-DRB4, HLA-DRB6, HLA-E, HLA-F and HLA-G. HLA plays a key role in antigen presentation to T cells and the basic formation of host defence mechanisms against pathogens [9, 10]. HLA, encoding major histocompatibility complex (MHC), is also important in vaccine development and has a determining role in transplantation outcomes [11]. Members of this complex have been investigated for disease initiation and progression. A good clinical outcome is associated with high-solution HLA-matching in haematopoietic stem cell transplantation [12, 13]. HAL-B Bw4-80lle, combined with the KIR3DS1 gene, can significantly affect outcomes of chronic hepatitis B patients who were treated with alpha interferon [14]. It had been documented that HLA-G, a nonclassical HLA class I molecule, positivity was related to the disease in breast cancer, renal cell carcinoma, lung cancer and malignant melanoma, also indicating differential expressions in lobular and ductal subtypes [15]. HLA-G played a pivotal function in maternal-foetal tolerance during pregnancy [16], and aberrant expression of HLA-G was observed in multiple malignant cell types, which might be related to the procedure of escape host immunosurveillance [17]. HLA-DRB1*01 had been observed to be associated with hepatic hypersensitivity reactions [18]. Given previous studies on members of the HLA complex with tumours, we, therefore, conducted an investigation that aimed to find relationship a between the HLA complex and HCC.
Materials and Methods
Data collection
Profiling data of the GSE14520 dataset was obtained from the Gene Expression Omnibus (GEO, https://www.ncbi.nlm.nih.gov/geo/query/acc.cgi?acc=gse14520, accessed May 5, 2018) website. This dataset contains two platforms: GPL571 (Affymetrix Human Genome U133A 2.0 Array) and GPL3921 (Affymetrix HT Human Genome U133A Array) [19, 20]. Only GPL3921 data were used in our study to avoid batch effect. Patients with HBV infection were included in the present study.
Expression collection of HLA family genes
Transcription, interactive bodymap and gene expression levels were collected from Gene Expression Profiling Interactive Analysis (GEPIA, http://gepia.cancer-pku.cn/index.html, accessed May 6, 2018) [21]. Protein expressions of HLA family genes were collected from The Human Protein Atlas (https://www.proteinatlas.org/, accessed accessed May 6, 2018) website [22].
Gene set enrichment analysis
Gene set enrichment analysis (GSEA) was performed to obtain biological processes and metabolic pathways of HLA family genes at the transcriptional level. Datasets of c2.cp.kegg.v6.1.symbols.gmt, c5.bp.b6.1.symbols.gmt, c5.cc.v6.1.symbols.gmt and c5.mf.v6.1.symbols.gmt were utilised to analyse significant gene ontology (GO), including biological process (BP), cellular component (CC), molecular function (MF) and metabolic pathway [23, 24].
Association and interaction analysis
Pearson correlation analysis among HLA family genes was performed using R version 3.5.0 (https://www.r-project.org/). A co-expression interactive network of gene-gene was constructed using the geneMANIA plugin of Cytoscape software version 3.6.0 [25, 26]. A protein-protein interaction (PPI) network was constructed using STRING (https://string-db.org/cgi/input.pl, accessed May 8, 2018) website [27]. Visualised enrichment analysis of GO was conducted using the BiNGO plugin of Cytoscape software version 3.6.0 [28].
Diagnostic and survival analysis
Overall survival (OS) and recurrence-free survival (RFS) were calculated using Kaplan-Meier and Cox proportional hazards regression models. Gene expressions were categorised into low expression and high expression groups at a cut-off of median expression level. Statistically significant factors were adjusted for survival analysis. OS and RFS-related genes were further analysed for joint-analysis. Validation of prognostic values of HLA family genes were further conducted in the Kaplan-Meier Plotter (http://kmplot.com/analysis/, accessed May 12, 2018) website [29].
Expression model and nomogram construction
To further explore prognosis-related genes in both univariate and multivariate analyses for HCC survival, we further constructed expression models for OS and RFS prediction. Nomograms were constructed using clinical factors and gene expressions. Different factors and gene expressions showed different points. Taken together, total points can predict HCC patient probability of survival at 1 year, 3 years and 5 years.
Stratified and joint-effect analysis
Prognosis (OS and RFS)-related genes were further stratified for analysis in clinical factors. Genes related to OS and RFS in the multivariate analysis were further stratified for analysis with demographic and clinical factors. In addition, prognosis (OS and RFS)-related genes were joined for combination analysis. Expressions that indicated a good prognosis were conferred a score of 1, whereas bad prognoses were conferred a score of 0.
Statistical analysis
Survival analyses were performed using SPSS software version 16.0 (IBM, Chicago, IL). Median survival time (MST) and log-rank P were calculated by Kaplan-Meier method, as well as 95% confidence interval (CI) and hazard ratio (HR) were calculated by univariate and multivariate Cox proportional hazards regression models. Box plots and survival plots were obtained using GraphPad software version 7.0. P value ≤ 0.05 was statistically significant.
Results
Demographic and clinical characteristics of HCC patients
A total of 212 HBV-related HCC patients were included in the present study. Tumour size, cirrhosis, AFP and BCLC stage showed significance in OS (P = 0.002, 0.041, 0.049 and < 0.0001, respectively). Gender, cirrhosis and BCLC stage showed significance in RFS (P = 0.002, 0.036, and < 0.0001, respectively). Other factors did not show significance (all P > 0.05, Supplementary Table 1).
Expression and transcription analysis
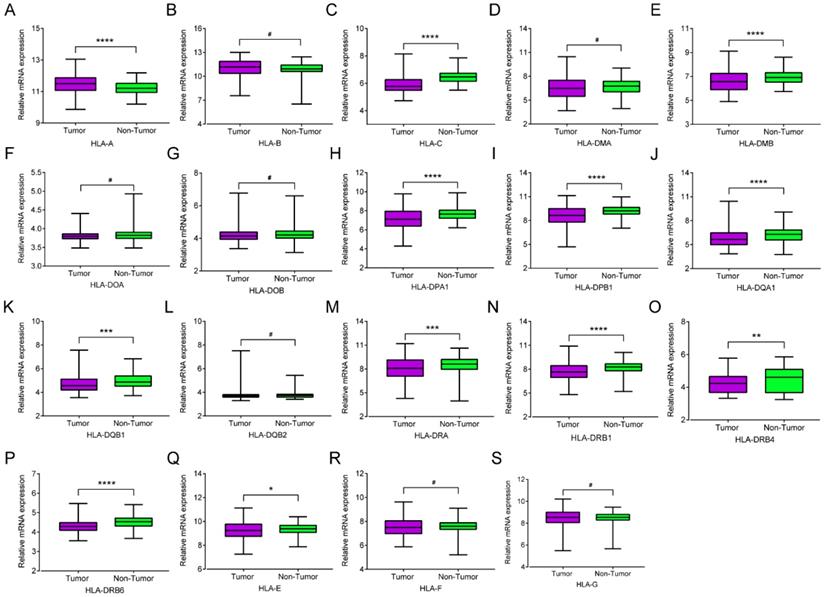
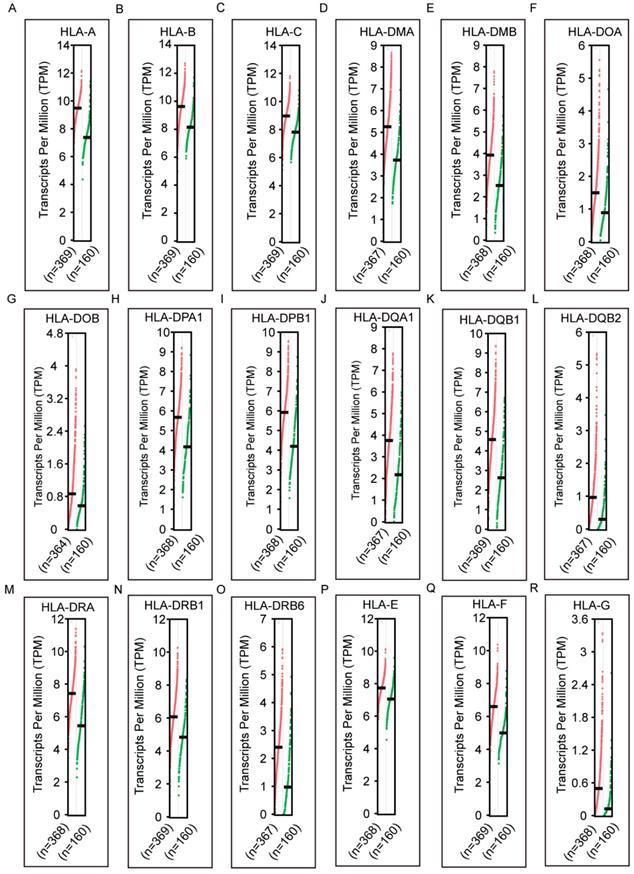
mRNA expression of HLA family members showed that HLA-A, HLA-C, HLA-DMA, HLA-DPA1, HLA-DPB1, HLA-DQA1, HLA-DQB1, HLA-DRA, HLA-DRB1, HLA-DRB4, HLA-DRB6 and HLA-E showed significance in the comparison between tumour and normal tissues (all P ≤ 0.05, Figure 1A, C, E, H-K, M-Q). However, other genes did not show significance (all P > 0.05, Figure 1B, D, F, G, L, R-S). Protein expression showed that all of the HLA family members had low levels of expression in the liver, except HLA-A, HLA-C, HLA-DQB2, HLA-DRB4, HLA-DRB6 and HLA-F did show in the Human Protein Atlas website (Supplementary Figure 1). A bodymap of HLA family members in human organs was shown in Supplementary Figure 2. Transcriptional analysis indicated that all the members consistently showed higher transcripts per millions in tumour tissues compared with normal tissues (Figure 2).
Relative mRNA expressions of HLA family in tumor and non-tumor tissues. A-S: HLA-A, B, C, DMA, DMB, DOA, DOB, DPA1, DPB1, DQA1, DQB1, DQB2, DRA, DRB4, DRB6,E, F, G respectively. Note: *: P ≤ 0.05; **: P ≤ 0.01; ***: P ≤ 0.001; ****: P ≤ 0.0001; #: P>0.05.
Transcriptional levels of HLA family in tumor and normal tissues. A-S: HLA-A, B, C, DMA, DMB, DOA, DOB, DPA1, DPB1, DQA1, DQB1, DQB2, DRA, DRB4, DRB6,E, F, G respectively.
Diagnostic and prognostic analysis
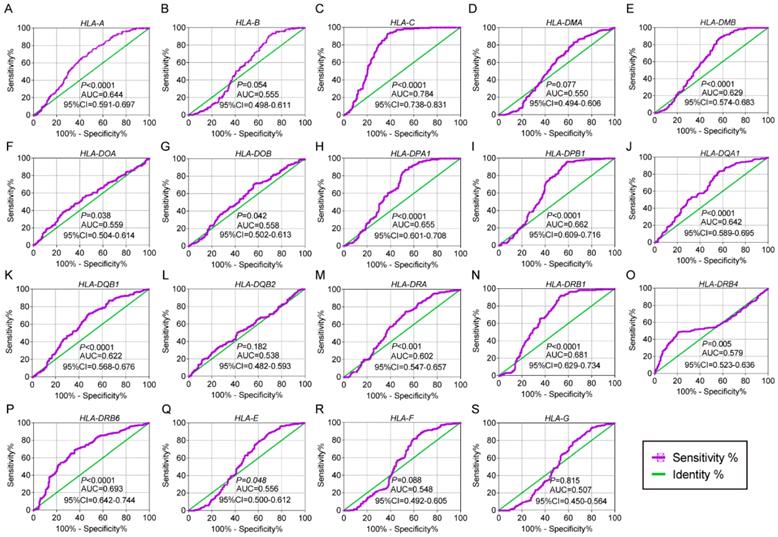
In the diagnostic analysis of the HLA family, HLA-A, HLA-C, HLA-DMB, HLA-DOA, HLA-DOB, HLA-DPA1, HLA-DPB1, HLA-DQA1, HLA-DQB1, HLA-DRA, HLA-DRB1, HLA-DRB4, HLA-DRB6 and HLA-E showed significance for HCC diagnosis (all P ≤ 0.05, Figure 3A, C, E-K, M-Q). HLA-C showed the highest area under curve (AUC, 0.784).
Diagnostic receiver operating characteristic curves of HLA family. A-S HLA-A, B, C, DMA, DMB, DOA, DOB, DPA1, DPB1, DQA1, DQB1, DQB2, DRA, DRB4, DRB6,E, F, G respectively.
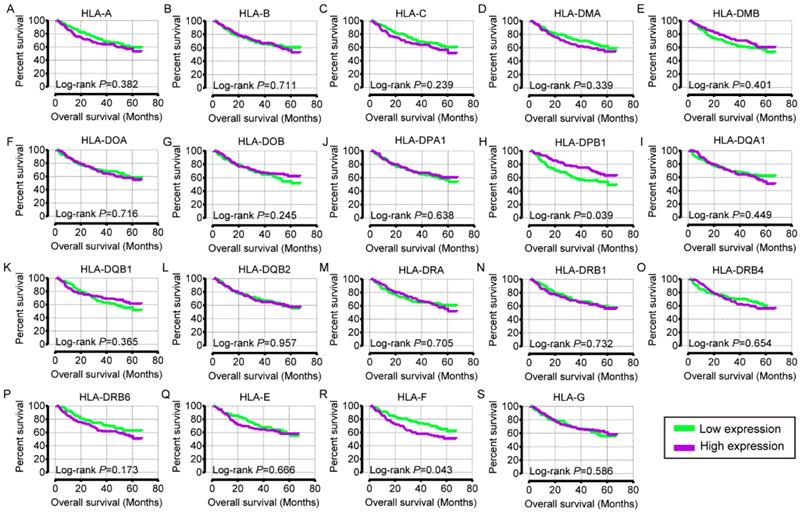
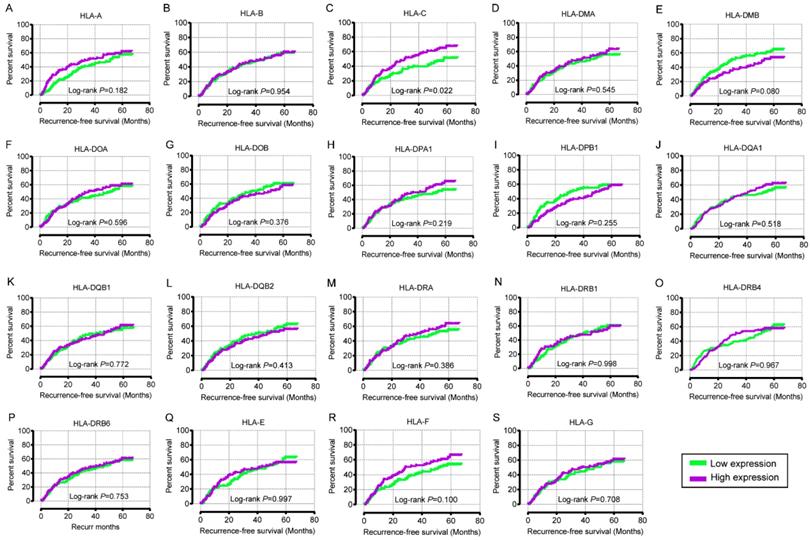
In the univariate OS analysis, only HLA-DPB1 and HLA-F showed significance (crude P = 0.039 and 0.043, respectively; Table 1, Figure 4H, R). In the multivariate OS analysis, HLA-DQA1 and HLA-F showed significance (adjusted P = 0.012 and 0.014, Table 1). In the univariate RFS analysis, only HLA-C showed significance (crude P = 0.022; Table 2, Figure 5C). In the multivariate RFS analysis, HLA-A, HLA-C, HLA-DPA1 and HLA-DQA1 showed significance (adjusted P = 0.019, 0.031, 0.040 and 0.030, respectively; Table 2).
Overall survival analysis of HLA family genes
| Variables | Overall survival | ||||||
|---|---|---|---|---|---|---|---|
| Patients (n=212) | No. of event | MST (month) | HR (95%CI) | Crude P value | HR (95%CI) | Adjusted P valueɸ | |
| HLA-A | |||||||
| Low expression | 106 | 43 | NA | Ref. | Ref. | ||
| High expression | 106 | 39 | NA | 0.824 (0.534-1.271) | 0.382 | 0.730 (0.468-1.139) | 0.166 |
| HLA-B | |||||||
| Low expression | 106 | 43 | NA | Ref. | Ref. | ||
| High expression | 106 | 39 | NA | 0.921 (0.597-1.421) | 0.711 | 1.016 (0.657-1.573) | 0.942 |
| HLA-C | |||||||
| Low expression | 106 | 45 | NA | Ref. | Ref. | ||
| High expression | 106 | 37 | NA | 0.770 (0.498-1.190) | 0.239 | 0.736 (0.474-1.141) | 0.170 |
| HLA-DMA | |||||||
| Low expression | 106 | 44 | NA | Ref. | Ref. | ||
| High expression | 106 | 38 | NA | 0.809 (0.524-1.249) | 0.339 | 0.785 (0.508-1.215) | 0.278 |
| HLA-DMB | |||||||
| Low expression | 106 | 38 | NA | Ref. | Ref. | ||
| High expression | 106 | 44 | NA | 1.204 (0.780-1.859) | 0.401 | 1.173 (0.745-1.845) | 0.491 |
| HLA-DOA | |||||||
| Low expression | 106 | 43 | NA | Ref. | Ref. | ||
| High expression | 106 | 39 | NA | 0.923 (0.598-1.423) | 0.716 | 0.997 (0.636-1.562) | 0.988 |
| HLA-DOB | |||||||
| Low expression | 106 | 37 | NA | Ref. | Ref. | ||
| High expression | 106 | 45 | NA | 1.295 (0.838-2.001) | 0.245 | 1.304 (0.837-2.030) | 0.241 |
| HLA-DPA1 | |||||||
| Low expression | 106 | 38 | NA | Ref. | Ref. | ||
| High expression | 106 | 44 | NA | 1.110 (0.719-1.713) | 0.638 | 1.198 (0.766-1.874) | 0.429 |
| HLA-DPB1 | |||||||
| Low expression | 106 | 35 | NA | Ref. | Ref. | ||
| High expression | 106 | 47 | 60.50 | 1.587 (1.024-2.460) | 0.039 | 1.566 (0.998-2.458) | 0.051 |
| HLA-DQA1 | |||||||
| Low expression | 106 | 44 | NA | Ref. | Ref. | ||
| High expression | 106 | 38 | NA | 0.846 (0.548-1.306) | 0.449 | 0.563 (0.359-0.883) | 0.012 |
| HLA-DQB1 | |||||||
| Low expression | 106 | 38 | NA | Ref. | Ref. | ||
| High expression | 106 | 44 | NA | 1.222 (0.792-1.888) | 0.365 | 1.393 (0.896-2.166) | 0.141 |
| HLA-DQB2 | |||||||
| Low expression | 106 | 40 | NA | Ref. | Ref. | ||
| High expression | 106 | 42 | NA | 1.012 (0.656-1.560) | 0.957 | 0.968 (0.624-1.501) | 0.884 |
| HLA-DRA | |||||||
| Low expression | 106 | 42 | NA | Ref. | Ref. | ||
| High expression | 106 | 40 | NA | 0.920 (0.596-1.418) | 0.705 | 0.816 (0.523-1.272) | 0.369 |
| HLA-DRB1 | |||||||
| Low expression | 106 | 42 | NA | Ref. | Ref. | ||
| High expression | 106 | 40 | NA | 0.927 (0.601-1.430) | 0.732 | 0.742 (0.468-1.177) | 0.205 |
| HLA-DRB4 | |||||||
| Low expression | 106 | 44 | NA | Ref. | Ref. | ||
| High expression | 106 | 38 | NA | 0.905 (0.586-1.398) | 0.654 | 0.869 (0.562-1.345) | 0.529 |
| HLA-DRB6 | |||||||
| Low expression | 106 | 46 | NA | Ref. | Ref. | ||
| High expression | 106 | 36 | NA | 0.738 (0.477-1.142) | 0.173 | 0.893 (0.569-1.402) | 0.624 |
| HLA-E | |||||||
| Low expression | 106 | 42 | NA | Ref. | Ref. | ||
| High expression | 106 | 40 | NA | 0.909 (0.589-1.402) | 0.666 | 1.102 (0.691-1.755) | 0.684 |
| HLA-F | |||||||
| Low expression | 106 | 46 | NA | Ref. | Ref. | ||
| High expression | 106 | 36 | NA | 0.636 (0.411-0.985) | 0.043 | 0.576 (0.371-0.896) | 0.014 |
| HLA-G | |||||||
| Low expression | 106 | 40 | NA | Ref. | Ref. | ||
| High expression | 106 | 42 | NA | 1.128 (0.731-1.739) | 0.586 | 1.289 (0.830-2.003) | 0.258 |
Note: ɸ: P values were adjusted for tumor size, cirrhosis, AFP and BCLC stage.
Recurrence-free survival analysis of HLA family genes
| Variables | Recurrence-free survival | ||||||
|---|---|---|---|---|---|---|---|
| Patients (n=212) | No. of event | MST (month) | HR (95%CI) | Crude P value | HR (95%CI) | Adjusted P valueѰ | |
| HLA-A | |||||||
| Low expression | 106 | 61 | 35.20 | Ref. | Ref. | ||
| High expression | 106 | 55 | 51.60 | 0.780 (0.542-1.123) | 0.182 | 0.638 (0.439-0.930) | 0.019 |
| HLA-B | |||||||
| Low expression | 106 | 58 | 43.20 | Ref. | Ref. | ||
| High expression | 106 | 58 | 45.90 | 0.989 (0.687-1.424) | 0.954 | 1.105 (0.764-1.598) | 0.597 |
| HLA-C | |||||||
| Low expression | 106 | 67 | 30.7 | Ref. | Ref. | ||
| High expression | 106 | 49 | 57.9 | 0.649 (0.448-0.938) | 0.022 | 0.664 (0.458-0.963) | 0.031 |
| HLA-DMA | |||||||
| Low expression | 106 | 61 | 40.4 | Ref. | Ref. | ||
| High expression | 106 | 55 | 49.1 | 0.894 (0.621-1.287) | 0.545 | 0.923 (0.640-1.332) | 0.669 |
| HLA-DMB | |||||||
| Low expression | 106 | 52 | 53.0 | Ref. | Ref. | ||
| High expression | 106 | 64 | 29.9 | 1.387 (0.962-2.001) | 0.080 | 1.378 (0.943-2.015) | 0.098 |
| HLA-DOA | |||||||
| Low expression | 106 | 60 | 36.0 | Ref. | Ref. | ||
| High expression | 106 | 56 | 51.1 | 0.906 (0.629-1.305) | 0.596 | 0.894 (0.617-1.294) | 0.553 |
| HLA-DOB | |||||||
| Low expression | 106 | 56 | 51.1 | Ref. | Ref. | ||
| High expression | 106 | 60 | 37.9 | 1.179 (0.819-1.697) | 0.376 | 1.116 (0.772-1.615) | 0.559 |
| HLA-DPA1 | |||||||
| Low expression | 106 | 63 | 36.6 | Ref. | Ref. | ||
| High expression | 106 | 53 | 53.3 | 0.795 (0.552-1.146) | 0.219 | 0.673 (0.462-0.982) | 0.040 |
| HLA-DPB1 | |||||||
| Low expression | 106 | 57 | 49.1 | Ref. | Ref. | ||
| High expression | 106 | 59 | 30.9 | 1.236 (0.858-1.779) | 0.255 | 1.257 (0.860-1.837) | 0.237 |
| HLA-DQA1 | |||||||
| Low expression | 106 | 61 | 40.4 | Ref. | Ref. | ||
| High expression | 106 | 55 | 53.3 | 0.887 (0.616-1.277) | 0.518 | 0.658 (0.451-0.960) | 0.030 |
| HLA-DQB1 | |||||||
| Low expression | 106 | 61 | 46.3 | Ref. | Ref. | ||
| High expression | 106 | 55 | 40.4 | 0.948 (0.658-1.365) | 0.772 | 1.009 (0.699-1.458) | 0.960 |
| HLA-DQB2 | |||||||
| Low expression | 106 | 55 | 46.3 | Ref. | Ref. | ||
| High expression | 106 | 61 | 37.9 | 1.164 (0.809-1.676) | 0.413 | 1.202 (0.833-1.735) | 0.324 |
| HLA-DRA | |||||||
| Low expression | 106 | 60 | 37.9 | Ref. | Ref. | ||
| High expression | 106 | 56 | 51.1 | 0.851 (0.591-1.226) | 0.386 | 0.786 (0.541-1.141) | 0.206 |
| HLA-DRB1 | |||||||
| Low expression | 106 | 57 | 46.3 | Ref. | Ref. | ||
| High expression | 106 | 59 | 41.6 | 1.000 (0.695-1.440) | 0.998 | 0.937 (0.635-1.380) | 0.740 |
| HLA-DRB4 | |||||||
| Low expression | 106 | 58 | 32.7 | Ref. | Ref. | ||
| High expression | 106 | 58 | 49.1 | 0.992 (0.689-1.429) | 0.967 | 0.952 (0.659-1.374) | 0.793 |
| HLA-DRB6 | |||||||
| Low expression | 106 | 59 | 43.2 | Ref. | Ref. | ||
| High expression | 106 | 57 | 46.1 | 0.943 (0.655-1.357) | 0.753 | 1.006 (0.696-1.453) | 0.975 |
| HLA-E | |||||||
| Low expression | 106 | 57 | 41.6 | Ref. | Ref. | ||
| High expression | 106 | 59 | 46.1 | 0.999 (0.694-1.439) | 0.997 | 1.087 (0.745-1.585) | 0.667 |
| HLA-F | |||||||
| Low expression | 106 | 62 | 28.7 | Ref. | Ref. | ||
| High expression | 106 | 54 | 53.0 | 0.736 (0.511-1.061) | 0.100 | 0.706 (0.488-1.021) | 0.064 |
| HLA-G | |||||||
| Low expression | 106 | 60 | 37.9 | Ref. | Ref. | ||
| High expression | 106 | 56 | 46.3 | 0.933 (0.648-1.343) | 0.708 | 1.042 (0.717-1.514) | 0.831 |
Note: Ѱ: P values were adjusted for gender, cirrhosis and BCLC stage.
Overall survival analysis plot of HLA family. A-S: HLA-A, B, C, DMA, DMB, DOA, DOB, DPA1, DPB1, DQA1, DQB1, DQB2, DRA, DRB4, DRB6, E, F, G respectively.
Recurrence-free survival analysis plot of HLA family. A-S: HLA-A, B, C, DMA, DMB, DOA, DOB, DPA1, DPB1, DQA1, DQB1, DQB2, DRA, DRB4, DRB6, E, F, G respectively.
Joint-effect analysis and stratified analysis
Expressions that indicated a good prognosis were conferred a score of 1, whereas bad prognosis was conferred a score of 0. In the joint-effect analysis of OS, the 2 scores group exhibited significant P value compared with the 0 score group (adjusted P = 0.001, Table 3). In the joint-effect analysis of RFS, the 2 scores group exhibited significant P value compared with the 0 score group (adjusted P = 0.001, Table 3). Groups of 2 scores, 3 scores and 4 scores showed significance compared with the 0 score group (adjusted P = 0.005, 0.012 and < 0.001, respectively).
Joint-effect analysis of prognostic-related genes for overall survival and recurrence-free survival
| Category | Group | Score | Patients | MST | Crude HR 95%CI | Crude P value | Adjusted HR 95%CI | Adjusted P valueɸ | Adjusted P valueѰ |
|---|---|---|---|---|---|---|---|---|---|
| OS | I | 0 | 51 | 57.9 | 0.112 | 0.002 | |||
| II | 1 score | 110 | NA | 0.873 (0.525-1.453) | 0.602 | 0.856 (0.509-1.439) | 0.558 | ||
| III | 2 scores | 51 | NA | 0.503 (0.257-0.984) | 0.045 | 0.311 (0.156-0.620) | 0.001 | ||
| RFS | A | 0 | 12 | 35.2 | 0.022 | <0.001 | |||
| B | 1 score | 59 | 21.5 | 1.275 (0.597-2.721) | 0.530 | 0.565 (0.243-1.317) | 0.186 | ||
| C | 2 scores | 74 | 54.8 | 0.689 (0.320-1.485) | 0.342 | 0.297 (0.126-0.699) | 0.005 | ||
| D | 3 scores | 51 | 53.3 | 0.783 (0.355-1.724) | 0.543 | 0.331 (0.140-0.783) | 0.012 | ||
| E | 4 scores | 16 | NA | 0.394 (0.129-1.204) | 0.102 | 0.107 (0.032-0.359) | <0.001 |
(Note: ɸ: P values in overall survival were adjusted for tumor size, cirrhosis, AFP and BCLC stage. P values in recurrence-free survival were adjusted for gender, cirrhosis and BCLC stage. Scores in overall survival: 0: Low HLA-DQA1 + Low HLA-F expression; 1 score: Low HLA-DQA1 + High HLA-F expression, High HLA-DQA1 + Low HLA-F expression; 2 scores: High HLA-DQA1 + High HLA-F expression. Scores in disease-free survival: 0: Low HLA-A + Low HLA-C + Low HLA-DPA1 + Low HLA-DQA1 expression; 1 score: High HLA-A + Low HLA-C + Low HLA-DPA1 + Low HLA-DQA1 expression, Low HLA-A + High HLA-C + Low HLA-DPA1 + Low HLA-DQA1 expression, Low HLA-A + Low HLA-C + High HLA-DPA1 + Low HLA-DQA1 expression, Low HLA-A + Low HLA-C + Low HLA-DPA1 + High HLA-DQA1 expression; 2 scores: High HLA-A + High HLA-C + Low HLA-DPA1 + Low HLA-DQA1 expression, High HLA-A + Low HLA-C + High HLA-DPA1 + Low HLA-DQA1 expression, High HLA-A + Low HLA-C + Low HLA-DPA1 + High HLA-DQA1 expression, Low HLA-A + High HLA-C + High HLA-DPA1 + Low HLA-DQA1 expression, Low HLA-A + High HLA-C + Low HLA-DPA1 + High HLA-DQA1 expression, Low HLA-A + Low HLA-C + High HLA-DPA1 + High HLA-DQA1 expression; 3 scores: High HLA-A + High HLA-C + High HLA-DPA1 + Low HLA-DQA1 expression, High HLA-A + High HLA-C + Low HLA-DPA1 + High HLA-DQA1 expression, High HLA-A + Low HLA-C + High HLA-DPA1 + High HLA-DQA1 expression, Low HLA-A + High HLA-C + High HLA-DPA1 + High HLA-DQA1 expression; 4 scores: High HLA-A + High HLA-C + High HLA-DPA1 + High HLA-DQA1 expression.)
In the stratification of HLA-DQA1 for OS analysis, high expression showed significance in males, age ≤ 60 years, active viral replication-chronic carriers of HBV, cirrhosis, single nodular, low AFP levels (≤ 300 ng/ml) and A stage of the BCLC system compared with low expression (Table 4). In the stratification of HLA-A for RFS analysis, high expression showed significance in males, age > 60 years, chronic HBV carriers, tumour size > 5 cm, cirrhosis, low AFP levels (≤ 300 ng/ml) and C stage of the BCLC system compared with low expression. Detailed results of the stratified analysis were shown in Table 4 and 5.
Stratified analysis of prognostic-related genes for overall survival
| Variables | HLA-DQA1 | HLA-F | ||||||
|---|---|---|---|---|---|---|---|---|
| Low | High | Adjusted HR (95%CI) | Adjusted P valueɸ | Low | High | Adjusted HR (95%CI) | Adjusted P valueɸ | |
| Gender | ||||||||
| Male | 88 | 95 | 0.507 (0.315-0.814) | 0.005 | 91 | 92 | 0.612 (0.386-0.971) | 0.037 |
| Female | 18 | 11 | 11.866 (0.919-153.153) | 0.058 | 15 | 14 | 0.139 (0.014-1.409) | 0.095 |
| Age | ||||||||
| ≤60 years | 89 | 86 | 0.535 (0.326-0.878) | 0.013 | 90 | 85 | 0.579 (0.357-0.937) | 0.026 |
| >60 years | 17 | 20 | 0.939 (0.295-2.987) | 0.915 | 16 | 21 | 0.485 (0.129-1.832) | 0.286 |
| HBV status | ||||||||
| AVR-CC | 30 | 26 | 0.360 (0.130-0.993) | 0.049 | 26 | 30 | 0.615 (0.254-1.488) | 0.281 |
| CC | 76 | 80 | 0.687 (0.399-1.182) | 0.175 | 80 | 76 | 0.530 (0.306-0.917) | 0.023 |
| Tumor size | ||||||||
| ≤5 cm | 72 | 65 | 0.591 (0.311-1.123) | 0.108 | 62 | 75 | 0.652 (0.360-1.179) | 0.157 |
| >5 cm | 34 | 40 | 0.550 (0.279-1.086) | 0.085 | 43 | 31 | 0.509 (0.251-1.032) | 0.061 |
| Cirrhosis | ||||||||
| Yes | 91 | 104 | 0.567 (0.361-0.890) | 0.014 | 97 | 98 | 0.595 (0.381-0.929) | 0.022 |
| No | 15 | 2 | 0.287 (2.599E-19-3.176E17) | 0.953 | 9 | 8 | 0.002 (8.086E-22-4.683E15) | 0.773 |
| Multinodular | ||||||||
| Yes | 18 | 27 | 0.719 (0.290-1.780) | 0.476 | 21 | 24 | 0.307 (0.122-0.772) | 0.012 |
| No | 88 | 79 | 0.503 (0.293-0.864) | 0.013 | 85 | 82 | 0.631 (0.373-1.069) | 0.087 |
| AFP | ||||||||
| ≤300 ng/ml | 59 | 56 | 0.432 (0.217-0.861) | 0.017 | 54 | 61 | 0.857 (0.450-1.631) | 0.639 |
| >300 ng/ml | 44 | 50 | 0.716 (0.390-1.315) | 0.282 | 50 | 44 | 0.433 (0.227-0.824) | 0.011 |
| BCLC stage | ||||||||
| 0 | 13 | 7 | 3.055 (0.190-49.157) | 0.431 | 8 | 12 | 0.404 (0.024-6.735) | 0.528 |
| A | 75 | 68 | 0.437 (0.240-0.796) | 0.007 | 74 | 69 | 0.616 (0.343-1.108) | 0.106 |
| B | 8 | 14 | 0.462 (0.110-1.933) | 0.290 | 11 | 11 | 0.109 (0.021-0.566) | 0.008 |
| C | 10 | 17 | 1.381 (0.489-3.902) | 0.542 | 13 | 14 | 0.800 (0.310-2.061) | 0.644 |
Note: ɸ: P values were adjusted for tumor size, cirrhosis, AFP and BCLC stage.
Stratified analysis of prognostic-related genes for recurrence-free survival
| Variables | HLA-A | HLA-C | ||||||
| Low | High | Adjusted HR (95%CI) | Adjusted P value | Low | High | Adjusted HR (95%CI) | Adjusted P value | |
| Gender | ||||||||
| Male | 89 | 94 | 0.567 (0.383-0.839) | 0.005 | 96 | 87 | 0.660 (0.447-0.974) | 0.036 |
| Female | 17 | 12 | 1.491 (0.321-6.921) | 0.610 | 10 | 19 | 0.541 (0.116-2.515) | 0.433 |
| Age | ||||||||
| ≤60 years | 86 | 89 | 0.710 (0.470-1.074) | 0.105 | 91 | 84 | 0.675 (0.448-1.017) | 0.060 |
| >60 years | 20 | 17 | 0.377 (0.148-0.958) | 0.040 | 15 | 22 | 0.674 (0.270-1.680) | 0.397 |
| HBV status | ||||||||
| AVR-CC | 29 | 27 | 0.817 (0.408-1.634) | 0.567 | 23 | 33 | 0.469 (0.234-0.940) | 0.033 |
| CC | 77 | 79 | 0.610 (0.386-0.964) | 0.034 | 83 | 73 | 0.664 (0.422-1.044) | 0.664 |
| Tumor size | ||||||||
| ≤5 cm | 70 | 67 | 0.844 (0.529-1.348) | 0.478 | 67 | 70 | 0.554 (0.345-0.889) | 0.014 |
| >5 cm | 35 | 39 | 0.391 (0.208-0.735) | 0.004 | 38 | 36 | 0.791 (0.418-1.495) | 0.470 |
| Cirrhosis | ||||||||
| Yes | 97 | 98 | 0.643 (0.439-0.943) | 0.024 | 96 | 99 | 0.694 (0.475-1.014) | 0.059 |
| No | 9 | 8 | 1.356 (0.222-8.267) | 0.741 | 10 | 7 | 0.576 (0.061-5.460) | 0.631 |
| Multinodular | ||||||||
| Yes | 20 | 25 | 0.559 (0.232-1.347) | 0.195 | 24 | 21 | 0.567 (0.236-1.363) | 0.205 |
| No | 86 | 81 | 0.679 (0.445-1.036) | 0.072 | 82 | 85 | 0.582 (0.371-0.914) | 0.019 |
| AFP | ||||||||
| ≤300 ng/ml | 51 | 64 | 0.580 (0.346-0.973) | 0.039 | 57 | 58 | 0.673 (0.405-1.119) | 0.127 |
| >300 ng/ml | 54 | 40 | 0.709 (0.400-1.258) | 0.240 | 48 | 46 | 0.629 (0.361-1.097) | 0.103 |
| BCLC stage | ||||||||
| 0 | 9 | 11 | 2.624E5 (8.254E-158-8.340E167) | 0.948 | 9 | 11 | 0.402 (0.042-3.877) | 0.431 |
| A | 73 | 70 | 0.662 (0.416-1.051) | 0.080 | 72 | 71 | 0.663 (0.416-1.057) | 0.084 |
| B | 11 | 11 | 0.853 (0.259-2.811) | 0.794 | 11 | 11 | 0.599 (0.198-1.813) | 0.364 |
| C | 13 | 14 | 0.261 (0.096-0.709) | 0.008 | 14 | 13 | 0.848 (0.346-2.079) | 0.719 |
| Variables | HLA-DPA1 | HLA-DQA1 | ||||||
| Low | High | Adjusted HR (95%CI) | Adjusted P value | Low | High | Adjusted HR (95%CI) | Adjusted P value | |
| Gender | ||||||||
| Male | 91 | 92 | 0.724 (0.489-1.072) | 0.107 | 88 | 95 | 0.603 (0.407-0.893) | 0.012 |
| Female | 15 | 14 | 0.249 (0.050-1.238) | 0.089 | 18 | 11 | 1.978 (0.379-10.320) | 0.418 |
| Age | ||||||||
| ≤60 years | 86 | 89 | 0.723 (0.479-1.090) | 0.122 | 89 | 86 | 0.652 (0.430-0.989) | 0.044 |
| >60 years | 20 | 17 | 0.445 (0.166-1.193) | 0.108 | 17 | 20 | 0.702 (0.281-1.753) | 0.448 |
| HBV status | ||||||||
| AVR-CC | 28 | 28 | 0.377 (0.182-0.779) | 0.008 | 30 | 26 | 0.382 (0.174-0.840) | 0.017 |
| CC | 78 | 78 | 0.794 (0.503-1.255) | 0.323 | 76 | 80 | 0.739 (0.471-1.159) | 0.188 |
| Tumor size | ||||||||
| ≤5 cm | 75 | 62 | 0.658 (0.401-1.080) | 0.098 | 72 | 65 | 0.607 (0.371-0.996) | 0.048 |
| >5 cm | 31 | 43 | 0.788 (0.423-1.468) | 0.453 | 34 | 40 | 0.489 (0.358-1.325) | 0.264 |
| Cirrhosis | ||||||||
| Yes | 95 | 100 | 0.694 (0.472-1.020) | 0.063 | 91 | 104 | 0.666 (0.455-0.973) | 0.036 |
| No | 11 | 6 | 0.563 (0.062-5.083) | 0.609 | 15 | 2 | NA | NA |
| Multinodular | ||||||||
| Yes | 19 | 26 | 1.318 (0.578-3.005) | 0.511 | 18 | 27 | 1.057 (0.466-2.401) | 0.894 |
| No | 87 | 80 | 0.562 (0.362-0.873) | 0.010 | 88 | 79 | 0.518 (0.331-0.812) | 0.004 |
| AFP | ||||||||
| ≤300 ng/ml | 55 | 60 | 0.744 (0.444-1.248) | 0.263 | 59 | 56 | 0.585 (0.343-0.999) | 0.050 |
| >300 ng/ml | 48 | 46 | 0.540 (0.304-0.961) | 0.036 | 44 | 50 | 0.692 (0.401-1.192) | 0.184 |
| BCLC stage | ||||||||
| 0 | 13 | 7 | 0.453 (0.050-4.104) | 0.481 | 13 | 7 | 1.165 (0.207-6.559) | 0.862 |
| A | 73 | 70 | 0.649 (0.407-1.033) | 0.069 | 75 | 68 | 0.050 (0.309-0.809) | 0.005 |
| B | 12 | 10 | 2.093 (0.674-6.498) | 0.201 | 8 | 14 | 1.165 (0.356-3.812) | 0.801 |
| C | 8 | 19 | 0.717 (0.284-1.812) | 0.482 | 10 | 17 | 1.056 (0.420-2.655) | 0.908 |
Note: Ѱ: P values were adjusted for gender, cirrhosis and BCLC stage.
Expression model and nomogram construction
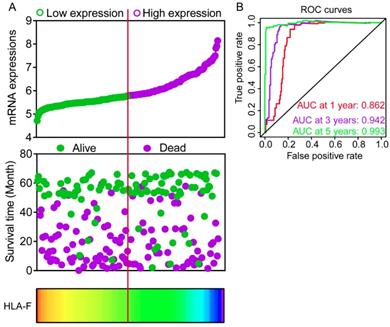
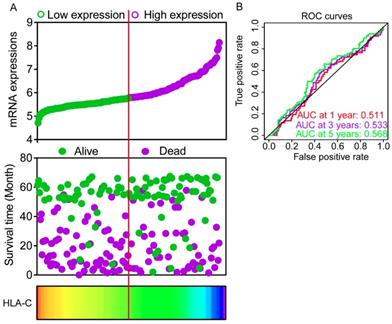
Expression models were constructed for OS and RFS prognosis in Figure 6 and 7, respectively. Expressions, survival statuses and heatmaps were shown in Figure 6A and 7A. Prognostic receiver operating characteristic (ROC) curves were shown in Figure 6B and 7B (P = 0.041 and 0.021, respectively). AUCs at 1 year, 3 years and 5 years were 0.862, 0.942 and 0.993, respectively, in the OS risk score model and 0.511, 0.533 and 0.568, respectively, in the RFS risk score model.
Expression model constructed using HLA-F gene. A: Expression model including expression, survival status and heatmap; B: Time dependent receiver operating characteristic curves at 1, 3- and 5- year respectively.
Expression model constructed using HLA-C gene. A: Expression model including expression, survival status and heatmap; B: Time dependent receiver operating characteristic curves at 1, 3- and 5- year respectively.
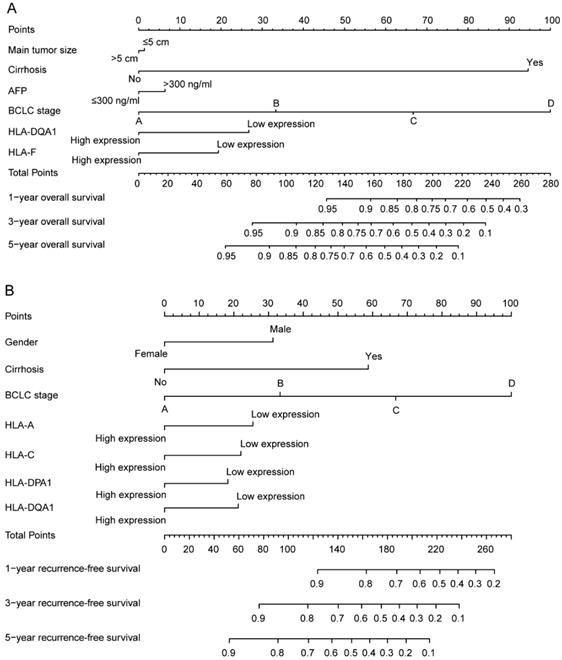
In addition, clinical factors and prognosis-related genes were further constructed in nomograms. High expression levels always led to low points. The same points indicated a highest probability of survival at 1 year and a lowest probability of survival at 5 years. Survival probability at 3 years was seated in the middle (Figure 8).
Nomograms constructed using overall survival and recurrence-free survival-related clinical factors and genes. A: Nomogram of overall survival-related genes and clinical factors; B: Nomogram of recurrence-free survival-related genes and clinical factors.
GSEA analysis
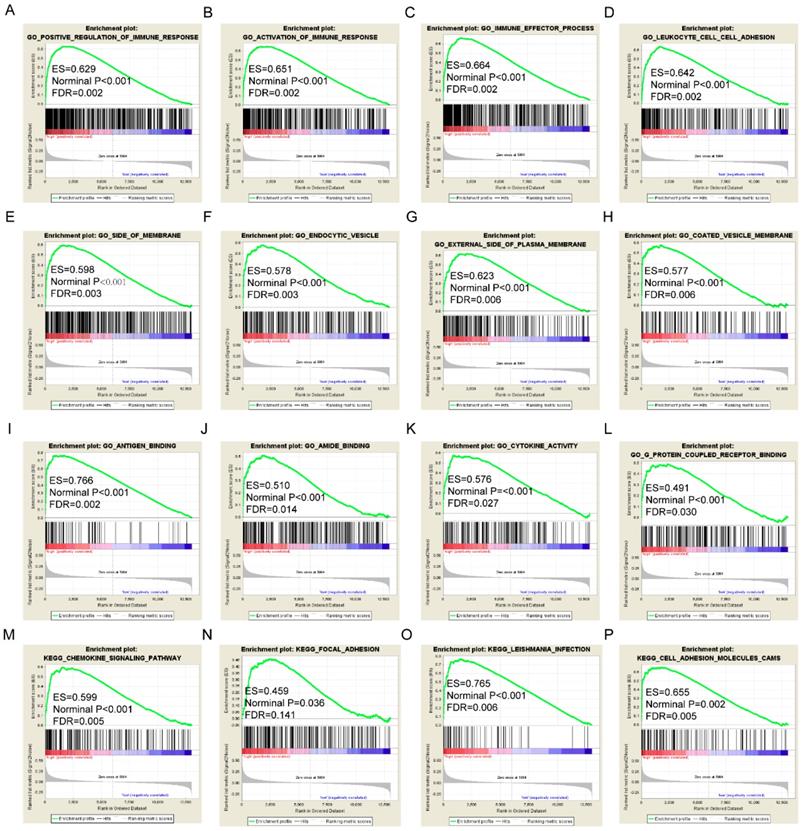
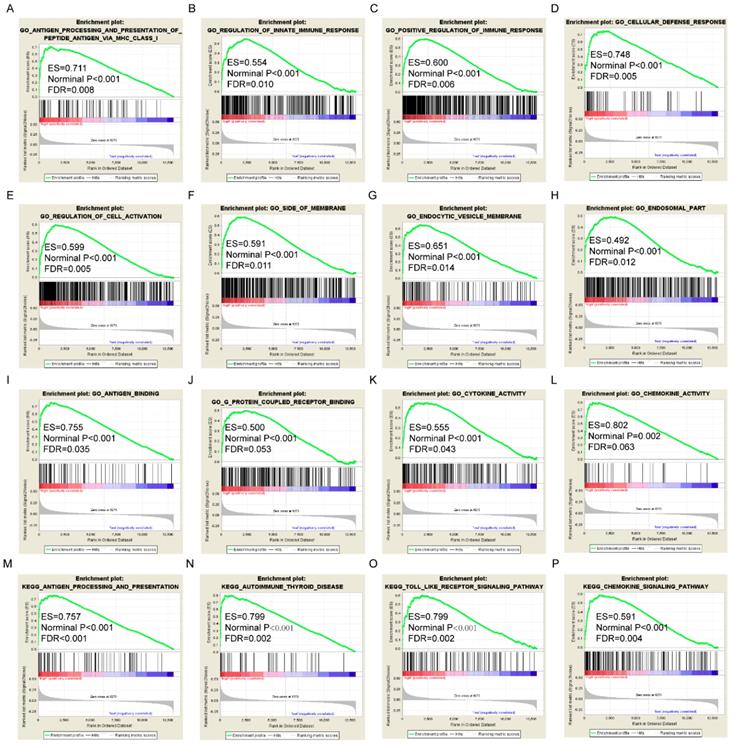
GSEA results of the OS-related gene HLA-F indicated that GO and pathways were involved in positive regulation of the immune response, leukocyte cell-cell adhesion, chemokine signalling pathway and focal adhesion (Figure 9A, D, M-N). GSEA results of the RFS-related gene HLA-A indicated that GO and pathways were involved in antigen processing and presentation of peptide antigens via MHC class I, cell defence response, autoimmune thyroid disease and toll like receptor signalling pathway (Figure 10A, D, N-O). Detailed GSEA results were shown in Figure 9 and 10 and Supplementary Figure 3-5.
Gene set enrichment analysis results of HLA-F gene. A-L: Results of biological processes; M-P: Results of KEGG pathways.
Gene set enrichment analysis results of HLA-A gene. A-L: Results of biological processes; M-P: Results of KEGG pathways.
Interaction and co-expression networks and enrichment analysis
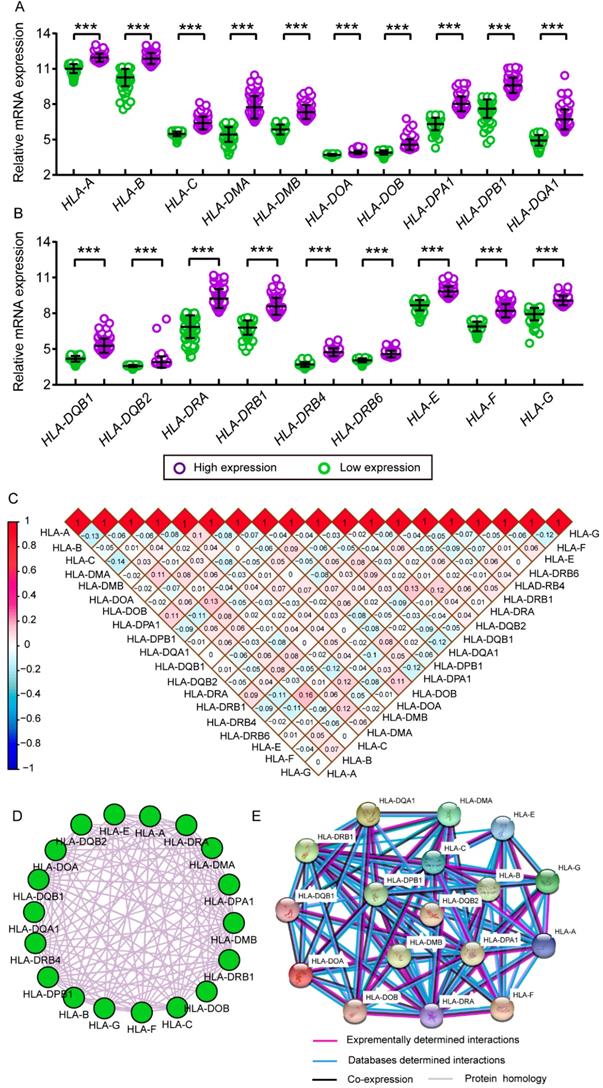
Comparison between low and high levels of expression were shown in Figure 11A and B. Significant P values were exhibited in all HLA family members (all P ≤ 0.05). Matrices showed Pearson correlations among HLA members (Figure 11C). Co-expression interaction and PPI networks showed relationships among HLA members (Figure 11D and E).
Scatter plots, matrix and interaction networks analysis. A-B: Scatter plots of HLA complex family expressions; C: Co-expression network of HLA complex gene family; D: Protein-protein interaction network of HLA complex; E: Matrix of Pearson correlation of HLA complex family.
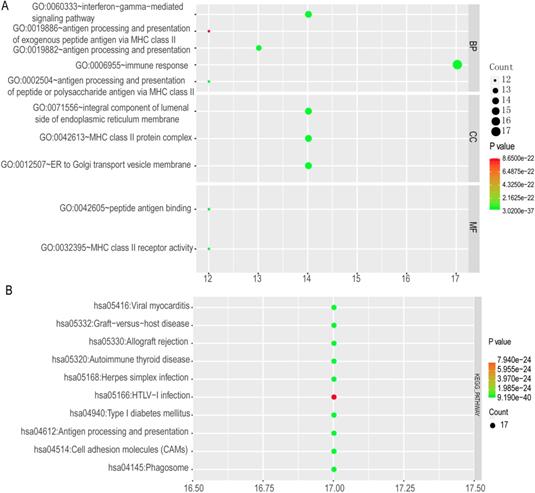
The top 10 GO terms and KEGG pathways were exhibited in Figure 12. Detailed GO terms and KEGG pathways were shown in Supplementary Table 1. Visualised interactions of GO terms constructed using BiNGO were shown in Supplementary Figure 6.
Enriched top 10 GO terms and metabolic pathways of HLA complex. A: enriched GO terms, including biological process, cellular component and molecular function; B: enriched KEGG pathways
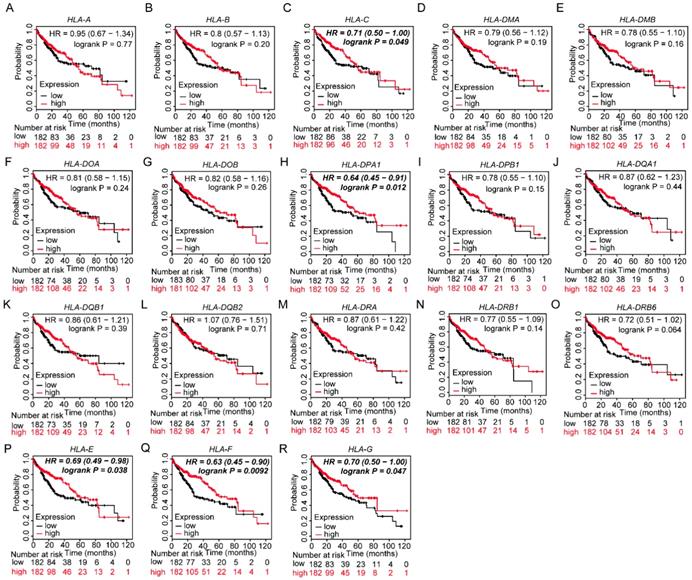
Validation of prognostic values of HLA family members
Prognostic values of HLA family members were further validated in the whole population. HLA-C, HLA-DPA1, HLA-E, HLA-F and HLA-G showed significance in OS (all P ≤ 0.05, Figure 13C, H, P-R). However, other genes did not show significance (all P > 0.05, Figure 13).
Kaplan-Meier plots of overall survival of HLA complex. A-R: HLA-A, B, C, DMA, DMB, DOA, DOB, DPA1, DPB1, DQA1, DQB1, DQB2, DRA, DRB6, E, F, G respectively.
Discussion
In the present study, we conducted an investigation on the relationships between the HLA complex and HBV-related HCC patients. We found that members of the HLA complex, HLA-A, HLA-C, HLA-DMB, HLA-DOA, HLA-DOB, HLA-DPA1, HLA-DPB1, HLA-DQA1, HLA-DQB1, HLA-DRA, HLA-DRB1, HLA-DRB4, HLA-DRB6 and HLA-E, showed significant diagnostic values for HCC. Among them, HLA-C showed the highest diagnostic value. In addition, HLA-DQA1 and HLA-F showed prognostic values for OS, and HLA-A, HLA-C, HLA-DPA1 and HLA-DQA1 showed prognostic values for RFS. Then, joint-effect and stratified analyses were explored the prognostic values of all the prognosis-related genes. GSEA found that they were involved in positive regulation of the immune response, antigen processing and presentation of peptide antigens via MHC class I, chemokine signalling pathway, focal adhesion and toll like receptor signalling pathway. Risk score models and nomograms were constructed to evaluate HCC prognosis. Further validation of prognosis-related genes in the Kaplan-Meier Plotter website indicated that HLA-C, HLA-DPA1, HLA-E, HLA-F and HLA-G were associated with HCC prognosis in OS. Therefore, we concluded that HLA-C, HLA-DPA1 and HLA-F gene expression were associated with HCC prognosis, and HLA-A and HLA-DQA1 gene expression were associated with prognosis of HBV-related HCC. HLA-C had diagnostic value for HCC, and HLA-A, HLA-C, HLA-DMB, HLA-DOA, HLA-DOB, HLA-DPA1, HLA-DPB1, HLA-DQA1, HLA-DQB1, HLA-DRA, HLA-DRB1, HLA-DRB4, HLA-DRB6 and HLA-E had potentially diagnostic values for HCC.
The MHC complex, also known as the HLA in humans, consists of more than 200 genes on chromosome 6 and can be categorised into three groups: class I, class II and class III [30]. Class I, which is characterised by CD8+ T cells, is composed of three genes: HLA-A, HLA-B and HLA-C [30]. Class II, which is characterised by CD4+ T cells, is composed of six main genes: HLA-DPA1, HLA-DPB1, HLA-DQA1, HLA-DQB1, HLA-DRA and HLA-DRB1 [30]. HLA genes were documented as numerous and highly polymorphic in order to bind many kinds of peptides originating from self or foreign antigens [30]. More than 1500 alleles of the HLA-B gene had been identified [31]. Variants of the HLA complex played a pivotal role in determining the susceptibility to autoimmune diseases and infections [32]. Meanwhile, they were crucial in the field of transplantation surgery, where HLA-matching compatibility was a precondition in the donors and recipients [32]. An association between the presence of HLA-B*57:01 alleles and abacavir hypersensitivity was observed in Australian and British cohorts [33, 34]. Genome-wide association studies showed that the HAL-A *31:01 allele had a strong association with carbamazepine-induced hypersensitivity in Northern Europeans, Japanese and Koreans (OR = 25.93, 10.8 and 7.3, respectively) [35-38].
Alterations of amino acids bringing in structural and functional dissimilarities between HLA-DPB1 alleles revealed a strong median impact of alloreactive responses to these molecules [39]. It had been observed that a high frequency of the HLA-DRB1*15:01-DRB5*01:01-DQB1*06:02 haplotype in patients with amoxicillin clavulanate-induced drug-induced liver injury compared with normal healthy controls (57.1% (case) versus 11.7% (controls), P < 10-6). A study focusing on HLA-DQB1 and HLD-DRB1 in the Tunisian population revealed the involvement of rs6457617 locus as a risk variant for susceptibility/severity to rheumatoid arthritis and highlighted gene-gene interaction between the two genes [40].
Recently, many researches had been performed to investigate the relationships among initiation and progression of tumours and the HLA family. Single nucleotide polymorphisms of HLA-A and amino acid variants were associated with nasopharyngeal carcinoma in Malaysian Chinese [41]. HLA-B-associated transcript 3 polymorphisms were suggested as risk factors for lung cancer in a meta-analysis [42]. An association was observed between an increase in HLA-C1/KIR2DL2 and HLA-C1/KIRDL3 pairs and invasive cervical cancer patients at high-risk from human papillomavirus infection [43]. Hu et al. reported, for the first time, that genetic variants in the HLA-DP/DQ loci might be marker polymorphisms for both HBV infection and risk of developing HCC [44]. HLA-DPB1 polymorphisms increased the risk for cervical squamous cell carcinoma in Taiwanese women [45].
HLA-DQA1 gene copy number polymorphism was associated with gastric cancer susceptibility in the Chinese population [46]. Rs17879599 in the second exon of the HLA-DRB1 gene had been suggested as an independent leading contributor to HCC risk in Han Chinese [47]. Expression of HLA-E and HLA-G were found differently upregulated in HCC tissues [48]. However, our present study found that HLA-E and HLA-G were found differently upregulated in non-HCC tissues, and a statistically significant difference was shown only in HLA-E.
To date, the HLA family had been widely explored with regard to their prognostic values in multiple tumours. However, associations between the HLA family and HCC had not been fully explored until now. We, for the first time, explored diagnostic and prognostic values among the HLA complex and HCC. HBV infection had widely been recognized as a risk factor for HCC. Two HLA-DRB1-DQB1 haplotypes, such as DRB1*15:02-DQB1*06:01 and DRB1*13:02-DQB1*06:04, and three DPB1 alleles, such as DPB1*02:01, *04:02, and *05:01, were found associations with chronic HBV infection in Japanese population [49].
Dianwu Liu et al. suggested that thirty four variants of eight HLA genes, including HLA-B, HLA-C, HLA-DPA1, HLA-DQA1, HLA-DQB1, HLA-DQB2, HLA-DRB1, and HLA-DRB5, were strongly associated with HBV-related HCC [50]. Weiping Zhou et al. suggested that new associations at rs9272105 (HLA-DQA1/DRB1) on 6p21.32 (odds ratio=1.30, P=1.13E-19) [51]. This finding is consistent with our present study of association between HLA-DQA1 and HCC.
Hyon-Suk Kim et al. found that serum level of soluble HLA-G (sHLA-G) was correlated with the progression of HBV infection [52]. In addition, AUC of sHLA-G for distinguishing HCC from liver cirrhosis was higher than that of AFP and would be a diagnostic biomarker for HCC [52]. Moreover, they indicated that sHLA-G should not to be considered as severity of HBV infections and HCC but rather reflects phases of diseases including HBV-related HCC and concluded that increased sHLA-G expression could be one of the immune escape mechanisms of both HBV infection and HCC [52]. Nonetheless, our present study did not find clinical significance of HLA-G for HCC. This contradiction might be attributed to the difference of study population and ethnicity.
There were some limitations in the present study that need to be recognised. First, larger population cohorts were warranted to further validate our findings. Second, multivariate analyses were needed to generalise our results, a HBV-related HCC cohort. Third, functional trials were needed in future studies to explore the properties of prognosis-related genes in tumour proliferation, metastasis and angiogenesis.
Conclusions
In the present study, we conducted investigations for associations between the HLA complex and HCC. We found that some genes had diagnostic values for HCC. Among them, HLA-C was the most diagnostic biomarker for HCC. In addition, HLA-DQA1 and HLA-F had prognostic values for OS, whereas HLA-A, HLA-C, HLA-DPA1 and HLA-DQA1 had prognostic values for RFS. GSEA found they were involved in positive regulation of the immune response, antigen processing, chemokine signalling pathway and toll like receptor signalling pathway. Risk score models and nomograms were used to evaluate values of prognosis-related genes for HCC. Further validation in the Kaplan-Meier Plotter website indicated that HLA-C, HLA-DPA1, HLA-E, HLA-F and HLA-G were associated with HCC prognosis in OS. Therefore, we concluded that HLA-C, HLA-DPA1 and HLA-F expression were associated with HCC prognosis, and HLA-A and HLA-DQA1 gene expression were associated with prognosis of HBV-related HCC. HLA-C might be a diagnostic biomarker for HCC.
Supplementary Material
Supplementary figures and table.
Acknowledgements
The authors would like to acknowledge those researchers for their contribution on open access of GTEx portal, GEPIA, Kaplan-Meier Plotter, STRING and The Human Protein Atlas website. In addition, the authors would like to acknowledge invaluable help from peer reviewers.
Data availability
The datasets analyzed during the current study were available from the corresponding author on reasonable request.
Funding
This work was supported in part by the National Natural Science Foundation of China (No.: 81560535, 81802874, 81072321, 30760243, 30460143 and 30560133), Natural Science Foundation of Guangxi Province of China (Grant No.2017JJB140189y, 2018GXNSFAA050119), 2009 Program for New Century Excellent Talents in University (NCET), Guangxi Natural Sciences Foundation (No.: GuiKeGong 1104003A-7), and Guangxi Health Ministry Medicine Grant (Key-Scientific Research-Grant Z201018). The present study is also partly supported by Scientific Research Fund of the Health and Family Planning Commission of Guangxi Zhuang Autonomous Region (Z2016318), Key laboratory of High-Incidence-Tumor Prevention & Treatment (Guangxi Medical University), Ministry of Education (GKE2018-01, GKE2019-11), The Basic Ability Improvement Project for Middle-aged and Young Teachers in Colleges and Universities in Guangxi (2018KY0110), and 2018 Innovation Project of Guangxi Graduate Education (YCBZ2018036). As well as, the present study is also partly supported by Research Institute of Innovative Think-tank in Guangxi Medical University (The gene-environment interaction in hepatocarcinogenesis in Guangxi HCCs and its translational applications in the HCC prevention). We would also acknowledge the supported by the Key laboratory of High-Incidence-Tumor Prevention & Treatment (Guangxi Medical University), Ministry of Education.
Competing Interests
The authors have declared that no competing interest exists.
References
1. Torre LA, Bray F, Siegel RL, Ferlay J, Lortettieulent J, Jemal A. Global cancer statistics, 2012. Ca Cancer J Clin. 2015;65:87-108
2. London WT, McGlynn KA. Liver cancer. In: (ed.) Schottenfeld D, Fraumeni J Jr. Cancer Epidemiology and Prevention. 3rd ed. New York: Oxford University Press. 2006:763-786
3. Poon D, Anderson BO, Chen LT, Tanaka K, Wan YL, Cutsem EV. et al. Management of hepatocellular carcinoma in Asia: consensus statement from the Asian Oncology Summit 2009. Lancet Oncology. 2009;10:1119-27
4. Mcglynn KA, London WT. The Global Epidemiology of Hepatocellular Carcinoma, Present and Future. Clinics in Liver Disease. 2011;15:223-43
5. Balogh J, David Victor I, Asham EH, Burroughs SG, Boktour M, Saharia A. et al. Hepatocellular carcinoma: a review. Journal of Hepatocellular Carcinoma. 2016;3:41-53
6. Tien AJ, Chien CY, Chen YH, Lin LC, Chien CT. Fruiting Bodies of Antrodia cinnamomea and Its Active Triterpenoid, Antcin K, Ameliorates N-Nitrosodiethylamine-Induced Hepatic Inflammation, Fibrosis and Carcinogenesis in Rats. American Journal of Chinese Medicine. 2017;45:173-98
7. Peery AF, Dellon ES, Lund J, Crockett SD, Mcgowan CE, Bulsiewicz WJ. et al. Exam 1: Burden of Gastrointestinal Disease in the United States: 2012 Update. Gastroenterology. 2012;143:e16-e7
8. Mohamed Shariff, Mary Crossey, Maria Gomez-Romero. et al. Hepatocellular carcinoma: Review of disease and tumor biomarkers. World Journal of Hepatology. 2016;8:471-84
9. Robinson J, Marsh SGE. The IMGT/HLA Database: Springer New York; 2009.
10. Wong LP, Ong RT, Poh WT, Liu X, Chen P, Li R. et al. Deep whole-genome sequencing of 100 southeast Asian Malays. American Journal of Human Genetics. 2013;92:52-66
11. Chen H, Ndhlovu ZM, Liu D, Porter LC, Fang JW, Darko S. et al. TCR clonotypes modulate the protective effect of HLA class I molecules in HIV-1 infection. Nature Immunology. 2012;13:691-700
12. Kunzeschumacher H, Blasczyk R, Badedoeding C. Soluble HLA Technology as a Strategy to Evaluate the Impact of HLA Mismatches. Journal of Immunology Research,2014,(2014-9-1). 2014;2014:246171
13. Lee SJ, Klein J, Haagenson M, Baxter-Lowe LA, Confer DL, Eapen M. et al. High-resolution donor-recipient HLA matching contributes to the success of unrelated donor marrow transplantation. Blood. 2007;110:4576-83
14. Li W, Shen X, Fu B, Guo C, Liu Y, Ye Y. et al. KIR3DS1/HLA-B Bw4-80Ile Genotype Is Correlated with the IFN-alpha Therapy Response in hepatitis B e antigen-Positive Chronic Hepatitis B. Front Immunol. 2017;8:1285
15. Urosevic M, Dummer R. HLA-G and IL-10 expression in human cancer-different stories with the same message. Seminars in Cancer Biology. 2003;13:337-42
16. Carosella ED, Moreau P, Lemaoult J, Rouas-Freiss N. HLA-G: from biology to clinical benefits. Trends in Immunology. 2008;29:125-32
17. Chang CC, Campoli M, Ferrone S. HLA class I antigen expression in malignant cells: why does it not always correlate with CTL-mediated lysis? Current Opinion in Immunology. 2004;16:644-50
18. Hirasawa M, Hagihara K, Abe K, Ando O, Hirayama N. Interaction of Nevirapine with the Peptide Binding Groove of HLA-DRB1*01:01 and Its Effect on the Conformation of HLA-Peptide Complex. International Journal of Molecular Sciences. 2018:19
19. Roessler S, Jia HL, Budhu A, Forgues M, Ye QH, Lee JS. et al. A unique metastasis gene signature enables prediction of tumor relapse in early-stage hepatocellular carcinoma patients. Cancer Res. 2010;70:10202-12
20. Roessler S, Long EL, Budhu A, Chen Y, Zhao X, Ji J. et al. Integrative genomic identification of genes on 8p associated with hepatocellular carcinoma progression and patient survival. Gastroenterology. 2012;142:957-66.e12
21. Tang Z, Li C, Kang B, Gao G, Li C, Zhang Z. GEPIA: a web server for cancer and normal gene expression profiling and interactive analyses. Nucleic acids research. 2017;45:W98-w102
22. Uhlén M, Fagerberg L, Hallström BM, Lindskog C, Oksvold P, Mardinoglu A. et al. Tissue-based map of the human proteome. Science. 2015;347:1260419
23. Subramanian A, Tamayo P, Mootha VK, Mukherjee S, Ebert BL, Gillette MA. et al. Gene set enrichment analysis: a knowledge-based approach for interpreting genome-wide expression profiles. Proc Natl Acad Sci U S A. 2005;102:15545-50
24. Mootha VK, Lindgren CM, Eriksson KF, Subramanian A, Sihag S, Lehar J. et al. PGC-1alpha-responsive genes involved in oxidative phosphorylation are coordinately downregulated in human diabetes. Nature genetics. 2003;34:267-73
25. Shannon P, Markiel A, Ozier O, Baliga NS, Wang JT, Ramage D. et al. Cytoscape: a software environment for integrated models of biomolecular interaction networks. Genome research. 2003;13:2498-504
26. Montojo J, Zuberi K, Rodriguez H, Kazi F, Wright G, Donaldson SL. et al. GeneMANIA Cytoscape plugin: fast gene function predictions on the desktop. Bioinformatics (Oxford, England). 2010;26:2927-8
27. Szklarczyk D, Morris JH, Cook H, Kuhn M, Wyder S, Simonovic M. et al. The STRING database in 2017: quality-controlled protein-protein association networks, made broadly accessible. Nucleic Acids Res. 2017;45:D362-d8
28. Maere S, Heymans K, Kuiper M. BiNGO: a Cytoscape plugin to assess overrepresentation of gene ontology categories in biological networks. Bioinformatics (Oxford, England). 2005;21:3448-9
29. Szasz AM, Lanczky A, Nagy A, Forster S, Hark K, Green JE. et al. Cross-validation of survival associated biomarkers in gastric cancer using transcriptomic data of 1,065 patients. Oncotarget. 2016;7:49322-33
30. Fan WL, Shiao MS, Hui RC, Su SC, Wang CW, Chang YC. et al. HLA Association with Drug-Induced Adverse Reactions. J Immunol Res. 2017;2017:3186328
31. Shiina T, Hosomichi K, Inoko H, Kulski JK. The HLA genomic loci map: expression, interaction, diversity and disease. Journal of Human Genetics. 2009;54:15-39
32. Bray RA, Hurley CK, Kamani NR, Woolfrey A, Müller C, Spellman S. et al. National marrow donor program HLA matching guidelines for unrelated adult donor hematopoietic cell transplants. Biol Blood Marrow Transplant. 2008;14:45-53
33. Hetherington S, Hughes AR, Mosteller M, Shortino D, Baker KL, Spreen W. et al. Genetic variations in HLA-B region and hypersensitivity reactions to abacavir. Lancet. 2002;359:1121-2
34. Mallal S, Nolan D, Witt C, Masel G, Martin AM, Moore C. et al. Association between presence of HLA-B*5701, HLA-DR7, and HLA-DQ3 and hypersensitivity to HIV-1 reverse-transcriptase inhibitor abacavir. Lancet. 2002;359:727-32
35. Kim SH, Lee KW, Song WJ, Kim SH, Jee YK, Lee SM. et al. Carbamazepine-induced severe cutaneous adverse reactions and HLA genotypes in Koreans. Epilepsy Research. 2011;97:190-7
36. Ozeki T, Mushiroda T, Yowang A, Takahashi A, Kubo M, Shirakata Y. et al. Genome-wide association study identifies HLA-A*3101 allele as a genetic risk factor for carbamazepine-induced cutaneous adverse drug reactions in Japanese population. Human Molecular Genetics. 2011;20:1034-41
37. McCormack M, Alfirevic A, Bourgeois S, Farrell JJ, Kasperaviciute D, Carrington M. et al. HLA-A*3101 and carbamazepine-induced hypersensitivity reactions in Europeans. N Engl J Med. 2011;364:1134-43
38. Genin E, Chen DP, Hung SI, Sekula P, Schumacher M, Chang PY. et al. HLA-A*31:01 and different types of carbamazepine-induced severe cutaneous adverse reactions: an international study and meta-analysis. Pharmacogenomics J. 2014;14:281-8
39. Crivello P, Zito L, Sizzano F, Zino E, Maiers M, Mulder A. et al. The impact of amino acid variability on alloreactivity defines a functional distance predictive of permissive HLA-DPB1 mismatches in hematopoietic stem cell transplantation. Biol Blood Marrow Transplant. 2015;21:233-41
40. Achour Y, Ben Hamad M, Chaabane S, Rebai A, Marzouk S, Mahfoudh N. et al. Analysis of two susceptibility SNPs in HLA region and evidence of interaction between rs6457617 in HLA-DQB1 and HLA-DRB1*04 locus on Tunisian rheumatoid arthritis. J Genet. 2017;96:911-8
41. Chin YM, Mushiroda T, Takahashi A, Kubo M, Krishnan G, Yap LF. et al. HLA-A SNPs and amino acid variants are associated with nasopharyngeal carcinoma in Malaysian Chinese. International Journal of Cancer. 2015;136:678-87
42. Zhao J, Wang H, Hu W, Jin Y. Effect of HLA-B-associated transcript 3 polymorphisms on lung cancer risk: a meta-analysis. Med Sci Monit. 2014;20:2461-5
43. Rizzo R, Gentili V, Rotola A, Bortolotti D, Cassai E, Di Luca D. Implication of HLA-C and KIR alleles in human papillomavirus infection and associated cervical lesions. Viral Immunol. 2014;27:468-70
44. Hu L, Zhai X, Liu J, Chu M, Pan S, Jiang J. et al. Genetic variants in human leukocyte antigen/DP-DQ influence both hepatitis B virus clearance and hepatocellular carcinoma development. Hepatology. 2012;55:1426-31
45. Yang YC, Chang TY, Chen TC, Lin WS, Chang SC, Lee YJ. Genetic susceptibility to cervical squamous cell carcinoma is associated with HLA-DPB1 polymorphisms in Taiwanese women. Cancer Immunol Immunother. 2015;64:1151-7
46. Huang LM, Cheng Y, Yu DK, Zhai K, Tan W, Lin DX. [Association between HLA-DQA1 gene copy number polymorphisms and susceptibility to gastric cancer]. Zhonghua Zhong Liu Za Zhi. 2012;34:269-71
47. Shi Y, Zhai W, Wang B, Zhao D, Jin H, Wang Y. et al. Genetic susceptibility of eight nonsynonymous polymorphisms in HLA-DRB1 gene to hepatocellular carcinoma in Han Chinese. Oncotarget. 2016;7:80935-42
48. Chen A, Shen Y, Xia M, Xu L, Pan N, Yin Y. et al. Expression of the nonclassical HLA class Iand MICA/B molecules in human hepatocellular carcinoma. Neoplasma. 2011;58:371-6
49. Nishida N, Ohashi J, Khor SS, Sugiyama M, Tsuchiura T, Sawai H. et al. Understanding of HLA-conferred susceptibility to chronic hepatitis B infection requires HLA genotyping-based association analysis. Sci Rep. 2016;6:24767
50. Yu F, Zhang X, Tian S, Geng L, Xu W, Ma N. et al. Comprehensive investigation of cytokine- and immune-related gene variants in HBV-associated hepatocellular carcinoma patients. Biosci Rep. 2017:37
51. Li S, Qian J, Yang Y, Zhao W, Dai J, Bei JX. et al. GWAS identifies novel susceptibility loci on 6p21.32 and 21q21.3 for hepatocellular carcinoma in chronic hepatitis B virus carriers. PLoS Genet. 2012;8:e1002791
52. Park Y, Park Y, Lim HS, Kim YS, Hong DJ, Kim HS. Soluble human leukocyte antigen-G expression in hepatitis B virus infection and hepatocellular carcinoma. Tissue antigens. 2012;79:97-103
Author contact
![]() Corresponding author: Tao Peng, M.D., Professor, Director, Department of Hepatobiliary Surgery, the First Affiliated Hospital of Guangxi Medical University, Nanning, 530021, Guangxi Province, China. Tel: (+86)-771-5356528. Fax: (+86)-771-5350031. E-mail: pengtaogmucom.
Corresponding author: Tao Peng, M.D., Professor, Director, Department of Hepatobiliary Surgery, the First Affiliated Hospital of Guangxi Medical University, Nanning, 530021, Guangxi Province, China. Tel: (+86)-771-5356528. Fax: (+86)-771-5350031. E-mail: pengtaogmucom.