Impact Factor ISSN: 1837-9664

 Global reach, higher impact
J Cancer 2019; 10(20):4961-4977. doi:10.7150/jca.31675 This issue Cite
Research Paper
Comprehensive investigation of the clinical significance and molecular mechanisms of plasmacytoma variant translocation 1 in sarcoma using genome-wide RNA sequencing data
Jianwei Liu1* ![]() , Rong Li2*, Xiwen Liao3, Bangli Hu4, Jia Yu1
, Rong Li2*, Xiwen Liao3, Bangli Hu4, Jia Yu1
1. Department of Spine Surgery, The Third Affiliated Hospital of Guangxi Medical University, Nanning, 530031, Guangxi Zhuang Autonomous Region, People's Republic of China.
2. Department of Reproductive Center, The Third Affiliated Hospital of Guangxi Medical University, Nanning, 530031, Guangxi Zhuang Autonomous Region, People's Republic of China.
3. Department of Hepatobiliary Surgery, The First Affiliated Hospital of Guangxi Medical University, Nanning, 530021, Guangxi Zhuang Autonomous Region, People's Republic of China.
4. Department of Research, Affiliated Tumor Hospital of Guangxi Medical University, Nanning, 530021, Guangxi Zhuang Autonomous Region, People's Republic of China.
* These authors contributed equally to this work
Received 2018-11-20; Accepted 2019-6-30; Published 2019-8-27
Abstract
Objective: The present study aims to identify the potential clinical application and molecular mechanism of plasmacytoma variant translocation 1 (PVT1) in patients with sarcomas by mining an RNA sequencing dataset from The Cancer Genome Atlas (TCGA) through multiple genome-wide analysis approaches.
Methods: A genome-wide RNA sequencing dataset was downloaded from TCGA, survival analysis was used to evaluate the prognostic value of PVT1 in sarcoma. The potential mechanism was investigated by multiple tools: Database for Annotation, Visualization, and Integrated Discovery v6.8, gene set enrichment analysis (GSEA), and Connectivity Map (CMap).
Results: Comprehensive survival analysis indicated that overexpression of PVT1 was significantly associated with poor prognosis in patients with sarcoma, and nomogram demonstrated that PVT1 contributed more than other traditional clinical parameters in sarcoma survival prediction. Weighted gene co-expression network analysis identified ten hub differentially expressed genes (DEGs) between sarcoma tissues with low and overexpression of PVT1, and substantiated that these DEGs have a complex co-expression network relationship. CMap analysis has identified that antipyrine, ondansetron, and econazole may be candidate targeted drugs for sarcoma patients with PVT1 overexpression. GSEA revealed that overexpression of PVT1 may be involved in the posttranscriptional regulation of gene expression, tumor invasiveness and metastasis, osteoblast differentiation and development, apoptosis, nuclear factor kappa B, Wnt, and apoptotic related signaling pathways.
Conclusions: Our findings indicate that PVT1 may serve as a prognostic indicator in patients with sarcoma. Its underlying mechanism is revealed by GSEA, and CMap offers three candidate drugs for the individualized targeted therapy of sarcoma patients with overexpression of PVT1.
Keywords: sarcoma, plasmacytoma variant translocation 1, RNA sequencing, The Cancer Genome Atlas, molecular mechanism.
Introduction
Malignant tumors derived from mesenchymal tissue (including connective tissue and muscle) are called "sarcomas" and occur mostly in the skin, under the skin, periosteum and both ends of the long bones. Sarcoma is a rare heterogeneous tumor, mainly originating from the embryonic mesoderm. Sarcoma has significant histological diversity, and the common histology types are osteosarcoma, leiomyoma, lymphosarcoma, and synovial sarcoma [1]. At present, the main treatment for most sarcomas is surgical resection, patients whose tumors cannot be removed or have residual tumors following surgery are treated with radiotherapy [2]. However, the blood transfer of sarcoma can occur in early stages of the disease, therefore, more than half sarcoma patients present with a high-risk of metastasis and death [1]. The traditional prognostic indicators are histologic grade, the tumor size and depth, and the presence of distant or nodal metastases. However, these indicators cannot provide accurate target therapy for sarcoma. As with most tumors, the sarcoma is caused by the interactions of the gene and environment. Genetic analysis of sarcomas can provide targets for therapy and identify genetic markers. Therefore, the exploration of diagnostic and prognostic genetic indicators of sarcoma is crucial for guiding clinical treatment.
The Cancer Genome Atlas (TCGA) uses large-scale sequencing-based genomic analysis to understand the molecular mechanisms of cancer, raise awareness of the molecular basis of cancer, and improve our ability to diagnose, treat, and prevent cancer. TCGA contains 33 types of cancer multi-omics sequencing data, including sarcomas [3, 4]. Plasmacytoma variant translocation 1 (PVT1) has been reported as an oncogene which is up-regulated in tumor tissues in various cancers and the overexpression of PVT1 is correlated to a poor clinical outcome [5, 6]. However, a comprehensive investigation of the clinical values of PVT1 in sarcoma has not been reported. The present study aims to identify the potential clinical application and molecular mechanism of PVT1 in patients with sarcomas by mining an RNA sequencing (RNA-seq) dataset from TCGA and by using multiple genome-wide analysis approaches.
Materials and Methods
Data source and pre-processing
An RNA-seq dataset of sarcoma tumor tissues was downloaded from TCGA (https://tcga-data.nci.nih.gov/; accessed November 1, 2018) [7], and the corresponding clinical and prognostic parameters were obtained from the University of California Santa Cruz Xena (UCSC Xena; http://xena.ucsc.edu/; accessed November 1, 2018). The raw count data of the RNA-seq was normalized by the DESeq package in R platform [8]. The sarcoma patients with complete outcome data and RNA-seq data were included in the subsequent analysis. All data used in the current study were collected from the public database, therefore, additional approval by an ethics committee was not necessary. All data acquired and used in this study are in accordance with the publication guidelines of TCGA (https://cancergenome.nih.gov/publications/publicationguidelines).
Survival analysis of PVT1
Survival analyses were conducted on patients with normalized mRNA expression and overall survival (OS) profiles. Patients were divided into low expression and overexpression groups according to the PVT1 upper quarter expression value. Multivariate Cox proportional hazards regression analysis was applied to estimate the prognostic value of PVT1 in sarcoma. A time-dependent receiver operating characteristic (ROC) curve was constructed using the survivalROC package in the R platform [9]. Stratified analysis was used to evaluate the prognostic value of PVT1 in different subgroups of sarcoma patients. The nomogram consisting of PVT1 expression level and clinical parameters was used to individualize the prognosis evaluation of sarcoma patients.
Identification of differentially expressed genes (DEGs) and functional assessment
To discover the mechanisms of prognosis for different PVT1 expression levels, DEG screening was performed using the edgeR package in the R platform [10]. A gene with a |log2fold change (FC)|>2 and false discovery rate (FDR)<0.05 was considered as DEG between the low and overexpression PVT1 groups. Functional assessment of these DEGs was identified by using the Database for Annotation, Visualization and Integrated Discovery version 6.8 (DAVID v6.8, https://david.ncifcrf.gov/home.jsp; accessed November 1, 2018) [11, 12].
Weighted gene co-expression network analysis (WGCNA) and hub DEGs screening
In order to screen for hub DEGs, we used a WGCNA method to construct a co-expression network [13], and the number of degrees in the networks was used to identify hub DEGs. A detailed introduction to WGCNA can be found in our previous publication [14]. The soft threshold power selection was in accordance with the standard scale-free distribution, and the threshold of weighted co-expression correlation coefficient between two genes greater than 0.6 was included in the hub DEG screening and weighted co-expression network construction. The co-expression relationship was also verified by GeneMANIA (http://www.genemania.org/; accessed November 1, 2018)[15, 16] and Search Tool for the Retrieval of Interacting Genes/Proteins (STRING, https://string-db.org/; accessed November 1, 2018)[17, 18].
Connectivity Map (CMap) analysis
CMap (https://portals.broadinstitute.org/cmap/; accessed November 1, 2018) is a biological application database of small-molecule drugs, gene expression profiles, and diseases, which is based on the differential gene expression of human cells treated with small-molecule drugs [19, 20]. At present, more than 1,309 drug molecules and 7,000 gene expression profiles have been collected and shared on the CMap website. Each small-molecule drug was treated at different concentrations, different cell lines, and different time points [19, 20]. Gene expression profile datasets were divided into positive and negative regulatory gene clusters to calculate the similarity of the gene atlas and then output the connective score. A positive connective score indicates the small-molecule drugs have an inductive effect on the query gene set, whereas a negative connective score indicates that the small-molecule drugs have an inhibiting effect on the query gene set. In this study, small-molecule drugs with a mean connective score of < -0.2 were regarded as possible therapy drugs for sarcoma patients with PVT1 overexpression. The chemical structures of these compounds were downloaded from PubChem (https://pubchem.ncbi.nlm.nih.gov/; accessed November 1, 2018)[21, 22] and protein-chemical interaction networks were investigated by Search Tool for Interacting Chemicals (STITCH: http://stitch.embl.de/; accessed November 1, 2018) [23-25].
Genome-wide PVT1 co-expression networks construction
It is well known that lncRNAs do not encode proteins and play a role mainly through regulating specific co-expressed protein-coding genes (PCGs). Therefore, we performed a genome-wide co-expression analysis of PVT1 using the cor function in the R platform to assess the function of PVT1 in sarcoma using the Pearson correlation coefficient. When the |Pearson correlation coefficient| between PVT1 and other genes was greater than 0.4 and P-value <0.05 were identified as PVT1 co-expression PCGs. DAVID v6.8 was then used in the functional enrichment of these PVT1 co-expression genes.
Gene set enrichment analysis (GSEA)
The underlining mechanisms of PVT1 in sarcoma was also investigated by GSEA (http://software.broadinstitute.org/gsea/index.jsp; accessed November 1, 2018), which is a computational method that determines whether an a priori defined set of genes shows statistically significant concordant differences between two biological states (e.g. phenotypes)[26, 27]. The a priori defined gene sets included in the present study were downloaded from the Molecular Signatures Database (MSigDB), we only investigated the c2 (c2.all.v6.2.symbols.gmt) and c5 (c5.all.v6.2.symbols.gmt) gene sets in the current study [28]. The significant results of GSEA were identified using the criteria: nominal P-value <0.05 and FDR <0.25.
Statistical analysis
FDR in the GSEA and edgeR were adjusted for multiple testing with the Benjamini-Hochberg procedure [29-31]. Survival analysis was performed by using the Kaplan-Meier method with the log-rank test, and Cox proportional hazards regression model with hazard ratios (HRs) and 95% confidence intervals (CIs). All statistical analyses were conducted with SPSS version 22.0 (IBM Corporation, Armonk, NY, USA) and R3.3.1 (https://www.r-project.org/). P-value <0.05 was considered statistically significant.
Results
Clinical features
There were 257 sarcoma patients included in the present study. We observed that patients with sarcoma with an age of more than 65 years, residual tumor (R1/R2/Rx), and multinodular were significantly associated with a poor OS (Table 1). In the multivariate Cox proportional hazards regression model, we also observed that patients with an age of more than 65 years (adjusted P=0.018, adjusted HR=2.099, CI=1.138-3.872, Table 1) and residual tumors (R1/R2/Rx, adjusted P=0.013, adjusted HR=2.146, CI=1.176-3.914, Table 1) may be an independent prognostic indicator for sarcoma OS and increased risk of death.
Univariate and multivariate survival analysis of PVT1 and clinical parameters of the sarcoma cohort in TCGA.
| Variables | Events/total (n=257) | MST (days) | Univariate analysis | Multivariate analysis | |||
|---|---|---|---|---|---|---|---|
| HR (95% CI) | P | HR (95% CI) | P | ||||
| Age (years) | |||||||
| ≤65 | 46/157 | 2599 | 1 | 1 | |||
| >65 | 52/100 | 1164 | 2.362(1.584-3.523) | <0.0001 | 2.099(1.138-3.872) | 0.018 | |
| Gender | |||||||
| Female | 57/140 | 1991 | 1 | 1 | |||
| Male | 41/117 | 1970 | 0.874(0.585-1.306) | 0.511 | 1.177(0.664-2.087) | 0.576 | |
| Histological type | |||||||
| Dedifferentiated liposarcoma | 25/58 | 1 | 1 | ||||
| Leiomyosarcoma (LMS) | 41/104 | 0.842(0.512-1.385) | 0.498 | 1.464(0.539-3.977) | 0.454 | ||
| Others § | 32/95 | 0.823(0.478-1.389) | 0.466 | 1.521(0.600-3.854) | 0.377 | ||
| Tumor size £ | |||||||
| ≤5cm | 8/37 | 2599 | 1 | 1 | |||
| >5cm | 84/209 | 1941 | 1.727(0.836-3.570) | 0.14 | 1.301(0.496-3.417) | 0.593 | |
| Radiation therapy ₤ | |||||||
| Yes | 27/74 | 1953 | 1 | 1 | |||
| NO | 70/177 | 1991 | 1.155(0.740-1.801) | 0.526 | 1.330(0.724-2.442) | 0.358 | |
| Residual tumor & | |||||||
| R0 | 44/153 | NA | 1 | 1 | |||
| R1/R2/Rx | 54/103 | 1175 | 2.533(1.697-3.781) | <0.0001 | 2.146(1.176-3.914) | 0.013 | |
| Tumor multifocal Ψ | |||||||
| Single | 64/188 | 2448 | 1 | 1 | |||
| Multiple | 26/49 | 1941 | 1.680(1.065-2.652) | 0.026 | 1.935(0.954-3.926) | 0.067 | |
| Tumor total necrosis percent | |||||||
| No necrosis(0%) | 20/69 | 2575 | 1 | 1 | |||
| Focal necrosis(<10%) | 14/38 | 2448 | 1.427(0.720-2.830) | 0.309 | 1.833(0.850-3.951) | 0.122 | |
| Moderate Necrosis(≥10,<50%) | 26/61 | 1536 | 1.609(0.896-2.888) | 0.111 | 1.377(0.675-2.809) | 0.379 | |
| Extensive Necrosis(>50%) | 5/12 | 1941 | 1.409(0.527-3.771) | 0.494 | 1.280(0.403-4.063) | 0.675 | |
| PVT1 expression level | |||||||
| Low expression | 67/193 | 2448 | 1 | 1 | |||
| Overexpression | 31/64 | 1235 | 1.727(1.127-2.647) | 0.012 | 2.590(1.393-4.816) | 0.003 | |
Notes:§Others group including Myxofibrosarcoma; Giant cell MFH / Undifferentiated pleomorphic sarcoma with giant cells; Sarcoma, synovial, poorly differentiated; Synovial Sarcoma - Biphasic; Synovial Sarcoma - Monophasic; Undifferentiated Pleomorphic Sarcoma (UPS); Malignant Peripheral Nerve Sheath Tumors (MPNST). £ Information of tumor size was unavailable in 11 patients; ₤ Information of radiation therapy was unavailable in 6 patients; &Information of residual tumor was unavailable in 1 patients; Ψ Information of tumor multifocal was unavailable in 20 patients.
Abbreviation: PVT1, plasmacytoma variant translocation 1; TCGA, The Cancer Genome Atlas; MST, median survival time; HR, hazard ratio; CI, confidence interval.
Prognostic value of PVT1 in sarcoma
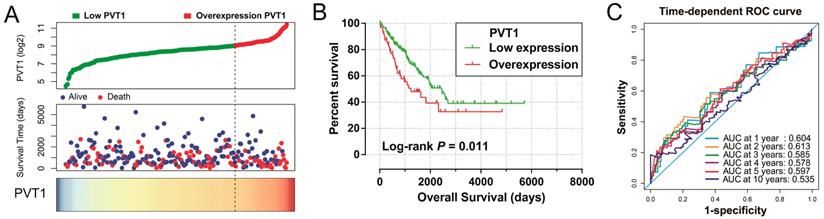
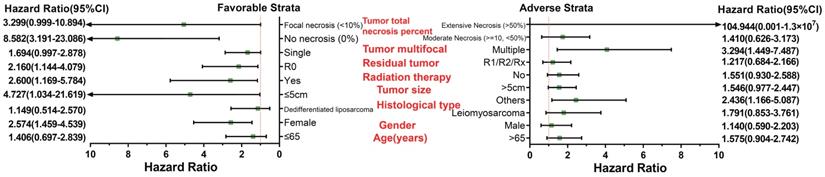
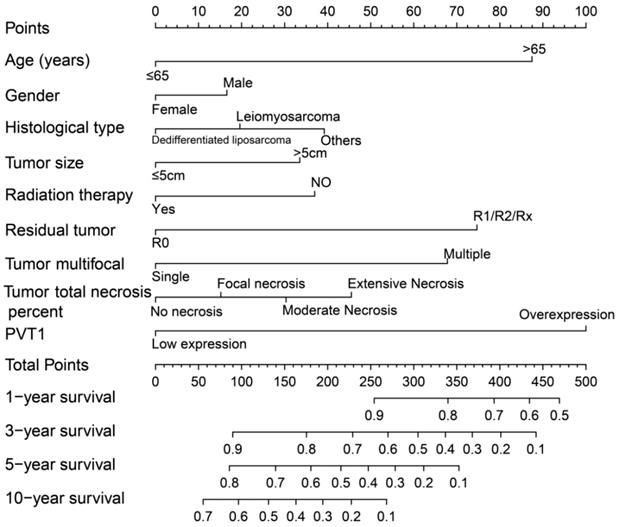
Survival analysis indicated that an overexpression of PVT1 was significantly correlated to an unfavourable sarcoma OS (Figure 1A, B), and multivariate Cox proportional hazards regression model substantiated PVT1 may be an independent prognostic indicator for sarcoma OS and increased risk of death (adjusted P=0.003, adjusted HR=2.590, CI=1.393-4.816, Table 1). Time-dependent ROC showed that PVT1 expression can predict the OS at 1 and 2 years for sarcoma patients, with an area under the curve (AUC) of 0.604 and 0.613 (Figure 1C), respectively. Furthermore, we also performed a stratified analysis to assess the prognostic value of PVT1 in different subgroups, and observed that PVT1 was significantly associated with poor OS in patients with subgroups of residual tumor (R0), radiation therapy, no necrosis (0%), tumor size ≤5 cm, multinodular, female, and others histological type (Figure 2). The nomogram of PVT1 and others clinical parameters showed that PVT1 will contribute to the most points in the model, compared to other traditional clinical parameters (Figure 3).
Prognostic value of PVT1 in patients with sarcoma. Notes: (A) From top to bottom are the distribution plot of PVT1 expression and patients' survival status and heat map of PVT1 expression. (B) Kaplan-Meier curves for the low and overexpression PVT1 groups. (C) ROC curves for predicting OS in sarcoma patients by PVT1 expression. Abbreviation: PVT1, plasmacytoma variant translocation 1; AUC, area under the curve; ROC, receiver operating characteristic.
Stratified analysis of PVT1 expression in sarcoma OS. Abbreviation: PVT1, plasmacytoma variant translocation 1; OS, overall survival.
Nomogram of PVT1 and other clinical information for sarcoma 1-, 2-, 3-, 4-, 5- and 10-year event (death) prediction. Abbreviation: PVT1, plasmacytoma variant translocation 1.
DEG screening and functional assessment
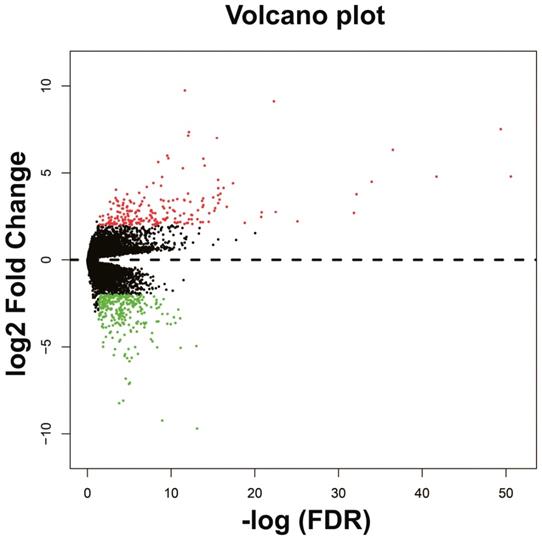
The DEGs between low expression and overexpression PVT1 were identified by edgeR, and a total of 517 genes were identified as DEGs. Of these 517 genes, 306 DEGs were down-regulated and 211 DEGs were up-regulated when PVT1 was overexpressed in tumor tissues (Figure 4 and Figure S1). Functional enrichment of gene ontology (GO) suggests that these DEGs were significantly enriched in multiple biological processes, such as sarcomere organization, stem cell differentiation, cell differentiation, and cell surface receptor signaling pathway (Table S1). Whereas the Kyoto Encyclopedia of Genes and Genomes (KEGG) enrichment suggest that these DEGs were significantly enriched in the calcium signaling pathway and tight junction.
Volcano plots of differentially expressed genes between low and overexpression PVT1 groups. Abbreviation: PVT1, plasmacytoma variant translocation 1; FDR, false discovery rate.
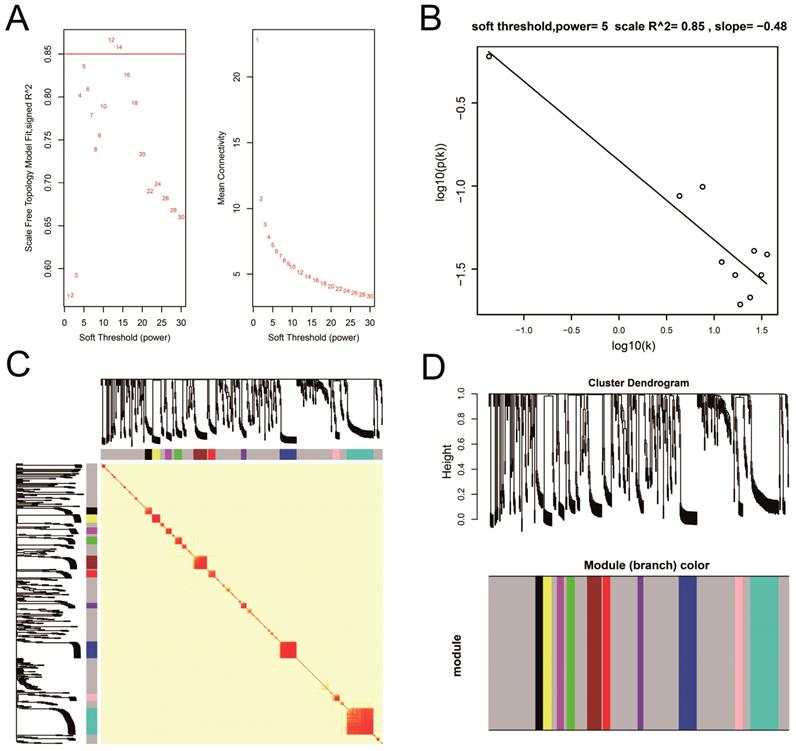
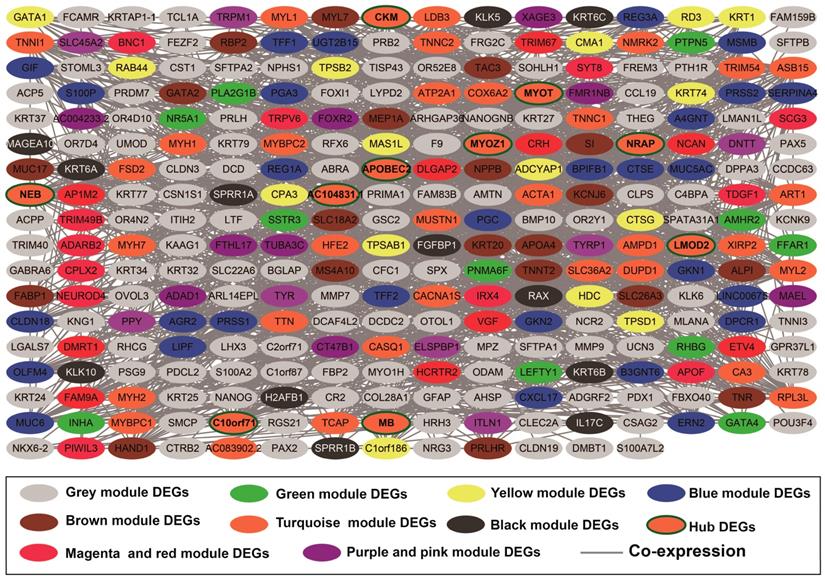
WGCNA and hub DEG screening
Co-expression networks of DEGs were constructed using the WGCNA method and validated by GeneMANIA and STRING. The soft threshold power in the present study was set as 5 (Figure 5A, B), these DEGs have been divided into 11 modules by module analysis (Figure 5C, D, Table S3). The DEGs in the gray module representation do not belong to any cluster. The WGCNA co-expression network is shown in Figure 6 and Table S4, and we identified that the top ten-degree DEGs were identified as hub DEGs. The hub DEGs in the WGCNA co-expression network of sarcoma tumor tissues were as follows: chromosome 10 open reading frame 71 (C10orf71), myoglobin (MB), nebulin related anchoring protein (NRAP), AC104831.1, apolipoprotein B mRNA editing enzyme catalytic subunit 2 (APOBEC2), creatine kinase, M-type (CKM), leiomodin 2 (LMOD2), myotilin (MYOT), myozenin 1 (MYOZ1), and nebulin (NEB).
Plot of WGCNA analysis. Notes: (A) Soft threshold screening plot; (B) Scale-free topology plot; (C) Clustering dendrograms of genes; (D) TOM plot. Abbreviation: WGCNA, weighted gene co-expression network analysis; TOM, topological overlap matrix.
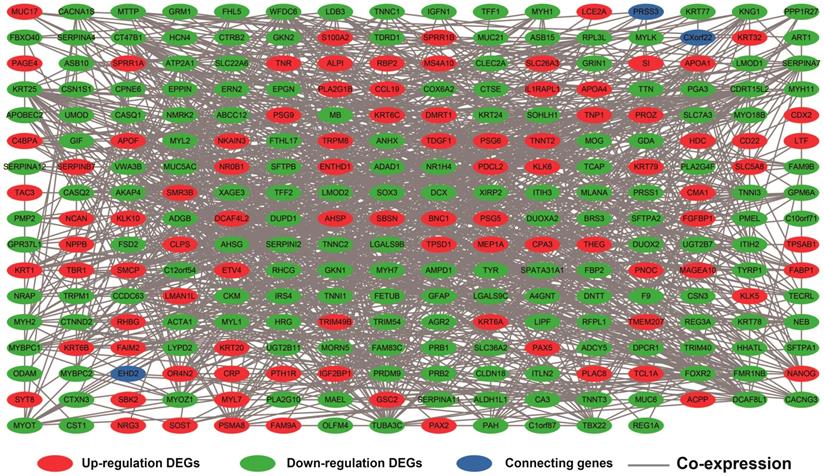
Weighted co-expression network for DEGs between low expression and overexpression PVT1 groups. Abbreviation: DEGs, differentially expressed genes.
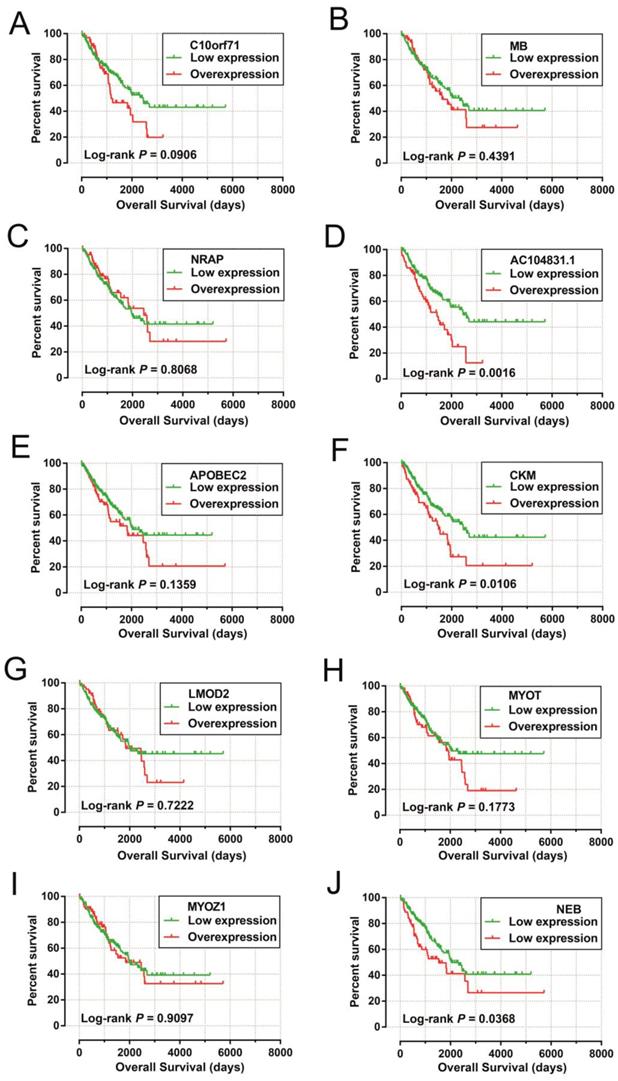
The DEGs with the highest degrees in the network were C10orf71, MB and NRAP, with 39 degrees. Survival analysis (Figure 7A-J) of the top ten hub DEGs indicate that overexpression of AC104831.1, CKM, and NEB was significantly associated with poor OS in patients with sarcoma. To verify the co-expression relationship of these DEGs, we also performed a GeneMANIA (Figure 8) and STRING (Figure 9) network interaction analysis and observed that these DEGs have a complex relationship of co-expression and interaction, respectively.
Kaplan-Meier survival curves of hub DEGs in weighted co-expression networks. Notes: Overall survival stratified by C10orf71 (A), MB (B), NRAP (C), AC104831.1(D), APOBEC2 (E),CKM (F), LMOD2 (G), MYOT (H), MYOZ1 (I) and NEB (J). Abbreviation: C10orf71, chromosome 10 open reading frame 71;MB, myoglobin; NRAP, nebulin related anchoring protein; APOBEC2, apolipoprotein B mRNA editing enzyme catalytic subunit 2; CKM, creatine kinase, M-type; LMOD2, leiomodin 2; MYOT, myotilin; MYOZ1, myozenin 1; NEB, nebulin.
Co-expression network of DEGs constructed by GeneMANIA. Abbreviation: DEGs, differentially expressed genes.
Co-expression network of DEGs constructed by STRING. Abbreviation: DEGs, differentially expressed genes.
CMap Analysis
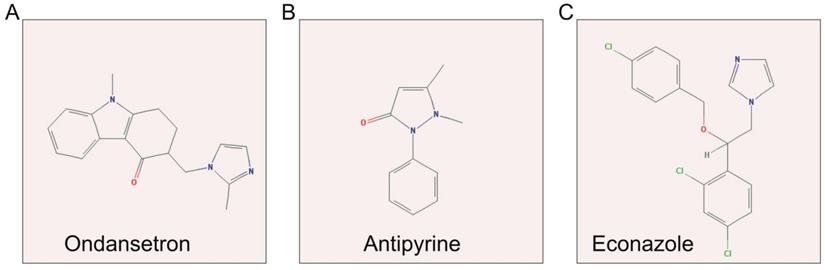
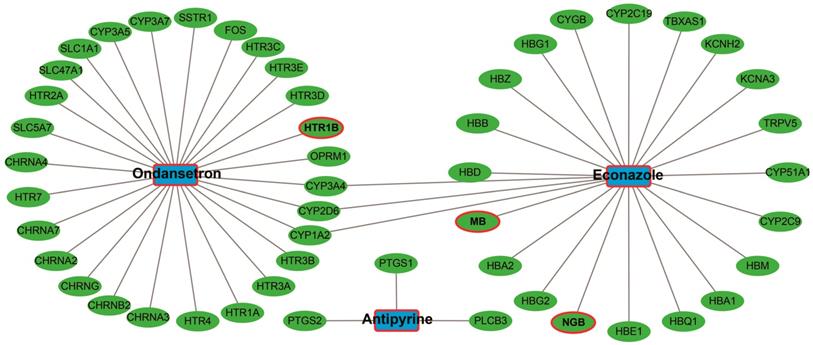
The up-regulated and down-regulated DEGs were input into CMap to query. Only three small-molecule drugs with a mean connective score <-0.2 were identified as potential targeted drugs for sarcoma patients with overexpression of PVT1. The chemical structures of these three small-molecule drugs are shown in Figure 10, they are antipyrine, ondansetron, and econazole (Table 2). The protein-chemical interaction networks are shown in Figure 11. In the protein-chemical interaction networks, we observed three DEGs between PVT1 low and overexpression groups. They are neuroglobin (NGB), MB, and 5-hydroxytryptamine receptor 1B (HTR1B). Therefore, we conclude that ondansetron may have an inhibiting effect on PVT1 in sarcoma by regulating HTR1B, whereas, econazole inhibition was through regulating NGB and MB. In addition, because MB is a hub DEG in the WGCNA network of sarcoma tumor tissues, we conclude that econazole plays a role in its suppression mainly through the regulation of MB. However, further experiments are needed to confirm this hypothesis.
Structures of three candidate small-molecule drugs. Notes: (A) ondansetron; (B) antipyrine; and (C) econazole.
Potential small-molecule drugs for sarcoma patients with overexpression of PVT1 identified by CMap.
| CMap name | mean connective score | n | enrichment | P value | specificity | percent non-null |
|---|---|---|---|---|---|---|
| ondansetron | -0.434 | 4 | -0.81 | 0.00255 | 0.0075 | 50 |
| phenazone | -0.461 | 3 | -0.77 | 0.02498 | 0.0578 | 66 |
| econazole | -0.374 | 4 | -0.659 | 0.0306 | 0.1111 | 50 |
Abbreviation: PVT1, plasmacytoma variant translocation 1; CMap, Connectivity Map.
Candidate small-molecule drug-target genes interaction network.
Genome-wide PVT1 co-expression PCG network construction
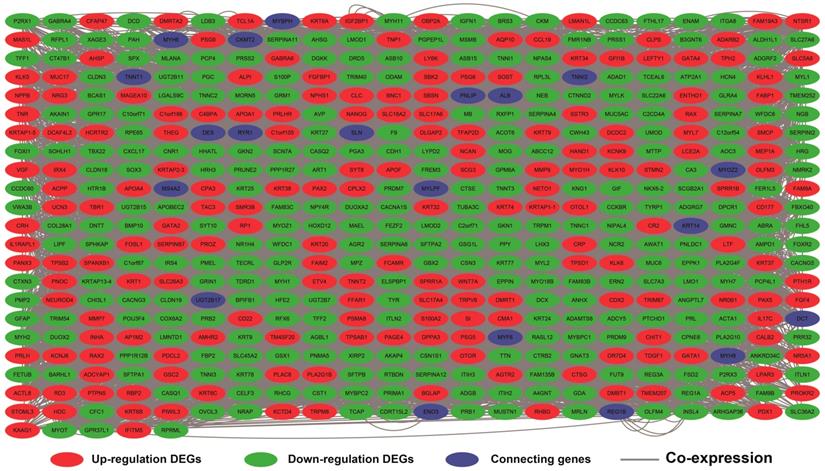
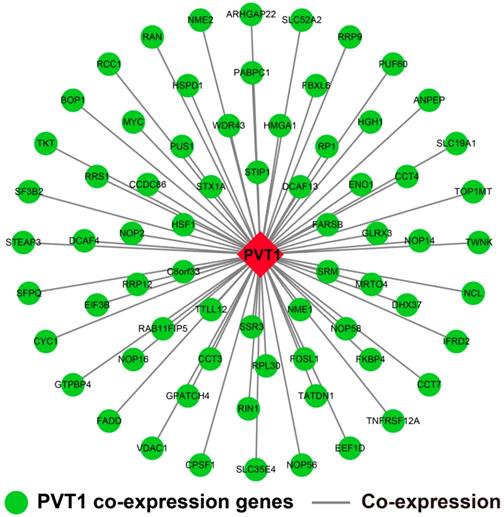
The genome-wide PVT1 co-expression PCG network construction was performed with 18,143 PCGs from 257 sarcoma tumor tissues. A total of 69 genes with the |Pearson correlation coefficient| >0.4 and P-value <0.05 were identified as PVT1 co-expression PCGs (Figure 12). Functional assessment of these co-expression PCGs was carried out by using DAVID v6.8. GO term enrichment suggests that these co-expression PCGs were significantly correlated with mRNA transcription, angiogenesis, heat shock protein binding, RNA binding, cyclin-dependent protein kinase activating kinase holoenzyme complex, positive regulation of epithelial cell proliferation, and cell-cell adhesion (Table S5). The KEGG analysis suggests that these co-expression PCGs were involved in ribosome biogenesis in eukaryotes, RNA degradation, and biosynthesis of antibiotics (Table S6).
PVT1 co-expression networks in sarcoma tumor tissues. Abbreviation: PVT1, plasmacytoma variant translocation 1.
GSEA
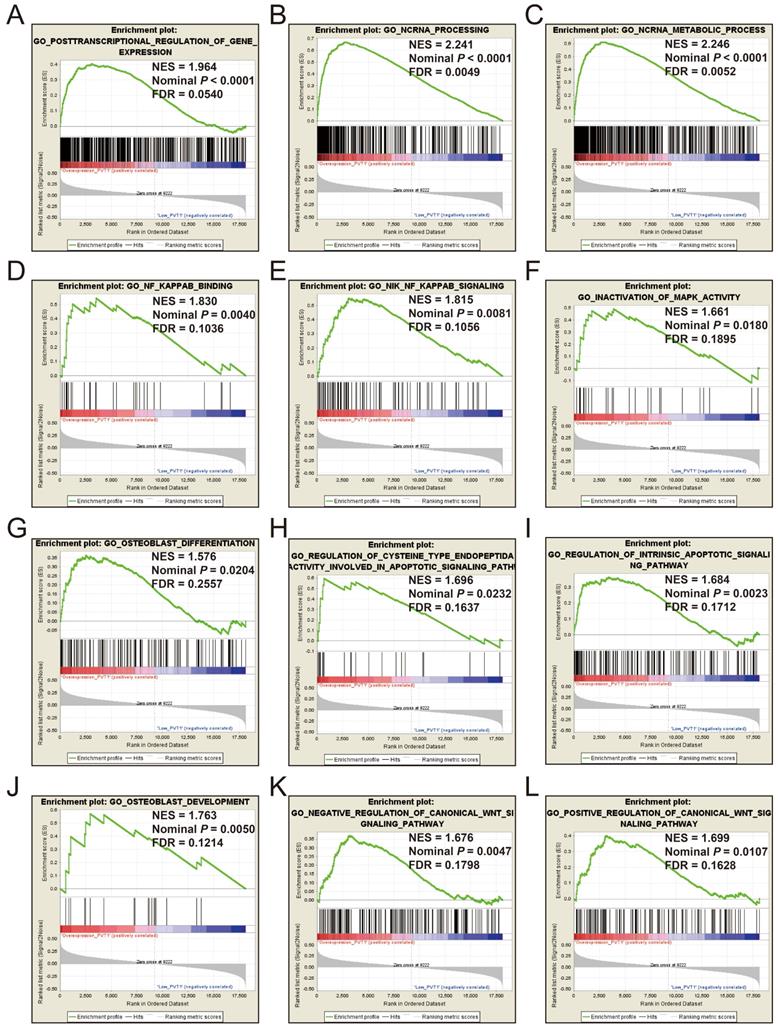
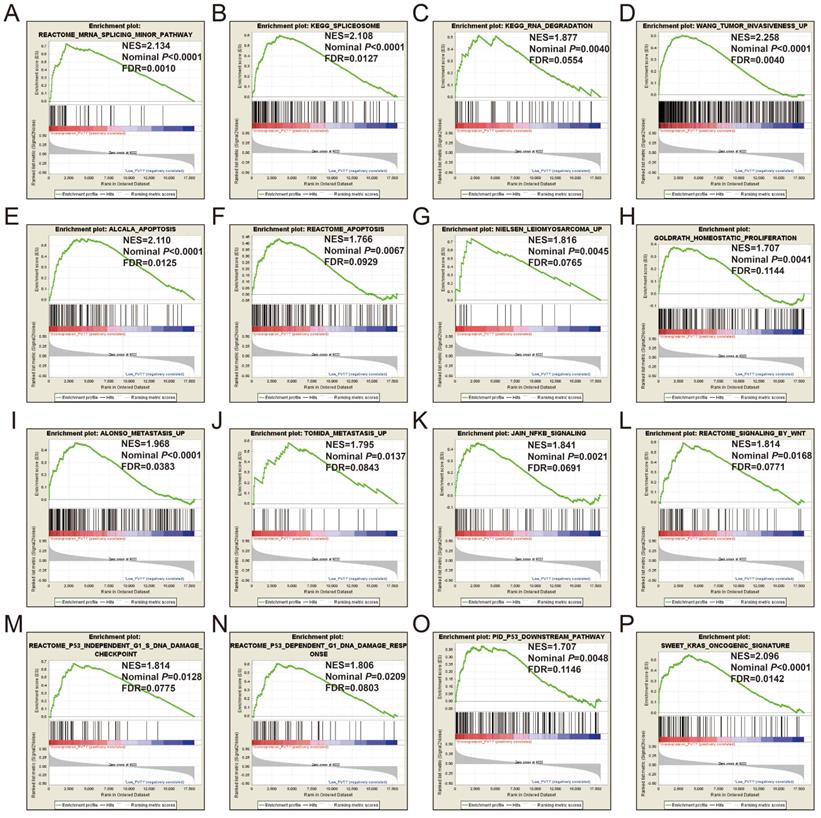
GSEA of c5 a priori defined gene sets indicate that the prognosis of PVT1 overexpression is mainly involved in the difference of the following multiple biological processes: posttranscriptional regulation of gene expression, ncRNA processing, ncRNA metabolic process, nuclear factor kappa B (NF-KB) signaling pathway, inactivation of mitogen-activated protein kinase (MAPK) activity, osteoblast differentiation and development, regulation of apoptotic signaling pathway, and Wnt signaling pathway (Figure 13A-L, Table S7). The GSEA of a c2 a priori defined gene set indicates that mRNA splicing minor pathway, spliceosome, RNA degradation, tumor invasiveness, apoptosis, leiomyosarcoma, homeostatic proliferation, metastasis, NF-KB and Wnt signaling pathway, Kras oncogenic signature, and tumor protein p53 pathway (Figure 14A-P, Table S8) were significantly enriched in groups of PVT1 was overexpressed.
GSEA results of c5 reference gene sets for overexpression PVT1 groups. (A) GO POSTTRANSCRIPTIONAL REGULATION OF GENE EXPRESSION, (B) GO NCRNA PROCESSING, (C) GO NCRNA METABOLIC PROCESS, (D) GO NF KAPPAB BINDING, (E) GO NIK NF KAPPAB SIGNALING, (F) GO INACTIVATION, (G) GO OSTEOBLAST DIFFERENTIATION, (H) GO REGULATION OF CYSTEINE TYPE ENDOPEPTIDA ACTIVITY INVOLVED IN APOPTOTIC SIGNALING PATHWAY, (I) GO REGULATION OF INTRINSIC APOPTOTIC SIGNALING PATHWAY, (J) GO OSTEOBLAST DEVELOPMENT, (K) GO NEGATIVE REGULATION OF CANONICAL WNT SIGNALING PATHWAY, (L) GO POSITIVE REGULATION OF CANONICAL WNT SIGNALING PATHWAY. Abbreviations: ES, enrichment score; NES, normalized enrichment score; FDR, false discovery rate; GSEA, gene set enrichment analysis; PVT1, plasmacytoma variant translocation 1.
GSEA results of c2 reference gene sets for overexpression PVT1 groups. (A) REACTOME MRNA SPLICING MINOR PATHWAY, (B) KEGG SPLICEOSOME, (C) KEGG RNA DEGRADATION, (D) WANG TUMOR INVASIVENESS, (E) ALCALA APOPTOSIS, (F) REACTOME APOPTOSIS, (G) NIELSEN LEIOMYOSARCOMA UP, (H) GOLDRATH HOMEOSTATIC PROLIFERATION, (I) ALONSO METASTASIS UP, (J) TOMIDA METASTASIS UP, (K) JAIN NFKB SIGNALING, (L) REACTOME SIGNALING BY WNT, (M) REACTOME P53 INDEPENDENT G1 S DNA DAMAGE CHECKPOINT, (N) REACTOME P53 DEPENDENT G1 DNA DAMAGE RESPONSE, (O) PID P53 DOWNSTREAM, (P) SWEET KRAS ONCOGENIC SIGNATURE. Abbreviations: ES, enrichment score; NES, normalized enrichment score; FDR, false discovery rate; GSEA, gene set enrichment analysis; PVT1, plasmacytoma variant translocation 1.
Discussion
PVT1 has been reported to be up-regulated in multiple cancer tumor tissues and identified as an oncogene by functional experiments [32]. Due to differential expression between tumor and normal tissues, it is also considered as a diagnostic biomarker for a variety of cancers [32-34]. The up-regulation of PVT1 in tumor tissues can be observed in 18 types of cancers in the TCGA database [32], moreover, several other cohort studies have confirmed this [5, 35-40]. The oncogene role of PVT1 in cancers have been identified in multiple cancers including bladder cancer [41], nasopharyngeal carcinoma (NPC) [40], colorectal cancers (CRC) [37], non-small-cell lung cancer (NSCLC) [42, 43], clear cell renal cell carcinoma (ccRCC) [36], gastric cancer (GC) [44-46], head and neck squamous cell carcinoma (HNSCC)[35], prostate cancer (PC) [34], esophageal squamous cell carcinoma (ESCC) [47], osteosarcoma [48, 49], hepatocellular carcinoma (HCC)[50, 51], and pancreatic ductal adenocarcinoma (PDAC) [52].
The prognostic values of PVT1 were also investigated in multiple cancer types in multiple cohorts. Large-scale survival analysis of PVT1 using TCGA database was performed by He and his co-workers and it was observed that PVT1 expression is up-regulated in tumor tissues compared with paired non-cancer tissues and significantly correlates to a worse clinical outcome and advanced stage in human cancers [5].
In their investigation of the prognosis of sarcoma from a TCGA cohort, they did not observe that the expression of PVT1 was significantly associated with sarcoma OS because their original dataset was extracted from the Oncolnc website (http://www.oncolnc.org/), which is a third-party data integration website of TCGA database, and the cut-off value of low- and high-expression groups were according to the median value [5]. A similar study by Chen et al. also performed a large-scale survival analysis of PVT1 by using the TCGA RNA-seq data from the UCSC Xena website (https://xenabrowser.net/heatmap/) and assessed this data by a univariate Cox proportional hazards model, they observed that low- and high-expression of PVT1 grouped by the median values were significantly associated with sarcoma OS [53]. Although the prognosis analysis of TCGA sarcoma PVT1 was analyzed, both of these previous studies extracted the PVT1 expression data from a third-party data integration website of TCGA. Due to the RNA-seq data processing methods, patient inclusion and exclusion criteria between the UCSC Xena and Oncolnc websites may be different, this will result in inconsistent results of the same cohort in these two previous studies, users cannot control the quality of the original data. In addition, these two previous studies did not make full use of the advantages of whole genome data to carry out comprehensive mining, but only stayed at the level of prognosis analysis, therefore, the potential expression profiling, functions, pathways, mechanism, and targeted therapeutic drugs of PVT1 in sarcoma remain unclear. Thus, it is necessary to use genome-wide analysis tools to further explore the molecular mechanism of PVT1 and screen potential targeted therapeutic drugs. In the present study, we grouped the low and overexpression of PVT1 by the upper quarter expression value, which can more accurately reflect the high expression level of PVT1. The advantage of our study is that we made full use of the whole genome dataset to screen the DEGs between different PVT1 expression levels, and identified hub DEGs by the WGCNA method. Through the DEGs, we can further perform an investigation to screen the potential small-molecule drugs for targeted therapy of PVT1 overexpression by using the CMap online tools. Furthermore, we also used the genome-wide RNA-seq dataset to perform a GSEA between different PVT1 expression groups and identified the potential mechanism of PVT1 in sarcoma prognosis. Consistent with previous studies, we found that PVT1 is a biomarker of a poor prognosis in sarcoma and can be a novel therapeutic target.
Extensive previous studies have observed that the high expression of PVT1 significantly increased the risk of death in patients with GC [33, 44-46, 54, 55], CRC [37, 56], NSCLC [43, 57], ccRCC [36, 58, 59], uveal melanoma [60], HNSCC [35, 61], PDAC [52], NPC [40], PC [34], ESCC [47], ovarian cancer (OC) [62], high-grade serous carcinoma [63], cervical cancer [64, 65], and osteosarcoma [48, 49]. Xu et al. also identified and verified that PVT1 was significantly correlated to tumor metastasis of ccRCC by using a comprehensive genome-wide analysis [59]. In terms of tumor progression, multiple previous studies have observed that PVT1 is up-regulated in advanced stage tumor tissues, and significantly associated with malignant progression in patients with ESCC [47], OC [62], and HNSCC [61]. Multiple meta-analysis studies have comprehensively evaluated these previous studies, and suggest that PVT1 could serve as a novel biomarker for metastasis, clinical stage, and poor prognosis in various tumors [6, 53, 66].
For functional assessment of DEGs and PVT1 co-expression genes, we found that these genes enriched in multiple biological processes and pathways were associated with oncogenic function. The biological processes of the regulation of stem cell differentiation, cell differentiation, cell surface receptor signaling pathway, cell-cell adhesion, and angiogenesis were correlated to tumorigenesis and progression [44, 46, 67]. Through literature review indicated that the three small-molecule drugs for PVT1 targeted therapy identified in the present study have not been reported to be associated with sarcoma treatment in previous studies. The effectiveness of these candidate small-molecule targeted drugs still needs further experimental verification.
For GSEA mechanism investigations, we have enriched multiple biological processes and pathways that were related to the characteristics of long non-coding RNA, including posttranscriptional regulation of gene expression, ncRNA processing, ncRNA metabolic process, and RNA degradation. Functional related mechanisms are enriched in apoptotic, Wnt, MAPK, and NF-KB signaling pathway, which were significantly associated with tumorigenesis. Previous studies have demonstrated that PVT1 promotes angiogenesis by activating specific pathways in cancers [44, 67]. Similar functional studies of PVT1 can also be found in other types of cancers. PVT1 up-regulation in CRC promotes tumor cell proliferation, invasion, and metastasis. The promotion of cancer metastasis by PVT1 can also be observed in HCC [68], as well as its inductive effect on apoptosis in HCC [69]. PVT1 may participate in the induction of apoptosis by regulating p53 [70], and play an oncogenic role by regulating mutant p53 [35].
Multiple previous studies have also substantiated the relationship of PVT1 as an oncogene involved in Wnt and NF-KB signaling pathways [51, 61, 71]. Most of these GSEA enrichment results of PVT1 in sarcoma were consistent with previous studies, and we infer that PVT1 can be a novel therapeutic target for sarcoma and may have clinical application values in sarcoma prognosis monitoring and the designation of treatment strategy.
There were several limitations that need to be explained clearly in the present study. Our findings were obtained only from TCGA sarcoma patient cohorts with a sample size of 257, a future study with a large sample size to verify our results is needed. Second, because the sample size in the present study was small, we did not observe that PVT1 showed a good prognostic predictive ability in all subgroups of sarcoma. Third, due to the absence of some clinical parameters of patients with sarcoma in TCGA, we failed to include all prognostic factors of sarcoma in the survival analysis and nomogram construction. Despite the limitations mentioned above, our study is the first time to comprehensively investigate the clinical significance and prospective molecular regulatory mechanism of PVT1 in sarcoma using a whole genome RNA-seq dataset, discover its clinical significance in predicting the prognosis of sarcoma, and identify three potential PVT1 targeted drugs using CMap. Once the above findings are confirmed, PVT1 will play an important role in the treatment and prognosis monitoring of sarcoma.
Conclusion
Our findings indicate that PVT1 can serve as a prognosis biomarker in patients with sarcoma, and performed well in short-term OS prediction. By screening the DEGs between different PVT1 expression groups, we have identified ten hub DEGs, as well as DEG co-expression network identification and validation. Furthermore, we also identified three potential small-molecule drugs (antipyrine, ondansetron, and econazole) for targeted therapy of PVT1 overexpression in sarcoma patients. The potential molecular mechanism of PVT1 in sarcoma may involve the posttranscriptional regulation of gene expression, tumor invasiveness and metastasis, osteoblast differentiation and development, apoptosis, NF-KB, Wnt, and apoptotic related signaling pathways. However, our results still need further confirmation by experiments in vivo and in vitro and in clinical trials.
Supplementary Material
Supplementary figure.
Supplementary tables.
Acknowledgements
This work was supported in part by Youth Science and Technology Innovation and Entrepreneurship Talent Cultivation Project of Nanning (RC20180107), the Innovation Project of Guangxi Graduate Education (Grant /Award Number: YCBZ2018034); Scientific Project of Guangxi Health and Family Planning Commission (Grant /Award Number: Z20170107). The authors thank the contributors of The Cancer Genome Atlas (https://cancergenome.nih.gov/) for sharing the sarcoma dataset on open access. In addition, we would like to acknowledge the helpful comments on this article received from our reviewers.
ORCID: https://orcid.org/0000-0002-9975-1562.
Competing Interests
The authors have declared that no competing interest exists.
References
1. Cormier JN, Pollock RE. Soft tissue sarcomas. CA: a cancer journal for clinicians. 2004;54:94-109
2. Helman LJ, Meltzer P. Mechanisms of sarcoma development. Nature reviews Cancer. 2003;3:685-94
3. Cancer Genome Atlas Research N, Weinstein JN, Collisson EA, Mills GB, Shaw KR, Ozenberger BA. et al. The Cancer Genome Atlas Pan-Cancer analysis project. Nature genetics. 2013;45:1113-20
4. Tomczak K, Czerwinska P, Wiznerowicz M. The Cancer Genome Atlas (TCGA): an immeasurable source of knowledge. Contemporary oncology. 2015;19:A68-77
5. He RQ, Qin MJ, Lin P, Luo YH, Ma J, Yang H. et al. Prognostic Significance of LncRNA PVT1 and Its Potential Target Gene Network in Human Cancers: a Comprehensive Inquiry Based Upon 21 Cancer Types and 9972 Cases. Cellular physiology and biochemistry: international journal of experimental cellular physiology, biochemistry, and pharmacology. 2018;46:591-608
6. Xiao M, Feng Y, Liu C, Zhang Z. Prognostic values of long noncoding RNA PVT1 in various carcinomas: An updated systematic review and meta-analysis. Cell proliferation. 2018 e12519
7. Cancer Genome Atlas Research Network. Electronic address edsc, Cancer Genome Atlas Research N. Comprehensive and Integrated Genomic Characterization of Adult Soft Tissue Sarcomas. Cell. 2017;171:950-65 e28
8. Anders S, Huber W. Differential expression analysis for sequence count data. Genome biology. 2010;11:R106
9. Heagerty PJ, Zheng Y. Survival model predictive accuracy and ROC curves. Biometrics. 2005;61:92-105
10. Robinson MD, McCarthy DJ, Smyth GK. edgeR: a Bioconductor package for differential expression analysis of digital gene expression data. Bioinformatics. 2010;26:139-40
11. Dennis G Jr, Sherman BT, Hosack DA, Yang J, Gao W, Lane HC. et al. DAVID: Database for Annotation, Visualization, and Integrated Discovery. Genome biology. 2003;4:P3
12. Huang da W, Sherman BT, Lempicki RA. Systematic and integrative analysis of large gene lists using DAVID bioinformatics resources. Nature protocols. 2009;4:44-57
13. Langfelder P, Horvath S. WGCNA: an R package for weighted correlation network analysis. BMC bioinformatics. 2008;9:559
14. Liao X, Huang K, Huang R, Liu X, Han C, Yu L. et al. Genome-scale analysis to identify prognostic markers in patients with early-stage pancreatic ductal adenocarcinoma after pancreaticoduodenectomy. OncoTargets and therapy. 2017;10:4493-506
15. Warde-Farley D, Donaldson SL, Comes O, Zuberi K, Badrawi R, Chao P. et al. The GeneMANIA prediction server: biological network integration for gene prioritization and predicting gene function. Nucleic acids research. 2010;38:W214-20
16. Mostafavi S, Ray D, Warde-Farley D, Grouios C, Morris Q. GeneMANIA: a real-time multiple association network integration algorithm for predicting gene function. Genome biology. 2008;9(Suppl 1):S4
17. von Mering C, Huynen M, Jaeggi D, Schmidt S, Bork P, Snel B. STRING: a database of predicted functional associations between proteins. Nucleic acids research. 2003;31:258-61
18. Szklarczyk D, Morris JH, Cook H, Kuhn M, Wyder S, Simonovic M. et al. The STRING database in 2017: quality-controlled protein-protein association networks, made broadly accessible. Nucleic acids research. 2017;45:D362-D8
19. Lamb J. The Connectivity Map: a new tool for biomedical research. Nature reviews Cancer. 2007;7:54-60
20. Lamb J, Crawford ED, Peck D, Modell JW, Blat IC, Wrobel MJ. et al. The Connectivity Map: using gene-expression signatures to connect small molecules, genes, and disease. Science. 2006;313:1929-35
21. Kim S, Thiessen PA, Bolton EE, Chen J, Fu G, Gindulyte A. et al. PubChem Substance and Compound databases. Nucleic acids research. 2016;44:D1202-13
22. Wang Y, Bryant SH, Cheng T, Wang J, Gindulyte A, Shoemaker BA. et al. PubChem BioAssay: 2017 update. Nucleic acids research. 2017;45:D955-D63
23. Kuhn M, von Mering C, Campillos M, Jensen LJ, Bork P. STITCH: interaction networks of chemicals and proteins. Nucleic acids research. 2008;36:D684-8
24. Kuhn M, Szklarczyk D, Franceschini A, Campillos M, von Mering C, Jensen LJ. et al. STITCH 2: an interaction network database for small molecules and proteins. Nucleic acids research. 2010;38:D552-6
25. Szklarczyk D, Santos A, von Mering C, Jensen LJ, Bork P, Kuhn M. STITCH 5: augmenting protein-chemical interaction networks with tissue and affinity data. Nucleic acids research. 2016;44:D380-4
26. Subramanian A, Tamayo P, Mootha VK, Mukherjee S, Ebert BL, Gillette MA. et al. Gene set enrichment analysis: a knowledge-based approach for interpreting genome-wide expression profiles. Proceedings of the National Academy of Sciences of the United States of America. 2005;102:15545-50
27. Mootha VK, Lindgren CM, Eriksson KF, Subramanian A, Sihag S, Lehar J. et al. PGC-1alpha-responsive genes involved in oxidative phosphorylation are coordinately downregulated in human diabetes. Nature genetics. 2003;34:267-73
28. Liberzon A, Birger C, Thorvaldsdottir H, Ghandi M, Mesirov JP, Tamayo P. The Molecular Signatures Database (MSigDB) hallmark gene set collection. Cell systems. 2015;1:417-25
29. Benjamini Y, Hochberg Y. Controlling the false discovery rate: a practical and powerful approach to multiple testing. Journal of the royal statistical society series b-statistical methodology. 1995;57:289-300
30. Reiner A, Yekutieli D, Benjamini Y. Identifying differentially expressed genes using false discovery rate controlling procedures. Bioinformatics. 2003;19:368-75
31. Benjamini Y, Drai D, Elmer G, Kafkafi N, Golani I. Controlling the false discovery rate in behavior genetics research. Behavioural brain research. 2001;125:279-84
32. Zeng Y, Wang T, Liu Y, Su Z, Lu P, Chen X. et al. LncRNA PVT1 as an effective biomarker for cancer diagnosis and detection based on transcriptome data and meta-analysis. Oncotarget. 2017;8:75455-66
33. Yuan CL, Li H, Zhu L, Liu Z, Zhou J, Shu Y. Aberrant expression of long noncoding RNA PVT1 and its diagnostic and prognostic significance in patients with gastric cancer. Neoplasma. 2016;63:442-9
34. Yang J, Li C, Mudd A, Gu X. LncRNA PVT1 predicts prognosis and regulates tumor growth in prostate cancer. Bioscience, biotechnology, and biochemistry. 2017;81:2301-6
35. Verduci L, Ferraiuolo M, Sacconi A, Ganci F, Vitale J, Colombo T. et al. The oncogenic role of circPVT1 in head and neck squamous cell carcinoma is mediated through the mutant p53/YAP/TEAD transcription-competent complex. Genome biology. 2017;18:237
36. Li W, Zheng Z, Chen H, Cai Y, Xie W. Knockdown of long non-coding RNA PVT1 induces apoptosis and cell cycle arrest in clear cell renal cell carcinoma through the epidermal growth factor receptor pathway. Oncology letters. 2018;15:7855-63
37. Takahashi Y, Sawada G, Kurashige J, Uchi R, Matsumura T, Ueo H. et al. Amplification of PVT-1 is involved in poor prognosis via apoptosis inhibition in colorectal cancers. British journal of cancer. 2014;110:164-71
38. Yu J, Han J, Zhang J, Li G, Liu H, Cui X. et al. The long noncoding RNAs PVT1 and uc002mbe.2 in sera provide a new supplementary method for hepatocellular carcinoma diagnosis. Medicine. 2016;95:e4436
39. Chen X, Gao G, Liu S, Yu L, Yan D, Yao X. et al. Long Noncoding RNA PVT1 as a Novel Diagnostic Biomarker and Therapeutic Target for Melanoma. BioMed research international. 2017;2017:7038579
40. He Y, Jing Y, Wei F, Tang Y, Yang L, Luo J. et al. Long non-coding RNA PVT1 predicts poor prognosis and induces radioresistance by regulating DNA repair and cell apoptosis in nasopharyngeal carcinoma. Cell death & disease. 2018;9:235
41. Zhuang C, Li J, Liu Y, Chen M, Yuan J, Fu X. et al. Tetracycline-inducible shRNA targeting long non-coding RNA PVT1 inhibits cell growth and induces apoptosis in bladder cancer cells. Oncotarget. 2015;6:41194-203
42. Guo D, Wang Y, Ren K, Han X. Knockdown of LncRNA PVT1 inhibits tumorigenesis in non-small-cell lung cancer by regulating miR-497 expression. Experimental cell research. 2018;362:172-9
43. Yang YR, Zang SZ, Zhong CL, Li YX, Zhao SS, Feng XJ. Increased expression of the lncRNA PVT1 promotes tumorigenesis in non-small cell lung cancer. International journal of clinical and experimental pathology. 2014;7:6929-35
44. Zhao J, Du P, Cui P, Qin Y, Hu C, Wu J. et al. LncRNA PVT1 promotes angiogenesis via activating the STAT3/VEGFA axis in gastric cancer. Oncogene. 2018;37:4094-109
45. Chen J, Li Y, Zheng Q, Bao C, He J, Chen B. et al. Circular RNA profile identifies circPVT1 as a proliferative factor and prognostic marker in gastric cancer. Cancer letters. 2017;388:208-19
46. Kong R, Zhang EB, Yin DD, You LH, Xu TP, Chen WM. et al. Long noncoding RNA PVT1 indicates a poor prognosis of gastric cancer and promotes cell proliferation through epigenetically regulating p15 and p16. Molecular cancer. 2015;14:82
47. Li PD, Hu JL, Ma C, Ma H, Yao J, Chen LL. et al. Upregulation of the long non-coding RNA PVT1 promotes esophageal squamous cell carcinoma progression by acting as a molecular sponge of miR-203 and LASP1. Oncotarget. 2017;8:34164-76
48. Zhou Q, Chen F, Zhao J, Li B, Liang Y, Pan W. et al. Long non-coding RNA PVT1 promotes osteosarcoma development by acting as a molecular sponge to regulate miR-195. Oncotarget. 2016;7:82620-33
49. Song J, Wu X, Liu F, Li M, Sun Y, Wang Y. et al. Long non-coding RNA PVT1 promotes glycolysis and tumor progression by regulating miR-497/HK2 axis in osteosarcoma. Biochemical and biophysical research communications. 2017;490:217-24
50. Zhang Y, Wen DY, Zhang R, Huang JC, Lin P, Ren FH. et al. A Preliminary Investigation of PVT1 on the Effect and Mechanisms of Hepatocellular Carcinoma: Evidence from Clinical Data, a Meta-Analysis of 840 Cases, and In Vivo Validation. Cellular physiology and biochemistry: international journal of experimental cellular physiology, biochemistry, and pharmacology. 2018;47:2216-32
51. Zhang Y, Mo WJ, Wang X, Zhang TT, Qin Y, Wang HL. et al. Microarraybased bioinformatics analysis of the prospective target gene network of key miRNAs influenced by long noncoding RNA PVT1 in HCC. Oncology reports. 2018;40:226-40
52. Huang F, Chen W, Peng J, Li Y, Zhuang Y, Zhu Z. et al. LncRNA PVT1 triggers Cyto-protective autophagy and promotes pancreatic ductal adenocarcinoma development via the miR-20a-5p/ULK1 Axis. Molecular cancer. 2018;17:98
53. Chen X, Yang Y, Cao Y, Wu C, Wu S, Su Z. et al. lncRNA PVT1 identified as an independent biomarker for prognosis surveillance of solid tumors based on transcriptome data and meta-analysis. Cancer management and research. 2018;10:2711-27
54. Xu MD, Wang Y, Weng W, Wei P, Qi P, Zhang Q. et al. A Positive Feedback Loop of lncRNA-PVT1 and FOXM1 Facilitates Gastric Cancer Growth and Invasion. Clinical cancer research: an official journal of the American Association for Cancer Research. 2017;23:2071-80
55. Liu F, Dong Q, Huang J. Overexpression of LncRNA PVT1 Predicts Advanced Clinicopathological Features and Serves as an Unfavorable Risk Factor for Survival of Patients with Gastrointestinal Cancers. Cellular physiology and biochemistry: international journal of experimental cellular physiology, biochemistry, and pharmacology. 2017;43:1077-89
56. Fan H, Zhu JH, Yao XQ. Long non-coding RNA PVT1 as a novel potential biomarker for predicting the prognosis of colorectal cancer. The International journal of biological markers. 2018. 1724 600818777242
57. Huang C, Liu S, Wang H, Zhang Z, Yang Q, Gao F. LncRNA PVT1 overexpression is a poor prognostic biomarker and regulates migration and invasion in small cell lung cancer. American journal of translational research. 2016;8:5025-34
58. Bao X, Duan J, Yan Y, Ma X, Zhang Y, Wang H. et al. Upregulation of long noncoding RNA PVT1 predicts unfavorable prognosis in patients with clear cell renal cell carcinoma. Cancer biomarkers: section A of Disease markers. 2017;21:55-63
59. Xu X, Xu Y, Shi C, Wang B, Yu X, Zou Y. et al. A genome-wide comprehensively analyses of long noncoding RNA profiling and metastasis associated lncRNAs in renal cell carcinoma. Oncotarget. 2017;8:87773-81
60. Xu H, Gong J, Liu H. High expression of lncRNA PVT1 independently predicts poor overall survival in patients with primary uveal melanoma. PloS one. 2017;12:e0189675
61. Yu C, Wang Y, Li G, She L, Zhang D, Chen X. et al. LncRNA PVT1 promotes malignant progression in squamous cell carcinoma of the head and neck. Journal of Cancer. 2018;9:3593-602
62. Chen Y, Du H, Bao L, Liu W. LncRNA PVT1 promotes ovarian cancer progression by silencing miR-214. Cancer biology & medicine. 2018;15:238-50
63. Filippov-Levy N, Cohen-Schussheim H, Trope CG, Hetland Falkenthal TE, Smith Y, Davidson B. et al. Expression and clinical role of long non-coding RNA in high-grade serous carcinoma. Gynecologic oncology. 2018;148:559-66
64. Zhang S, Zhang G, Liu J. Long noncoding RNA PVT1 promotes cervical cancer progression through epigenetically silencing miR-200b. APMIS: acta pathologica, microbiologica, et immunologica Scandinavica. 2016;124:649-58
65. Iden M, Fye S, Li K, Chowdhury T, Ramchandran R, Rader JS. The lncRNA PVT1 Contributes to the Cervical Cancer Phenotype and Associates with Poor Patient Prognosis. PloS one. 2016;11:e0156274
66. Zhu S, Shuai P, Yang C, Zhang Y, Zhong S, Liu X. et al. Prognostic value of long non-coding RNA PVT1 as a novel biomarker in various cancers: a meta-analysis. Oncotarget. 2017;8:113174-84
67. Zheng J, Hu L, Cheng J, Xu J, Zhong Z, Yang Y. et al. lncRNA PVT1 promotes the angiogenesis of vascular endothelial cell by targeting miR26b to activate CTGF/ANGPT2. International journal of molecular medicine. 2018;42:489-96
68. Lan T, Yan X, Li Z, Xu X, Mao Q, Ma W. et al. Long non-coding RNA PVT1 serves as a competing endogenous RNA for miR-186-5p to promote the tumorigenesis and metastasis of hepatocellular carcinoma. Tumour biology: the journal of the International Society for Oncodevelopmental Biology and Medicine. 2017;39:1010428317705338
69. Guo J, Hao C, Wang C, Li L. Long noncoding RNA PVT1 modulates hepatocellular carcinoma cell proliferation and apoptosis by recruiting EZH2. Cancer cell international. 2018;18:98
70. Barsotti AM, Beckerman R, Laptenko O, Huppi K, Caplen NJ, Prives C. p53-Dependent induction of PVT1 and miR-1204. The Journal of biological chemistry. 2012;287:2509-19
71. Liu Z, Zhang H. LncRNA plasmacytoma variant translocation 1 is an oncogene in bladder urothelial carcinoma. Oncotarget. 2017;8:64273-82
Author contact
![]() Corresponding author: Prof. Jianwei Liu, Department of Spine Surgery, The Third Affiliated Hospital of Guangxi Medical University, Dan_Cun Road 13#, Nanning, 530031, Guangxi Zhuang Autonomous Region, People's Republic of China. Tel: (+86)-771-4808192; Fax: (+86)-771-4808013; Email: liujianweigxmu.edu.cn.
Corresponding author: Prof. Jianwei Liu, Department of Spine Surgery, The Third Affiliated Hospital of Guangxi Medical University, Dan_Cun Road 13#, Nanning, 530031, Guangxi Zhuang Autonomous Region, People's Republic of China. Tel: (+86)-771-4808192; Fax: (+86)-771-4808013; Email: liujianweigxmu.edu.cn.