Impact Factor ISSN: 1837-9664

 Global reach, higher impact
J Cancer 2019; 10(20):4754-4764. doi:10.7150/jca.32833 This issue Cite
Research Paper
Diagnostic Value of Circulating microRNAs in Hepatitis B Virus-Related Hepatocellular Carcinoma: A Systematic Review and Meta-Analysis
Xuehang Jin1*, Changzhou Cai2*, Yunqing Qiu1 ![]()
1. State Key Laboratory for Diagnosis and Treatment of Infectious Disease, Collaborative Innovation Center for Diagnosis and Treatment of Infectious Diseases, Zhejiang Provincial Key Laboratory for Drug Clinical Research and Evaluation, The First Affiliated Hospital, Zhejiang University, 79 QingChun Road, Hangzhou, Zhejiang 310000, People's Republic of China.
2. Department of Gastroenterogy, The First Affiliated Hospital of Zhejiang University School of Medicine, Hangzhou 310003, China.
* These authors contributed equally to this work.
Received 2019-1-5; Accepted 2019-6-6; Published 2019-8-20
Abstract
Chronic hepatitis B virus (CHB) infection is the leading cause of hepatocellular carcinoma (HCC). As it is difficult to diagnose the early-stage hepatocellular carcinoma using the existing approaches, better biomarkers are urgently needed and may improve the patients' prognoses. MicroRNAs are the most studied liquid biopsy biomarkers and multiple studies have demonstrated the significant diagnostic value of miRNA in HBV-related hepatocellular carcinoma. In this meta-analysis, we collected 25 studies from 15 researches that included a total of 2290 HBV-related HCC patients and 1551 HBV patients without HCC. The pooled sensitivity, specificity, PLR, NLR, DOR and AUC were 0.84 (95% CI: 0.79-0.88), 0.75 (95% CI: 0.69-0.81), 3.42 (95% CI: 2.68-4.35), 0.21 (95% CI: 0.16-0.29), 15.99 (95% CI: 9.89-25.83) and 0.87 (95% CI: 0.83-0.89), respectively. Subgroup analysis indicated that multiple microRNAs, downregulated miRNAs assays, serum type and big sample size had much better accuracy and miR-125b especially, showed a significant diagnostic value. In addition, there is no obvious dignostic difference for HCC from both chronic hepatitis B and liver cirrhosis (LC). Publication bias was not found and Fagan's Nomogram showed valuable clinical utility. In conclusion, circulating microRNAs, particularly the miR-125b, may serve as promising biomarkers for the early diagnosis of HBV-related HCC. However, larger and more rigorous studies are needed to confirm our conclusions.
Keywords: hepatocellular carcinoma, hepatitis B virus, circulating microRNA, biomarkers
Introduction
Hepatocellular carcinoma (HCC) is predicted to be the fifth most commonly diagnosed malignancy and the fourth leading cause of cancer-related death in 2018, with an incidence of 841,000 new cases and 782,000 deaths per year [1]. The chronic viral infection is the main cause and it has been reported that Hepatitis B Virus (HBV) infection causes approximately 80% of HCC. As a result, the early diagnosis of HCC from HBV-related hepatic diseases is obviously crucial. At present, the detection of HCC is mainly relied on the radiological imaging studies, including ultrasonography, computed tomography (CT) and magnetic resonance imaging (MRI). However, owing to the coexistence of inflammation and cirrhosis, the detection of early stage HCC is difficult and sometimes need liver biopsy for further verifying [2]. Alpha-Fetoprotein (AFP), the most commonly used serum biomarker, has the poor sensitivity and specificity of 41% to 65% and 80% to 94%, respectively, and can only detect the one-third of early HCC patients at the threshold level of 20 ng/mL [3-5]. Above all, advanced strategies for early detection of HCC from liver cirrhosis (LC)and chronic hepatitis B (CHB) with high accuracy are urgently needed.
MicroRNAs, a class of non-coding single-stranded RNAs (19 to 25 nucleotides long) , are the translational inhibitors of their target mRNAs by means of binding to the complementary sequences in the 3′- untranslated region (UTR) and result in the repression of relevant protein expression [6, 7]. It has been confirmed that microRNAs play a crucial role in all kinds of cellular processes, including proliferation, differentiation, metabolism and death [8, 9]. Most of all, various of studies have demonstrated the link between the deregulation of microRNAs and tumorigenesis. Further more, many researches about the specific microRNA have shown the ideal accuracy in the diagnosis of cancer, including hepatocellular cacinoma. One of the recent studies reported by chen et al. [10] measured the plasma-based miR-125b and concluded a significant accuracy in discriminating the HCC with CHB or LC, with a sensitivity of 93.8%/ 89.1% and specificity of 85.7%/88.1%, respectively. In addition, microRNA panels are also being identified and Zhou et al. [11], who measured a 7-microRNAs panel, also got a satisfying diagnostic achievement. With the advantages of its high stability in circulation, easily detection using PCR-based methods and better diagnostic value, microRNAs are becoming a novel and promising biomarker for early detection of HCC [9, 12].
Several meta-analyses have investigated the diagnostic value of circulating microRNAs for hepatocellular carcinoma, showing the significant value of serum/plasma microRNAs in detecting the early-stage HCC [13-16]. However, no one made a point of the HBV-associated HCC. For making a further step to evaluate the risk of HCC in patients with HBV chronic infection, we conducted a meta-analysis of all suitable researches to explore the ability of circulating microRNAs as potential biomarkers to detect the HBV-related HCC from CHB and HBV-related LC patients.
Materials and Methods
Search strategy and literature selection
This meta-analysis was conducted according to guidelines for the diagnostic meta-analysis. We systematically searched the literatures in PubMed, PMC, Web of Science, Embase and the Cochrane library without language restriction and used the following retrieval terms: “liver cancer” or “hepatocellular carcinoma” or “HCC” and “microRNA” or “miRNA” and “hepatitis b virus” or “HBV” or “chronic hepatitis” or “liver cirrhosis”. The last search was carried out on 30/11/2018.
Inclusion and exclusion criteria
Literatures that included in our meta-analysis met the following criteria : (1) all of the involved patients and controls were HBV-related; (2) the microRNAs for HBV-related HCC diagnosis were detected from serum or plasma. (3) concern the use of relevant data , such as specificity, sensitivity, group size or other sufficient information to construct a diagnostic 2×2 table. On the other side, exclusion standards were : (1) literatures were case reports, reviews, letters or comments; (2) duplicated information; and (3) the obtained microRNAs were from liver tissues, urine, cell lines or animals.
Data collection and study assessment
Two investigators selected and screened the relevant studies independently based on the title and abstract, and the full text, which was reviewed for further assessment if the study was collected by either of the investigators. We obtained the following datas from the each eligible researches : the first author's name, publication year, ethnicity, miRNA type, the number of HCC/CHB/LC patients and the revelant statistical index. The quality of included studies were assessed independently by two investigators using diagnostic accuracy studies-2 (QUADAS-2) criteria [17] , and disagreement was resolved by consulting to each other and reached a consensus.
Statistical analysis
The number of true positives, false positives, false negatives, true negatives in patients from each study was extracted. The heterogeneity was evaluated by I2 statistic. The random effects model was conducted if the I2 value was more than 50%. The potential sources of heterogeneity were explored by threshold effect analysis, regression analysis and further subgroup analysis. We then summarized the pooled sensitivity (SEN), the pooled specificity (SPE), the pooled positive likelihood ratio (PLR), the pooled negative likelihood ratio (NLR), the diagnostic odds ratio (DOR). Besides, we generated the summary receiver-operating characteristics (SROC) curve and calculated the area under the SROC curve (AUC) for both overall and the subgroup analysis. Apart from that, a Fagan's Nomogram was generated for verifying clinical utility. Finally, a Deeks' funnel plot used for detecting publication bias was constructed, and P < 0.10 indicated publication bias. All of these were performed by STATA version 12.
Results
Study selection and literature characteristics
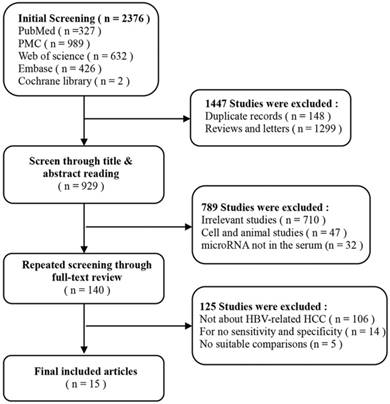
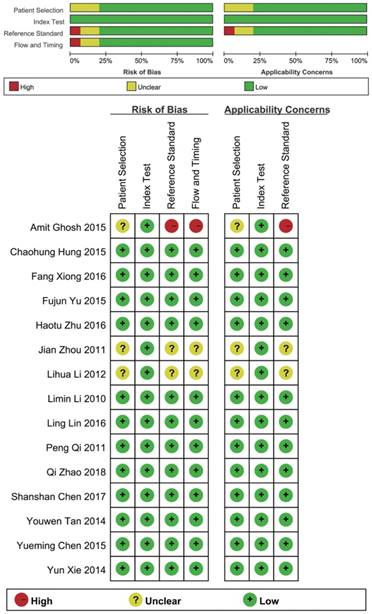
According to the literature retrieval strategy, a total of 2376 articles were acquired, of which, 327 were from Pubmed, 989 were from PMC, 426 were from Embase, 632 were from Web of Science and 2 were from Cochrane. After that, 148 duplicates, 1299 reviews and letters, 47 animal researches, 710 irrelevant studies, 106 not about HBV-related HCC, 14 articles without available diagnostic information and 37 other articles (Figure 1) were removed. Eventually, 25 studies from 15 articles [10, 11, 18-30] were included in our meta-analysis. The characteristics of the 25 studies were shown (Table 1). All together, a total of 2290 HBV-related HCC patients and 1551 HBV patients without HCC were included. In all, 20 miRNA studies concerned a single miRNA, and 5 studies focused on multiple miRNAs. Apart from that, quantitative real-time reverse transcription-PCR (qRT-PCR) was used to measure the expression of miRNAs from 21 serum specimens and 4 plasma specimens. The methodological quality assessments of the included articles according to the Quality Assessment of Diagnostic Accuracy Studies (QUADAS) were shown in a bar graph (Figure 2).
The flow chart of this systematic review and meta-analysis to identify inclusion studies.
Characteristics of the included studies
| First author | Year | Country | microRNAs | Regulation mode | Sample size | Specimen | Diagnostic power | |||||
|---|---|---|---|---|---|---|---|---|---|---|---|---|
| Case | Number | Control | Number | Sen (%) | Spe (%) | AUC | ||||||
| Zhu H | 2017 | China | miRNA clusters | Upregulated | HCC | 121 | LC | 63 | Serum | 0.785 | 0.793 | 0.859 |
| Zhao Q | 2018 | China | miR-143 | Downregulated | HCC | 85 | CHB | 50 | Serum | 0.776 | 0.860 | 0.813 |
| Zhao Q | 2018 | China | miR-145 | Downregulated | HCC | 85 | CHB | 50 | Serum | 0.882 | 0.780 | 0.852 |
| Li M | 2010 | China | miRNA clusters | Downregulated | HCC | 50 | CHB | 75 | Serum | 0.985 | 0.985 | 0.992 |
| Tan Y | 2014 | China | miRNA clusters | Upregulated | HCC | 103 | LC | 78 | Serum | 0.816 | 0.846 | 0.892 |
| Yu F | 2015 | China | miRNA-150 | Downregulated | HCC | 120 | CHB | 110 | Serum | 0.791 | 0.765 | 0.881 |
| Amit Ghosh | 2016 | Indian | miR-126 | Upregulated | HCC | 49 | CHB+LC | 38 | Plasma | 0.630 | 0.580 | 0.671 |
| Amit Ghosh | 2016 | Indian | miR-142-3p | Upregulated | HCC | 49 | CHB+LC | 38 | Plasma | 0.320 | 0.910 | 0.553 |
| Peng Qi | 2011 | China | miR-122 | Upregulated | HCC | 70 | CHB | 48 | Serum | 0.776 | 0.578 | 0.630 |
| Xie Y | 2014 | China | miR-101 | Downregulated | HCC | 67 | CHB | 79 | Serum | 0.881 | 0.620 | 0.777 |
| Chen S | 2017 | China | miR-125b | Downregulated | HCC | 64 | CHB | 63 | Serum | 0.938 | 0.857 | 0.958 |
| Chen S | 2017 | China | miR-125b | Downregulated | HCC | 64 | LC | 59 | Serum | 0.891 | 0.881 | 0.958 |
| Chen S | 2017 | China | miR-125b | Downregulated | HCC | 64 | CHB+LC | 122 | Serum | 1.000 | 0.755 | 0.943 |
| Chen Y | 2015 | China | miR-96 | Upregulated | HCC | 104 | CHB | 100 | Serum | 0.779 | 0.753 | 0.803 |
| Hung C | 2016 | China | miR-122 | Upregulated | HCC | 120 | DN | 30 | Serum | 0.667 | 0.567 | 0.648 |
| Hung C | 2016 | China | let-7b | Upregulated | HCC | 120 | DN | 30 | Serum | 0.825 | 0.467 | 0.633 |
| Lin L | 2016 | China | miR-224 | Upregulated | HCC | 122 | CHB+LC | 135 | Serum | 0.865 | 0.711 | 0.840 |
| Lin L | 2016 | China | miR-224 | Upregulated | HCC | 122 | LC | 61 | Serum | 0.865 | 0.667 | 0.832 |
| Lin L | 2016 | China | miR-224 | Upregulated | HCC | 122 | CHB | 74 | Serum | 0.865 | 0.745 | 0.846 |
| Li L | 2012 | China | miR-18a | Upregulated | HCC | 101 | CHB+LC | 30 | Serum | 0.772 | 0.700 | 0.775 |
| Xiong F | 2016 | China | miR-99a | Upregulated | HCC | 32 | CHB | 30 | Serum | 0.844 | 0.567 | 0.694 |
| Xiong F | 2016 | China | miR-125b | Downregulated | HCC | 32 | CHB | 30 | Serum | 0.906 | 0.567 | 0.703 |
| Xiong F | 2016 | China | miR-99a | Upregulated | HCC | 32 | LC | 30 | Serum | 0.967 | 0.563 | 0.696 |
| Zhou J | 2011 | China | miRNA clusters | Upregulated | HCC | 196 | CHB | 72 | Plasma | 0.791 | 0.764 | 0.842 |
| Zhou J | 2011 | China | miRNA clusters | Upregulated | HCC | 196 | LC | 56 | Plasma | 0.750 | 0.911 | 0.884 |
HCC: Hepatocellular carcinoma, LC: Liver cirrhosis, CHB: Chronic hepatitis B, DN: Dysplastic nodule, Sen: Sensitivity, Spe: Specificity, AUC: area under the curve.
Overall methodology quality assessment of included articles using the QUADAS criteria.
Threshold effect
By matching the ROC curve, using the logarithm of sensitivity and the logarithm of (1 - specificity) to calculate the Spearman correlation coefficient, the threshold effect was assessed. The results showed the shape of the ROC curve not like arm and shoulder shaped distribution. The Spearman correlation coefficient in total across the 15 studies was 0.000 (P = 0.999), which indicated no threshold effect.
Diagnostic value of circulating microRNAs in HBV-related HCC patients
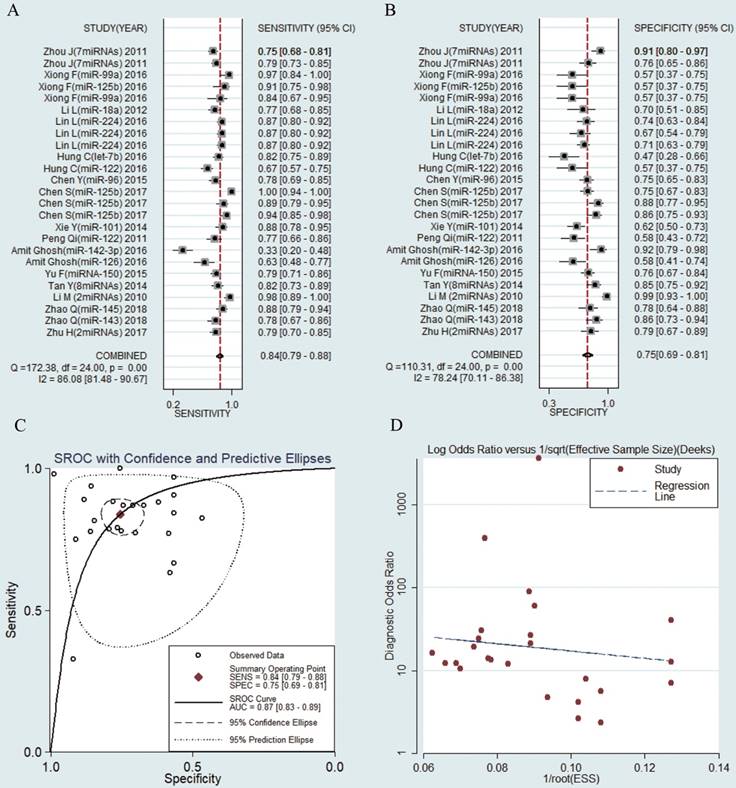
The sensitivities and specificities of the 25 microRNAs in the peripheral blood circulation of HBV-related HCC patients were analyzed by using forest plots. Significant heterogeneity existed among the studies from the data of diagnostic odds ratio (DOR) (I2 = 100%) (Fig. 3), and therefore, the random effects model was selected in our meta-analysis. The pooled results were displayed as follow: sensitivity, 0.84 (95% CI: 0.79-0.88) (Fig. 3a), specificity, 0.75 (95% CI: 0.69-0.81) (Fig. 3b), AUC was 0.87 (95% CI: 0.83-0.89) (Fig. 3c), NLR, 0.21 (95% CI: 0.16-0.29) (Fig. S1a), PLR, 3.42 (95% CI: 2.68-4.35) (Fig. S1b) and DOR, 15.99 (95% CI: 9.89-25.83) (Fig. S1c) (Table 2). The results manifested that circulating microRNAs had a high diagnostic accuracy.
Forest plots of sensitivity, specificity, area under the curve (AUC) and funnel plot of circulating miRNAs for diagnosing HBV-related HCC among 25 studies. (A) Sensitivity; (B) Specificity; (C) AUC; (D) Funnel plot.
The meta-regression analysis in the binary classification of variable data using the odds ratio (OR)
| LogOR | Coef. | Std. Err. | t | P>|t| | [95% Conf. Interval] | |
|---|---|---|---|---|---|---|
| Regulation mode | -1.302928 | 0.492039 | -2.65 | 0.016 | -2.336663 | -0.2691922 |
| miRNA profiling | 1.869125 | 0.7728873 | 2.42 | 0.026 | 0.2453491 | 3.492901 |
| Sample size | -0.9457466 | 0.841248 | -1.12 | 0.276 | -2.713143 | 0.8216499 |
| Internal reference types | 0.7083823 | 0.525466 | 1.35 | 0.194 | -0.3955807 | 1.812345 |
| Specimen types | 0.5501442 | 0.8642539 | 0.64 | 0.532 | -1.265586 | 2.365874 |
| Ethnicity | 1.472494 | 1.404431 | 1.05 | 0.308 | -1.478106 | 4.423094 |
| Control-CHB | 1.596359 | 0.7393835 | 2.16 | 0.043 | 0.0587269 | 3.133991 |
| Control-LC | 1.99139 | 0.7978941 | 2.50 | 0.021 | 0.332078 | 3.650701 |
| Control-CHB+LC | 0.9694282 | 0.8318447 | 1.17 | 0.257 | -0.7604876 | 2.699344 |
LogOR was used as response variables as well as regulation modes, miRNA profiling, sample size, internal reference types, specimen types, ethnicity, and source of controls group were as covariates. Estimate of between-study variance tau2 = 0.6265. Residual variation due to heterogeneity: I-squared_res = 66.64%. Proportion of between-study variance explained: Adj R-squared = 47.42%. Joint test for all covariates with Knapp-Hartung modifcation: Prob > F = 0.0712.
Diagnostic value of AFP in HBV-related HCC patients
In all of these studies, 9 studies analyzed the diagnostic value of AFP in HBV-related HCC patients. Meta-analysis was taken by using a random effect model (I2 > 50%). The pooled results were displayed as follow: sensitivity, 0.68 (95% CI: 0.62-0.73), specificity, 0.76 (95% CI: 0.61-0.86) , PLR, 2.78 (95% CI: 1.69-4.56), NLR, 0.43 (95% CI: 0.35-0.52), DOR, 6.53 (95% CI: 3.37-12.65) and AUC was 0.73 (95% CI: 0.69-0.77) (Figure S2). The results showed that circulating microRNAs had a better diagnostic accuracy than AFP.
Diagnostic value of miR-125b in HBV-related HCC patients
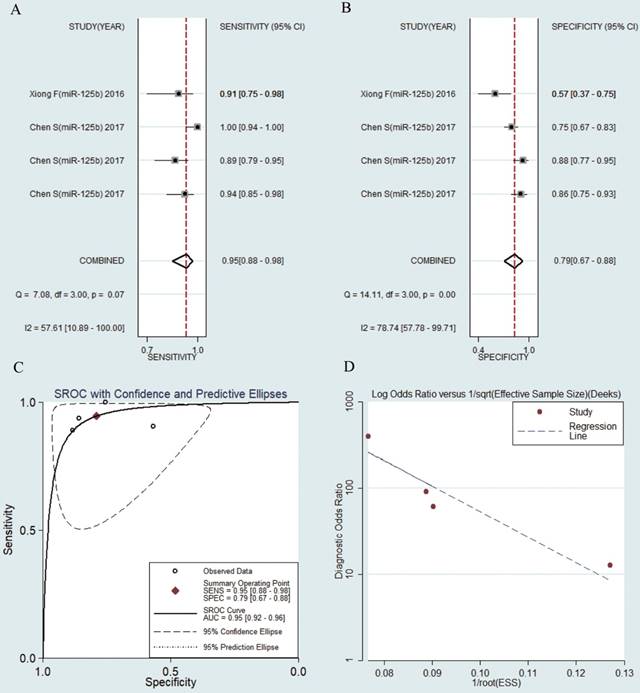
MiR-125b were reported in 4 studies of collected researches. The pooled sensitivity was 0.95 (95% CI: 0.88-0.98) (Fig. 4a). The pooled specificity was 0.79 (95% CI: 0.67-0.88) (Fig. 4b), AUC was 0.95 (95% CI: 0.92-0.96) (Fig. 4c), the pooled NLR was 0.07 (95% CI: 0.03-0.16) (Fig. S3a), the pooled PLR was 4.50 (95% CI: 2.76-7.33) (Fig. S3b) and the pooled DOR was 65.58 (95% CI: 24.33-176.77) (Fig. S3c).
Forest plots of sensitivity, specificity, area under the curve (AUC) and funnel plot of circulating miR-125b for diagnosing HBV-related HCC among 4 studies. (A) Sensitivity; (B) Specificity; (C) AUC; (D) Funnel plot.
Meta-regression analysis
To find probable sources of heterogeneity, we used logOR as the dependent variable. Regulation mode, miRNA profiling, sample size, internal reference types, specimen types, ethnicity and control groups were considered as covariates (Table 2). The result of I-squared-res value was 66.64%, manifesting the heterogeneity could be explained by 66.64% of the residual variation. The adjusted R-squared was 47.42%, which could explain the variation among the studies; this variation, might be related to the regulation mode (P = 0.016), miRNA profiling (P = 0.026), CHB control group (P = 0.043) and LC control group (P = 0.021). Besides, the variation was not related to sample size (P = 0.276), internal reference types (P = 0.194), specimen types (P = 0.532), ethnicity (P = 0.308) and CHB and LC control group (P = 0.257). Given that, we conducted subgroup analyses.
Subgroup analysis
Subgroup analyses were conducted according to regulation mode, source of control, miRNA profiling, sample size, internal reference types, and specimen types. The pooled sensitivity, specificity, PLR, NLR, DOR and AUC for each subgroup analysis were listed in Table 3. We found that down-regulated miRNAs assays had a better diagnostic value than up-regulated miRNAs assays in the diagnosis of HBV-HCC: sensitivity (0.91 vs. 0.79), specificity (0.82 vs. 0.72), PLR (4.95 vs. 2.81), NLR (0.11 vs. 0.29), DOR (45.13 vs. 9.59) and AUC (0.94 vs. 0.82). Besides, the assay using multiple miRNAs exhibited a better diagnostic value than single miRNA: sensitivity (0.89 vs. 0.84), specificity (0.84 vs. 0.71), PLR (7.41 vs. 2.94), NLR (0.18 vs. 0.22), DOR (40.22 vs. 13.12) and AUC (0.92 vs. 0.83). Apart from that, the studies with sample size more than 100 were significantly greater than the studies with sample size less than 100 in the diagnosis of HCC in HBV patients: sensitivity (0.84 vs. 0.79), specificity (0.77 vs. 0.65), PLR (3.70 vs. 2.28), NLR (0.20 vs. 0.33), DOR (25.90 vs. 6.96) and AUC (0.88 vs. 0.76). In addition, Serum types had also a higher diagnostic value than plasma types: sensitivity (0.86 vs. 0.65), specificity (0.74 vs. 0.82), PLR (3.32 vs. 3.69), NLR (0.19 vs. 0.43), DOR (17.46 vs. 8.61) and AUC (0.88 vs. 0.81). Internal reference types in qRT-PCR had no influence on the diagnosis (Table 3).
Summary estimates of diagnostic power and their 95% confidence intervals
| Subgroup | Sensitivity (95% CI) | Specificity (95% CI) | Positive LR (95% CI) | Negative LR (95% CI) | DOR (95% CI) | AUC (95% CI) | |
|---|---|---|---|---|---|---|---|
| Regulation mode | |||||||
| Upregulated | 16 | 0.79 [0.73-0.84] | 0.72 [0.65-0.78] | 2.81 [2.26-3.50] | 0.29 [0.23-0.38] | 9.59 [6.62-13.88] | 0.82 [0.78-0.85] |
| Downregulated | 9 | 0.91 [0.84-0.95] | 0.82 [0.71-0.89] | 4.95 [2.98-8.22] | 0.11 [0.06-0.20] | 45.13 [16.81-121.14] | 0.94 [0.91-0.95] |
| Source of control | |||||||
| Chronic hepatitis B | 12 | 0.85 [0.80-0.89] | 0.77 [0.67-0.84] | 3.66 [2.46-5.45] | 0.19 [0.13-0.28] | 18.85 [9.09-39.10] | 0.89 [0.86-0.91] |
| Liver cirrhosis | 6 | 0.84 [0.78-0.89] | 0.80 [0.69-0.87] | 4.16 [2.75-6.27] | 0.20 [0.16-0.27] | 20.47 [13.52-30.98] | 0.89 [0.86-0.91] |
| miRNA profiling | |||||||
| Multiple miRNAs | 5 | 0.89 [0.75-0.95] | 0.84 [0.72-0.91] | 7.41 [2.90-18.94] | 0.18 [0.10-0.36] | 40.22 [8.63-187.51] | 0.92 [0.90-0.94] |
| Single miRNA | 20 | 0.84 [0.78-0.89] | 0.71 [0.66-0.77] | 2.94 [2.42-3.57] | 0.22 [0.16-0.32] | 13.12 [8.18-21.05] | 0.83 [0.79-0.86] |
| Sample size | |||||||
| ≥100 | 20 | 0.84 [0.80-0.88] | 0.77 [0.71-0.82] | 3.70 [2.82-4.86] | 0.20 [0.15-0.27] | 25.90 [11.07-30.46] | 0.88 [0.85-0.91] |
| <100 | 5 | 0.79 [0.53-0.92] | 0.65 [0.49-0.79] | 2.28 [1.67-3.11] | 0.33 [0.15-0.72] | 6.96 [2.98-16.27] | 0.76 [0.72-0.79] |
| Internal reference types in qRT-PCR | |||||||
| U6 | 13 | 0.83 [0.73-0.90] | 0.75 [0.68-0.81] | 3.32 [2.49-4.43] | 0.22 [0.13-0.37] | 14.90 [7.41-29.96] | 0.84 [0.81-0.87] |
| Non-U6 | 12 | 0.83 [0.78-0.87] | 0.76 [0.66-0.84] | 3.49 [2.33-5.24] | 0.22 [0.16-0.30] | 15.74 [8.29-29.90] | 0.87 [0.84-0.90] |
| Specimen types | |||||||
| Serum | 21 | 0.86 [0.82-0.89] | 0.74 [0.68-0.80] | 3.32 [2.57-4.29] | 0.19 [0.14-0.26] | 17.46 [10.44-29.19] | 0.88 [0.85-0.91] |
| Plasma | 4 | 0.65 [0.46-0.80] | 0.82 [0.66-0.92] | 3.69 [1.83-7.43] | 0.43 [0.27-0.69] | 8.61 [3.24-22.86] | 0.81 [0.77-0.84] |
| Total | 25 | 0.84 [0.79-0.88] | 0.75 [0.69-0.81] | 3.42 [2.68-4.35] | 0.21 [0.16-0.29] | 15.99 [9.89-25.83] | 0.87 [0.83-0.89] |
LR: likelihood ratio, DOR: diagnostic odds ratio, AUC: area under the curve, CI: confidence interval.
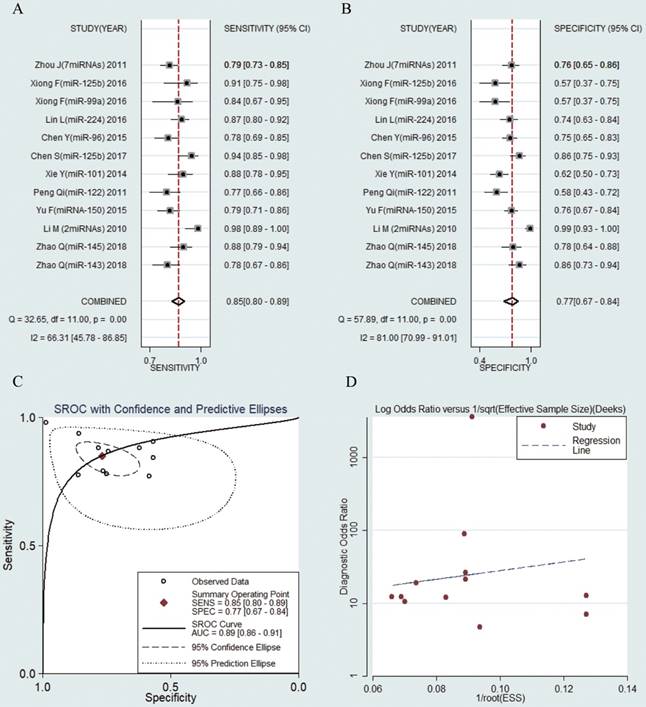
12 studies including 1027 HBV-related HCC patients and 782 CHB patients were analyzed separately. The pooled results were displayed as follows: sensitivity, 0.85 (95% CI: 0.80-0.89) (Fig. 5a), specificity, 0.77 (95% CI: 0.67-0.84) (Fig. 5b), AUC was 0.89 (95% CI: 0.86-0.91) (Fig. 5c), NLR, 0.19 (95% CI: 0.13-0.28) (Fig. S4a), PLR, 3.66 (95% CI: 2.46-5.45) (Fig. S4b) and DOR, 18.85 (95% CI: 9.09-39.10) (Fig. S4c). The results showed that circulating microRNAs had a great diagnostic accuracy for HCC in CHB patients.
Forest plots of sensitivity, specificity, area under the curve (AUC) and funnel plot of circulating miRNAs for diagnosing HBV-related HCC in patients with chronic hepatitis B among 12 studies. (A) Sensitivity; (B) Specificity; (C) AUC; (D) Funnel plot.
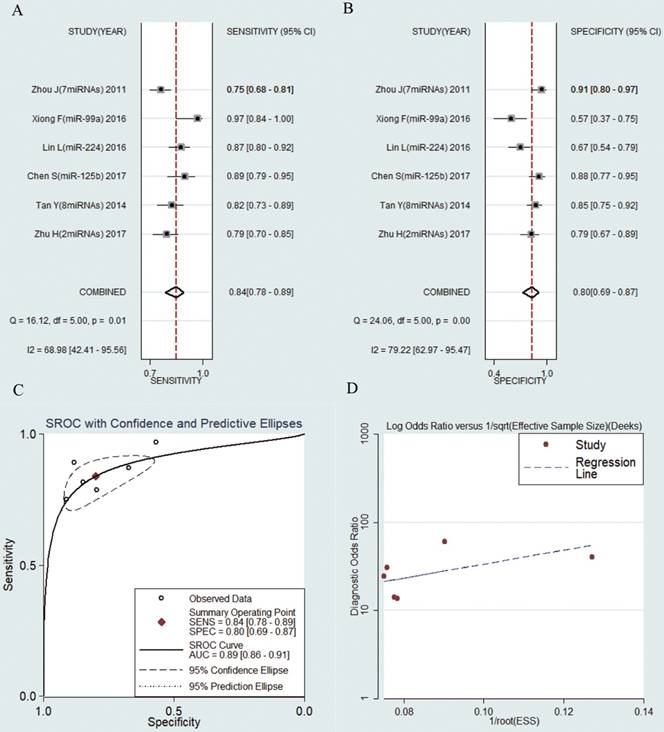
6 studies including 638 HBV-related HCC patients and 347 LC patients were analyzed separately. The pooled results were displayed as follows: sensitivity, 0.84 (95% CI: 0.78-0.89) (Fig. 6a), specificity, 0.80 (95% CI: 0.69-0.87) (Fig. 6b), AUC was 0.89 (95% CI: 0.86-0.91) (Fig. 6c), NLR, 0.20 (95% CI: 0.16-0.27) (Fig. S5a), PLR, 4.16 (95% CI: 2.75-6.27) (Fig. S5b) and DOR, 20.47 (95% CI: 13.52-30.98) (Fig. S5c). The results manifested that circulating microRNAs also had a high diagnostic accuracy for HCC in LC patients.
Forest plots of sensitivity, specificity, area under the curve (AUC) and funnel plot of circulating miRNAs for diagnosing HBV-related HCC in patients with liver cirrhosis among 6 studies. (A) Sensitivity; (B) Specificity; (C) AUC; (D) Funnel plot.
Publication bias
The publication bias of the included studies was checked by Deeks' funnel plot test. The pooled Deeks' test result of all studies was t = -0.56, P = 0.582 (Fig. 3d), which demonstrated no significant publication bias in this analysis. In additional, when CHB individuals were used as controls, the pooled Deeks' test result was t = 0.45, P = 0. 661 (Fig. 4d), and when LC individuals were used as controls, the pooled Deeks' test result was t = 1.07, P = 0.344 (Fig. 5d), which all indicating no publication bias. As for studies conducting index of AFP, the pooled Deeks' test result was t = 3.74, P = 0. 0007 (Fig. 6d), showing significant publication bias.
Clinical utility of index test
Fagan's Nomogram is used for calculating post-test probabilities. As was shown in Figure S1d, it was found that when the pre-test probability was set at 20%, the post-test probability arrived at 46% accompanied by a PLR of 3, and the post-test probability arrived at 5% accompanied by a NLR of 0.21.
Discussions
Hepatits B virus infection remains an outstanding problem and the leading risk factor for hepatocellular carcinoma. It is known that HCC is the leading cause of cancer-associated death and most of patients are diagnosed at advanced stage upon disease discovery. As it would be too late for the optimal treatment when the physiological consequences of cancer were observed, it is crucial for the early detection of HCC to improve patient survival [31]. Liver biopsy, the gold procedure for the diagnosis and stage assessment of HCC, is difficult to implement for various complications and impractical to perform frequently. Imaging technologies, such as ultrosound and computed tomography, are limited in identify the severity degree of inflammation and hepatocellular injury. Fortunately, with the increasing development of sequencing technologies and tested approches about liver diseases, a growing number of novel tools with diagnostic function are emerging. Liquid biopsy, which is defined as non-invasive reliable biomarkers, is becoming a hot spot of recently researches. Circulating extracellular vesicles, Cell-free DNA (cfDNA) , Cell-free non-coding RNA (cfRNA) and tumour cells are the promising and potential liquid biopsy possibles as they are performed with satisfying diagnostic and prognostic value[32]. Significantly, microRNAs, the most studied types of cfRNA, have already been confirmed that play a key role in numerous cell activities of hepatocytes. Circulating microRNAs have been widely and continuously studied in HCC in recent years and multiple researches have shown the high sensitivity and specificity of microRNAs in distinguishing HBV-HCC from HBV patients without HCC. To evaluate the practicability and utility of microRNAs as a circulating biomarker in HBV-HCC, we conducted this meta-analysis to provide a comprehensive and up-to-date analysis.
Totally, we included 25 studies from 15 articles with 3841 subjects (2290 HBV-related HCC patients and 1551 HBV patients without HCC) and each study showed acceptable or satisfied sensitivity and specificity. In this meta-analysis, the pooled sensitivity was 0.84 (95% CI: 0.79-0.88) and the pooled specificity was 0.75 (95% CI: 0.69-0.81), showing a significant diagnostic effect in HBV-HCC patients. We also drew the SROC curve and obtained the corresponding AUC to assess the overall diagnostic accuracy, with the ideal result of 0.87 in AUC value, meaning that microRNAs reached the moderate level and almost the high level of evaluation criteria in diagnosis [33], and showing a better diagnostic performance than AFP (AUC, 0.73). We also used the PLR, NLR and DOR to further test the discrimination ability of microRNAs, which can provide more meaningful references for clinical usage. In our meta-analysis, the total DOR, the pooled PLR and NLR were 15.99, 3.42 and 0.41 respectively, indicating that the chance of a correct diagnosis of HBV-HCC individuals was 16 times higher than a false-negative diagnosis of non-HCC but HBV infected patients. However, the PLR is lower than 10 and the NLR is not less than 0.1, which did not reach the general criterion in ruling in or ruling out decision [34].
In this study, we conducted a meta-regression to detect the effection of the regulation mode, miRNA profiling, sample size, internal reference types, specimen types, ethnicity and control groups. The result revealed that regulation mode , miRNA profiling, CHB control group and LC control group were as potential sources of heterogeneity. Furthermore, we measured a subgroup analysis and interestingly, we found that down-regulated miRNAs assays have a better diagnostic value than up-regulated miRNAs assays (DOR, 45.13 vs. 9.59; AUC, 0.94 vs. 0.82), the assay using multiple microRNA showed better diagnostic value than single miRNA (DOR, 40.2 vs 13.1; AUC, 0.92 vs. 0.83), bigger sample size exhibited better diagnostic value than sample size less than 100 (DOR, 25.90 vs. 6.96; AUC, 0.88 vs. 0.76), serum type had better diagnostic value than plasma type (DOR, 17.46 vs. 8.61; AUC, 0.88 vs. 0.81 ). Given that, we may draw a conclusion that down-regulated microRNA panel in serum type and test in bigger size sample can perform the best diagnostic function from HBV-HCC. Curiously, it has been reported that plasma perhaps retain more proteins for co-fractionating miRNAs and should have more clinical applications which were contrary to our study [35], more studies are needed to define which circulating type is the best biological marker sample. Moreover, no obvious diagnostic difference was found in CHB and LC groups and concequently, it may conclude that circulating miRNAs were of high value to diagnose HBV-related HCC in different stages of HBV infected patients.
In our study, the downregulated circulating miR-125b showed a significant diagnostic achievement. It has already been reported that downregulation of miR-125b were associated with cell proliferation by enabling the hepatocytes to exist under conditions of low nutrition and therapy of chemotherapy [36]. More specifically, miR-125b can inhibit the tumorigenesis through targeting Mcl-1 and IL-6R, which acted important roles in apoptosis and immune response [36-38]. In the genic aspect, oncogene LIN28B were directly targeted by miR-125b and ultimately, suppressed HCC cellular differentiation and metastasis [37-39]. Bcl-2, an anti-apoptotic gene, can affect hepatocarcinogenesis and chemoresistance as its subsequent up-regulation of expression [38]. It is noteworthy that a recent study showed the therapeutic value of man-made miR-125b mimics through decreasing the target molecule of cancer stem cell (CSC) using the HCC xenograft model in mice [40] and it may provide a promising way to cure HCC.
This meta-analysis may have some limitations: (1) although we performed the extensive literature search, some related studies may still omitted and not included in this meta-analysis. (2) research sizes were relatively small and consequently, our findings need to be further confirmed. (3) due to researches' limited data and different criteria, we did not extract cut-off values, different cut-off values may result in the inconsistent conclusions. (4) all of the included studied were from Asia and mostly from China.
In conclusion, despite these deficiencies, our meta-analysis demonstrated that microRNAs could distinguish the HBV-related HCC from HBV patients without HCC with high sensitivity and specificity and may serve as promising circulating biomarkers in the early diagnosis in HBV-HCC.
Abbreviations
miRNAs: MicroRNAs; SEN: Sensitivity; SPE: Specificity; PLR: Positive likelihood ratio; NLR: Negative likelihood ratio; SROC: Summary receiver- operating characteristics; AUC: Area under the Curve of ROC; DOR: Diagnostic odds ratio; CI: confidence interval; qRT-PCR: Quantitative reverse transcription polymerase chain reaction; HCC: Hepatocellular carcinoma; LC: Liver cirrhosis; CHB: Chronic hepatitis B; AFP: Alpha fetoprotein.
Supplementary Material
Supplementary figures and tables.
Acknowledgements
This study was funded by Public Welfare Technology Research Project of Zhejiang Province in China (Project No: LGF18H310002).
Author Contributions
YQ is acting as the submission's guarantor. YQ conceived the experiments and critically revised the manuscript; XJ and CC performed the study, analyzed the data and wrote the manuscript. All authors read and approved the final manuscript.
Competing Interests
The authors have declared that no competing interest exists.
References
1. Bray F, Ferlay J, Soerjomataram I, Siegel RL, Torre LA, Jemal A. Global cancer statistics 2018: GLOBOCAN estimates of incidence and mortality worldwide for 36 cancers in 185 countries. CA: a cancer journal for clinicians. 2018;68:394-424
2. Fitzmorris P, Shoreibah M, Anand BS, Singal AK. Management of hepatocellular carcinoma. J Cancer Res Clin Oncol. 2015;141:861-76
3. Sturgeon CM, Duffy MJ, Hofmann BR, Lamerz R, Fritsche HA, Gaarenstroom K. et al. National Academy of Clinical Biochemistry Laboratory Medicine Practice Guidelines for use of tumor markers in liver, bladder, cervical, and gastric cancers. Clinical chemistry. 2010;56:e1-48
4. Gupta S, Bent S, Kohlwes J. Test characteristics of alpha-fetoprotein for detecting hepatocellular carcinoma in patients with hepatitis C. A systematic review and critical analysis. Annals of internal medicine. 2003;139:46-50
5. Tsuchiya N, Sawada Y, Endo I, Saito K, Uemura Y, Nakatsura T. Biomarkers for the early diagnosis of hepatocellular carcinoma. World journal of gastroenterology. 2015;21:10573-83
6. Kim VN. MicroRNA biogenesis: coordinated cropping and dicing. Nature reviews Molecular cell biology. 2005;6:376-85
7. Schwarzenbach H, Nishida N, Calin GA, Pantel K. Clinical relevance of circulating cell-free microRNAs in cancer. Nature reviews Clinical oncology. 2014;11:145-56
8. A C. MicroRNAs: new tools for diagnosis, prognosis, and therapy in hepatocellular carcinoma?%A Giordano S. Hepatology (Baltimore, Md). 2013;57:840-7
9. GA C, G L-B, AK S. miRNA Deregulation in Cancer Cells and the Tumor Microenvironment.%A Rupaimoole R. Cancer discovery. 2016;6:235-46
10. Chen S, Chen H, Gao S, Qiu S, Zhou H, Yu M. et al. Differential expression of plasma microRNA-125b in hepatitis B virus-related liver diseases and diagnostic potential for hepatitis B virus-induced hepatocellular carcinoma. Hepatology research: the official journal of the Japan Society of Hepatology. 2017;47:312-20
11. Zhou J, Yu L, Gao X, Hu J, Wang JP, Dai Z. et al. Plasma MicroRNA Panel to Diagnose Hepatitis B Virus-Related Hepatocellular Carcinoma. Journal of Clinical Oncology. 2011;29:4781-8
12. CM C. MicroRNA dysregulation in cancer: diagnostics, monitoring and therapeutics. A comprehensive review.%A Iorio MV. EMBO molecular medicine. 2012;4:143-59
13. Yang Y, Zhu R. Diagnostic value of circulating microRNAs for hepatocellular carcinoma. Molecular biology reports. 2014;41:6919-29
14. Ding Y, Yan JL, Fang AN, Zhou WF, Huang L. Circulating miRNAs as novel diagnostic biomarkers in hepatocellular carcinoma detection: a meta-analysis based on 24 articles. Oncotarget. 2017;8:66402-13
15. Huang JT, Liu SM, Ma H, Yang Y, Zhang X, Sun H. et al. Systematic Review and Meta-Analysis: Circulating miRNAs for Diagnosis of Hepatocellular Carcinoma. J Cell Physiol. 2016;231:328-35
16. Liao Q, Han P, Huang Y, Wu Z, Chen Q, Li S. et al. Potential Role of Circulating microRNA-21 for Hepatocellular Carcinoma Diagnosis: A Meta-Analysis. PloS one. 2015;10:e0130677
17. Whiting PF, Rutjes AW, Westwood ME, Mallett S, Deeks JJ, Reitsma JB. et al. QUADAS-2: a revised tool for the quality assessment of diagnostic accuracy studies. Annals of internal medicine. 2011;155:529-36
18. Zhu HT, Liu RB, Liang YY, Hasan AME, Wang HY, Shao Q. et al. Serum microRNA profiles as diagnostic biomarkers for HBV-positive hepatocellular carcinoma. Liver international: official journal of the International Association for the Study of the Liver. 2017;37:888-96
19. Zhao Q, Sun X, Liu C, Li T, Cui J, Qin C. Expression of the microRNA-143/145 cluster is decreased in hepatitis B virus-associated hepatocellular carcinoma and may serve as a biomarker for tumorigenesis in patients with chronic hepatitis B. Oncology letters. 2018;15:6115-22
20. Li LM, Hu ZB, Zhou ZX, Chen X, Liu FY, Zhang JF. et al. Serum microRNA profiles serve as novel biomarkers for HBV infection and diagnosis of HBV-positive hepatocarcinoma. Cancer research. 2010;70:9798-807
21. Tan Y, Ge G, Pan T, Wen D, Chen L, Yu X. et al. A serum microRNA panel as potential biomarkers for hepatocellular carcinoma related with hepatitis B virus. PloS one. 2014;9:e107986
22. Yu F, Lu Z, Chen B, Dong P, Zheng J. microRNA-150: a promising novel biomarker for hepatitis B virus-related hepatocellular carcinoma. Diagnostic pathology. 2015;10:129
23. Ghosh A, Ghosh A, Datta S, Dasgupta D, Das S, Ray S. et al. Hepatic miR-126 is a potential plasma biomarker for detection of hepatitis B virus infected hepatocellular carcinoma. International journal of cancer. 2016;138:2732-44
24. Qi P, Cheng SQ, Wang H, Li N, Chen YF, Gao CF. Serum microRNAs as biomarkers for hepatocellular carcinoma in Chinese patients with chronic hepatitis B virus infection. PloS one. 2011;6:e28486
25. Xie Y, Yao Q, Butt AM, Guo J, Tian Z, Bao X. et al. Expression profiling of serum microRNA-101 in HBV-associated chronic hepatitis, liver cirrhosis, and hepatocellular carcinoma. Cancer biology & therapy. 2014;15:1248-55
26. Chen Y, Dong X, Yu D, Wang X. Serum miR-96 is a promising biomarker for hepatocellular carcinoma in patients with chronic hepatitis B virus infection. International journal of clinical and experimental medicine. 2015;8:18462-8
27. Hung CH, Hu TH, Lu SN, Kuo FY, Chen CH, Wang JH. et al. Circulating microRNAs as biomarkers for diagnosis of early hepatocellular carcinoma associated with hepatitis B virus. International journal of cancer. 2016;138:714-20
28. Lin L, Lu B, Yu J, Liu W, Zhou A. Serum miR-224 as a biomarker for detection of hepatocellular carcinoma at early stage. Clinics and research in hepatology and gastroenterology. 2016;40:397-404
29. Li L, Guo Z, Wang J, Mao Y, Gao Q. Serum miR-18a: a potential marker for hepatitis B virus-related hepatocellular carcinoma screening. Digestive diseases and sciences. 2012;57:2910-6
30. Xiong F, Ma H, Qu YC, Wen F, Bao XL, Han DZ. et al. Profiles of serum miR-99a, let-7c and miR-125b in hepatitis B virus (HBV)-associated chronic hepatitis, liver cirrhosis and hepatocellular carcinoma. International journal of clinical and experimental pathology. 2016;9:7087-95
31. Bettegowda C, Sausen M, Leary RJ, Kinde I, Wang Y, Agrawal N. et al. Detection of circulating tumor DNA in early- and late-stage human malignancies. Science translational medicine. 2014;6:224ra24
32. Mann J, Reeves HL, Feldstein AE. Liquid biopsy for liver diseases. Gut. 2018;67:2204-12
33. Swets JA. Measuring the accuracy of diagnostic systems. Science (New York, NY). 1988;240:1285-93
34. Deeks JJ, Altman DG. Diagnostic tests 4: likelihood ratios. BMJ (Clinical research ed). 2004;329:168-9
35. Arroyo JD, Chevillet JR, Kroh EM, Ruf IK, Pritchard CC, Gibson DF. et al. Argonaute2 complexes carry a population of circulating microRNAs independent of vesicles in human plasma. Proc Natl Acad Sci U S A. 2011;108:5003-8
36. Gong J, Zhang JP, Li B, Zeng C, You K, Chen MX. et al. MicroRNA-125b promotes apoptosis by regulating the expression of Mcl-1, Bcl-w and IL-6R. Oncogene. 2013;32:3071-9
37. Jia HY, Wang YX, Yan WT, Li HY, Tian YZ, Wang SM. et al. MicroRNA-125b functions as a tumor suppressor in hepatocellular carcinoma cells. International journal of molecular sciences. 2012;13:8762-74
38. Zhao A, Zeng Q, Xie X, Zhou J, Yue W, Li Y. et al. MicroRNA-125b induces cancer cell apoptosis through suppression of Bcl-2 expression. Journal of genetics and genomics = Yi chuan xue bao. 2012;39:29-35
39. Liang L, Wong CM, Ying Q, Fan DN, Huang S, Ding J. et al. MicroRNA-125b suppressesed human liver cancer cell proliferation and metastasis by directly targeting oncogene LIN28B2. Hepatology (Baltimore, Md). 2010;52:1731-40
40. Zhou JN, Zeng Q, Wang HY, Zhang B, Li ST, Nan X. et al. MicroRNA-125b attenuates epithelial-mesenchymal transitions and targets stem-like liver cancer cells through small mothers against decapentaplegic 2 and 4. Hepatology (Baltimore, Md). 2015;62:801-15
Author contact
![]() Corresponding author: Prof. Yunqing Qiu, State Key Laboratory for Diagnosis and Treatment of Infectious Disease, Collaborative Innovation Center for Diagnosis and Treatment of Infectious Diseases, Zhejiang Provincial Key Laboratory for Drug Clinical Research and Evaluation, The First Affiliated Hospital, Zhejiang University, 79 QingChun Road, Hangzhou, Zhejiang 310000, People's Republic of China. Email: qiuyqedu.cn; Fax:86-0571-87236606; Tel: 86-0571-87236606.
Corresponding author: Prof. Yunqing Qiu, State Key Laboratory for Diagnosis and Treatment of Infectious Disease, Collaborative Innovation Center for Diagnosis and Treatment of Infectious Diseases, Zhejiang Provincial Key Laboratory for Drug Clinical Research and Evaluation, The First Affiliated Hospital, Zhejiang University, 79 QingChun Road, Hangzhou, Zhejiang 310000, People's Republic of China. Email: qiuyqedu.cn; Fax:86-0571-87236606; Tel: 86-0571-87236606.