Impact Factor ISSN: 1837-9664

 Global reach, higher impact
J Cancer 2019; 10(15):3397-3406. doi:10.7150/jca.31231 This issue Cite
Research Paper
Adjustment of Microvessel Area by Stromal Area to Improve Survival Prediction in Non-Small Cell Lung Cancer
Luo Fang1*, Ying He2*, Yujia Liu2*, Haiying Ding2, Yinghui Tong2, Luying Hu2, Canming Wang3, Yiwen Zhang2, Xiaowei Zheng2, Ping Huang2 ![]()
1. Department of Pharmacy, Children's Hospital, Zhejiang University School of Medicine, Hangzhou, Zhejiang Province, China
2. Department of Pharmacy, Zhejiang Cancer Hospital, Hangzhou, Zhejiang Province, China
3. Department of Pathology, Zhejiang Cancer Hospital, Hangzhou, Zhejiang Province, China
*L. Fang, Y. He and Y.J. Liu contributed equally to this work.
Received 2018-11-4; Accepted 2019-4-30; Published 2019-6-9
Abstract
Background: Sustained tumor growth and metastasis require sufficient blood supply, and microvessel area (MVA) has been reported that is related to prognosis of cancer patients. However, tumor cells may not be nourished enough by blood vessels when the cells are separated from vessels by thick stroma. Therefore we investigated whether stroma-area normalized MVA (SnMVA) is a more important prognostic factor than MVA.
Materials and Methods: 100 NSCLC patients who underwent resection between July 2011 and October 2012 were randomly selected. We determined the MVA of the tumor tissues by anti-CD31 immunostaining of microvessels. Stroma-area normalized MVA (SnMVA) was a ratio of MVA to stromal area. Correlation of MVA and SnMVA with overall survival (OS) or progression-free survival (PFS) was assessed using multivariate analysis.
Results: Median MVA was 0.0228 (range, 0.00393 to 0.172), and median SnMVA was 0.0441 × 10⁻⁶ (range, 0.00393 × 10⁻⁶ to 0.259 × 10⁻⁶). There was no significant difference in OS between groups of different MVA (HR 0.58, 95%CI 0.28 to 1.19, p = 0.148). In contrast, the risk of death was significantly decreased in high SnMVA group (at or below the median) than in group with low SnMVA (HR 0.47, 95%CI 0.23 to 0.97, p = 0.046). Furthermore, in multivariate analysis, high SnMVA, but not MVA, was an independent prognostic factor after adjusting for age, sex, tumor stage and other factors. OS was significantly associated with SnMVA in six of seven subgroup analysis, but with MVA in only three.
Conclusions: Our study showed that the NSCLC patients with high SnMVA had higher OS. And SnMVA is a prognostic factor with greater accuracy than MVA. Since stroma exists widely in a variety of cancer tissues, we infer that SnMVA may also predict the prognostic of other types of cancers.
Keywords: microvessel area, stromal area, non-small cell lung cancer, prognostic marker, stroma-area normalized mva
Introduction
Blood-supply plays a key role in solid tumors developing [1]. Since the 1970s, an increasing number of perfusion-based parameters have been exploited as potential markers capable of predicting prognosis of cancer patients. One of the best studied is microvessel area (MVA), which reflects vascular intensity, area of the endothelial lumen and blood volume available for intratumor perfusion [2, 3]. However, studies in different types of solid tumor have shown an inverse relationship between MVA and survival [3, 4], a direct relationship [5] or no significant relationship [6, 7]. The reasons counted for these paradoxical finding is not fully clear. One explanation for this discrepancy should be addressed is that extremely poor blood-perfusion ultimately promotes tumor development via hypoxia induced migration, metastasis, and chemotherapy/radiation-therapy resistance [8]. Moreover, the efficiency of blood supply in tumor is not only decided by vascular quantity but also other microenvironment profiles, such as dense stroma. Even when vascularization is dense, tumor cells may not obtain the oxygen and nutrients they need if they lie too far from blood vessels [9, 10]. It was suggested that quantity of vascular vessels was unable to accurately represent the efficiency of blood-supply, thus a more comprehensive factor is necessary.
In desmoplastic tumors, cancer niches often lie far from vasculature, separated from the vessels by stroma [11, 12]. This stroma can be quite thick, characterized by excessive deposition of extracellular matrix and less porous components including collagen, fibronectin, and laminins [13]. Stiff stroma impairs perfusion of tumor tissue by compressing vessels, increasing interstitial fluid pressure, and lengthening transport distance [9, 13, 14]. Therefore stroma should be taken into account when assessing tumor perfusion. This led us to hypothesize that a comprehensive marker that takes into account not only microvessel quantity but also the "perfusion- dampening" effects of stroma may be a better prognostic indicator than MVA.
Here we propose stroma-area normalized MVA (SnMVA) as an index of blood supply to tumors that varies directly with microvessel area and inversely with stromal area. We compare the prognostic performance of SnMVA and MVA on a retrospective sample of NSCLC patients treated at our hospital.
Materials and methods
Study design
This retrospective study was conducted using 100 randomly selected NSCLC patients who underwent tumor resection as initial therapy. Blood vessels were visualized by anti-CD31 immunostaining of endothelial cells, and MVA was evaluated as described [15, 16]. SnMVA was calculated by dividing MVA by stroma area. After measured values of MVA and SnMVA were sorted, every third value (1st, 4th, 7th, …, 97th) was tested as a cutoff value to stratify patients into groups with high or low MVA/SnMVA. Then each cutoff value was used to explore the correlation of MVA and SnMVA with survival based on Cox proportional hazard modeling. Possible cutoff values were those at which MVA or SnMVA significantly correlated with overall survival (OS) or progression-free survival (PFS), and the optimal cutoff value was the one at which this correlation was most significant. This correlation was also explored in different patient subgroups after stratification by age, gender, smoking history, TNM stage, tumor histology, tumor differentiation, and post-resection chemotherapy.
Subjects
Data were retrospectively analyzed from 100 patients randomly selected from among those who were admitted to Zhejiang Cancer Hospital with primary NSCLC and who underwent resection as initial treatment between July 2011 and October 2012. Patients were excluded if medical records were incomplete or if they were diagnosed with other malignancies prior to NSCLC. This study was performed according to the Declaration of Helsinki and Good Clinical Practice guidelines, and the study protocol was approved by the Ethics Committee of Zhejiang Cancer Hospital. Patients provided written informed consent.
Tumors were staged according to the TNM system of the 7th edition of the international staging system, and tumor histology subtype and differentiation state were determined according to guidelines of the World Health Organization Classification of Tumours of the Lung, Pleura, Thymus and Heart (http://publications.iarc.fr/Book-And-Report-Series/Who-Iarc-Classification-Of-Tumours). Patients were followed up using imaging techniques such as ultrasonography, magnetic resonance imaging and chest radiography to detect recurrence. Follow-up data were recorded until July 20, 2016.
Immunohistochemistry
Paraffin-embedded tumor tissues were obtained from the Tissue Bank of Zhejiang Cancer Hospital. Tissues were serially sectioned approximately 5 μm thick, and sections were immunostained with anti-CD 31 antibody as described [16]. In brief, antigen retrieval was conducted using EnVisionTM FLEX Target Retrieval Solution (pH 9.0, Dako) at 95 °C for 20 min, followed by incubation at 4 °C overnight with rabbit polyclonal anti-CD31 antibody (1:300; Proteintech, Rosemont, USA). Then sections were incubated with secondary antibody (Dako) at room temperature for 30 min, followed by color development with diaminobenzamine solution containing 0.005% hydrogen peroxide.
Evaluation of MVA and SnMVA
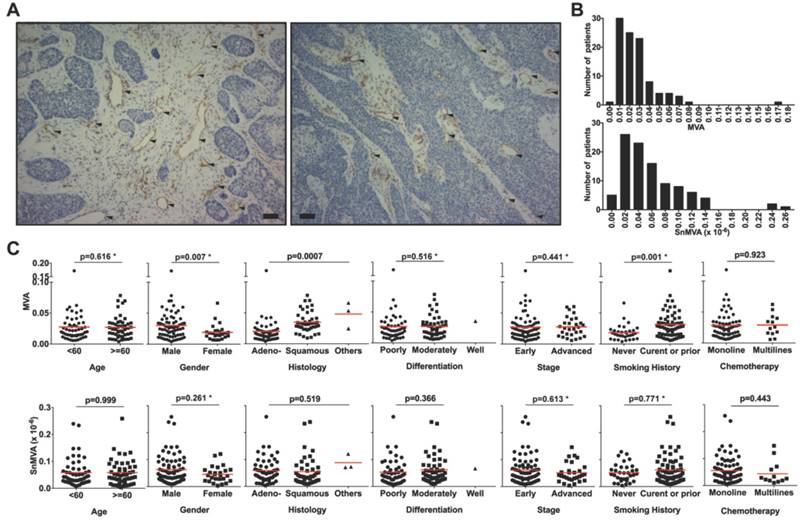
Microvessels were identified as lumens lined with endothelial cells staining positively for CD31, based on observation at low magnification (100×) using a microscope (Nikon Eclipse TI-SR) equipped with a digital camera controller (Nikon DS-U3). Hotspots showing the most highly vascularized regions were determined as described [15, 16] and captured by two independent observers at high magnification (200 ×). Compartments of cancer-cell niches and stroma in each tumor specimen were identified by two observers under 100 × magnification according to morphological profiles, which took into account color, texture and contextual features. Tumor cell niches were defined as deeply stained areas with dense cellularity and large tumor cells showing a high nucleus-to-cytoplasm ratio and prominent nucleoli stained by hematoxylin (Fig. 1A). The stroma fraction, in contrast, was defined as weakly stained segmented areas with stained nucleoli that were sparse and small (Fig. 1A). Cross-sectional areas of microvessel lumen, cancer cell niches, and stroma were calculated using Image J 1.6.0 (National Institutes of Health, USA). MVA was calculated as the ratio of total microvessel lumen area to total tissue area (total area of cancer cell niches and stroma). SnMVA was calculated by dividing MVA by stroma area.
Evaluation of MVA and SnMVA in NSCLC tissue sections. (A) Anti-CD31 immunostaining of endothelial cells (solid triangles) with large stroma fraction (left panel) and small stroma fraction around microvessels (right panel) in NSCLC tissue sections. Bar, 50 μm. (B) Histogram of MVA and SnMVA. The transvers axis was the value of MVA or SnMVA (✕10-6). (C) MVA and SnMVA of patients stratified according to age, gender, smoking history, tumor histology, tumor differentiation, stage, and type of chemotherapy. Red lines indicate mean values. *Based on non-parametric test.
Statistical analysis
Data were analyzed using R software (Version 3.4.4), SPSS 23.0 (IBM, New York, USA) and Cutoff Finder 2.1 (Institute of Pathology, Berlin, Germany). Data were graphically displayed using GraphPad Prism 7.00 (GraphPad Software, La Jolla, CA, USA).
Inter- and intra-group differences in MVA or SnMVA were assessed for significance using the chi-squared test, Student's t test, ANOVA, or non-parametric test as appropriate. Correlation of MVA or SnMVA with survival was examined with the cutoff value for high- and low MVA or SnMVA with median value or an optimal cutoff as follows. The online software Cutoff Finder (available at http://molpath.charite.de/cutoff/) was used to fit Cox proportional hazard models with the functions coxph and survfit in the R package "survival" [17]. The values of MVA or SnMVA from our cohort of 100 patients were sorted, and the values of the 1st, 4th, 7th, …, and 97th patients (step size = 3) were taken as 33 potential cutoff values. Each cutoff value was used to divide patients into two groups with high (≥ cutoff value) or low (< cutoff value) MVA or SnMVA. The difference in patient survival between the two groups was determined according to the Cox proportional hazards model. Hazard ratios (HRs) and associated 95% confidence intervals (CIs) were plotted as a function of the cutoff value. Cutoff values leading to a significant correlation of MVA or SnMVA with OS or PFS were considered possible values. The possible value showing the most significant correlation with survival was defined as the optimal cutoff.
OS and PFS curves were plotted using the Kaplan-Meier method after stratifying patients based on the median or optimal cutoff value of MVA or SnMVA. Survival curves were compared using the log-rank test. Subgroup analysis was performed using predetermined factors, including age (<60 and ≥60 yr), gender (male and female), smoking history (never and prior or current), TNM stage (early and advanced), tumor histology (adenocarcinoma, squamous and other), tumor differentiation (poorly, moderately and well), and post-resection chemotherapy (mono- and multi-line). Cox regression was used to assess the independence of each factor from other clinical characteristics, and HRs with 95%CIs were estimated. The predictive accuracy of SnMVA and MVA for survival outcomes was compared by Harrell's concordance index (c-index). Significance was defined as two-sided P < 0.05.
Results
Clinicopathological features
The current study included 100 patients (74 men, 26 women) with a median age of 59 years (range, 40 to 79). Histologic types included adenocarcinoma (n = 54) and squamous cell carcinoma (n = 43). TNM stage was I/II in 71 subjects and III/IV in 29 subjects, and 49% of patients had poorly differentiated tumors; 47%, moderately differentiated; and 1%, well differentiated. Follow-up was a median of 51.1 months (range, 45.5 to 60.0), during which 29 subjects died (29%) and 44 experienced recurrence (recurrence outcome was unavailable for 8 subjects).
MVA and SnMVA
Median MVA was 0.0228 (range, 0.00393 to 0.172), which means 2.28% of tissue section area. Median SnMVA was 0.0441 × 10⁻⁶ (range, 0.00393 × 10⁻⁶ to 0.259 × 10⁻⁶). Fig. 1A shows typical images of microvessels (solid arrows) surrounded by either a large fraction of stroma zone (Fig 1A-a) or small fraction of stroma zone (Fig 1A-b) adjacent to a tumor zone. The distribution and range of MVA and SnMVA values are shown in Fig. 1B. MVA values were comparable across subpopulations stratified by clinicopathological features, including age, gender, smoking history, histology, differentiation and disease stage (MVA, p = 0.307 to 0.679, Table 1). Similarly, SnMVA values were comparable across subpopulations (SnMVA, p = 0.116 to 0.999). The distributions across subpopulations are presented as scatter plots (Fig. 1C).
Patient clinicopathologic features and microvessel area parameters
| Clinicopathologic variables | Patients (%) | MVA | p value* | SnMVA (× 10-6) | p value* |
|---|---|---|---|---|---|
| Age | |||||
| <60 | 51 (51.0) | 0.0257 ± 0.0169 | 0.472 | 0.0584 ± 0.0507 | 0.999 |
| ≥60 | 49 (49.0) | 0.0289 ± 0.0264 | 0.0584 ± 0.0469 | ||
| Gender | |||||
| Male | 74 (74.0) | 0.0286 ± 0.0241 | 0.307 | 0.0630 ± 0.0531 | 0.116 |
| Female | 26 (26.0) | 0.0234 ± 0.0142 | 0.0455± 0.0299 | ||
| Smoking history | |||||
| Never | 33 (33.0) | 0.0276 ± 0.0261 | 0.349 | 0.0514±0.0335 | 0.315 |
| Prior or current | 67 (67.0) | 0.0256 ± 0.0169 | 0.0619±0.0545 | ||
| Disease stage | |||||
| Early (stage I & II) | 71 (71.0) | 0.0281 ± 0.0245 | 0.531 | 0.0614± 0.0530 | 0.348 |
| Advanced (stage III & IV) | 29 (29.0) | 0.0251 ± 0.0143 | 0.0513 ± 0.0357 | ||
| Tumor histology | |||||
| Adenocarcinoma | 54 (54.0) | 0.0285 ± 0.0251 | 0.679 | 0.0593±0.0460 | 0.519 |
| Squamous | 43 (43.0) | 0.0252 ± 0.0182 | 0.0553±0.0528 | ||
| Others | 3 (3.0) | 0.0335 ± 0.00664 | 0.0884± 0.0283 | ||
| Tumor differentiation | |||||
| Poorly | 49 (49.0) | 0.0243 ± 0.01408 | 0.659 | 0.0529± 0.0476 | 0.366 |
| Moderately | 47 (47.0) | 0.0287 ± 0.02494 | 0.0621 ±0.0508 | ||
| Well | 1 (1.0) | 0.0697 | 0.0665 | ||
| Chemotherapy | 0.924 | 0.443 | |||
| Mono-line | 68 (68.0) | 0.0284 ± 0.0242 | 0.0593 ± 0.0496 | ||
| Multi-lines | 13 (13.0) | 0.0290 ± 0.0175 | 0.0475 ± 0.0446 | ||
| Total | 0.0273 ± 0.0220 | 0.0584 ±0.0487 | |||
Predictive accuracy and significance of MVA and SnMVA
Significance testing of 33 cutoff values identified 4 (12.1%) possible cutoff values for the relationship between MVA and OS, as well as 1 (3.0%) possible cutoff value for the relationship between MVA and PFS. In contrast, 20 (60.6%) possible cutoff values were identified for the relationship between SnMVA and OS and 10 (30.3%) possible cutoff values for the relationship between SnMVA and PFS. Compared with MVA, larger fraction of SnMVA can be treated as candidate cutoff values to dichotomize patients and predict both patients' OS (12.1% of MVA vs. 60.6% of SnMVA, Fig.2A) and PFS (3.0% of MVA vs. 30.3% of SnMVA, Fig.2B).
Identification of possible and optimal cutoff values of MVA and SnMVA for dichotomizing NSCLC patients in order to assess the ability of these indices to predict (A) OS and (B) PFS. Results obtained with MVA (left panels) or SnMVA (right panels) using various cutoff values were used to calculate HRs (middle solid line) for high vs. low levels of MVA or SnMVA, together with the 95%CI upper limit (upper dotted line) and 95% lower limit (lower dotted line). SnMVA proved more robust than MVA because SnMVA has a wider range of possible cutoff values for OS (58.0 vs. 11.1%) and PFS (31.9 vs. 4.1%). The vertical line designates the dichotomization showing the most significant correlation with survival.
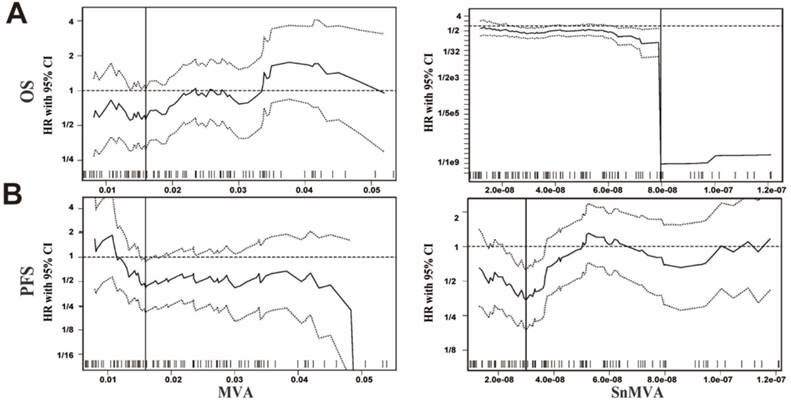
The optimal cutoff value for MVA was identified as 0.016 for both OS (Fig. 2A, left panel) and PFS (Fig. 2B, left panel). The optimal cutoff values for SnMVA were identified as 0.08 × 10⁻⁶ for OS (Fig. 2A, right panel) and 0.03 × 10⁻⁶ for PFS (Fig. 2B, right panel). Compared with MVA based models, an improved c-index was observed both univariate (OS: 0.507 vs. 0.600 of median values and 0.514 vs. 0.628 of optimal values; PFS: 0.532 vs. 0.522 of median values and 0.518 vs. 0.618 of optimal values) and multivariate survival analysis (OS: 0.616 vs. 0.659 of median values and 0.609 vs. 0.702 of optimal values; PFS: 0.603 vs. 0.621 of median values and 0.621 vs. 0.672 of optimal values) of SnMVA based models. SnMVA improved the prediction power of model compared with MVA.
Univariate survival analysis
Patient populations were dichotomized for Kaplan-Meier survival analysis using optimal cutoff values or median values of MVA and SnMVA. MVA correlated significantly with OS when an optimal cutoff value was used (HR 0.42, 95%CI 0.19 to 0.92, p = 0.011) but not when the median value was used (HR 0.58, 95%CI 0.28 to 1.19, p = 0.146). MVA did not correlate significantly with PFS, regardless of whether an optimal cutoff value was used (HR 0.58, 95%CI 0.32 to 1.08, p = 0.052) or the median value (HR 0.96, 95%CI 0.55 to 1.69, p = 0.273). In contrast, small SnMVA was significantly related to short OS, regardless of whether the optimal cutoff value was used (HR 0.26, 95%CI 0.11 to 0.60, p = 0.0016) or the median value (HR 0.47, 95%CI 0.23 to 0.97, p = 0.046) and short PFS when the optimal cutoff was used (HR 0.36, 95%CI 0.15 to 0.81, p = 0.0036) (Fig. 3A).
Comparison of prognostic performance by MVA and SnMVA following dichotomization based on median and optimal cutoff values. (A) OS and PFS curves for SnMVA (lower panels) and MVA (upper panels). SnMVA proved to be a more robust prognostic factor because its performance did not depend on which cutoff value was used or which type of survival was analyzed. (B) Forest plots of survival analysis for patient subpopulations based on predetermined clinicopathological characteristics.
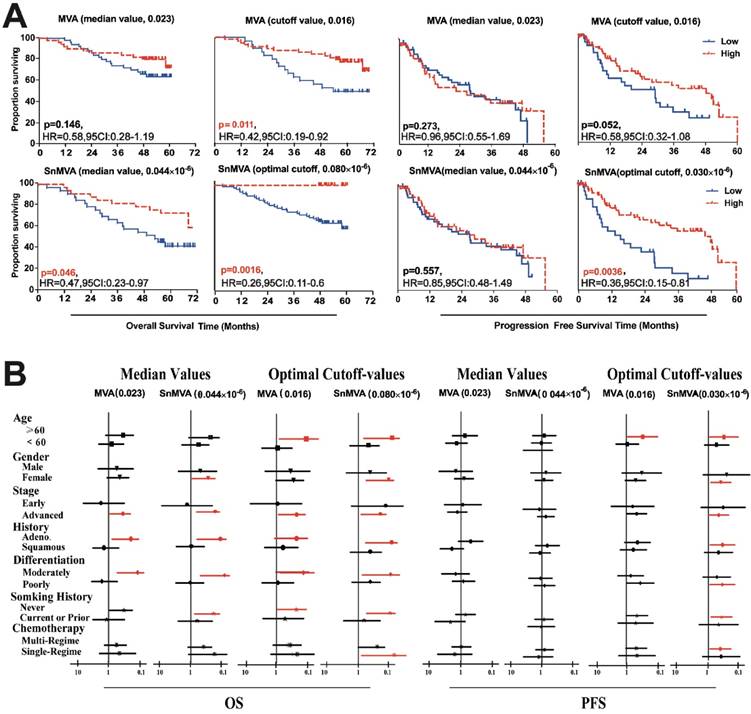
Univariate analysis of subpopulations stratified by clinicopathological features, such as therapy type, age and smoking history, showed SnMVA to be a more robust prognostic marker than MVA (Fig. 3B). Especially, as a prognostic factor of PFS used optimal cutoff-value, SnMVA play as prognostic factors in 7 subgroups patients of elder, female, advanced stage, adenocarcinoma, moderately differentiation, and chemotherapy with multi-regimes, in contrast, MVA was the prognostic factor of only one subgroup, elderly patients.
Multivariate survival analysis
Cox regression was used to assess the independence of SnMVA or MVA from other clinicopathological characteristics. High SnMVA was an independently predicted a low risk of death, regardless of whether an optimal cutoff value was used (HR 0.37, 95%CI 0.18 to 0.78, p = 0.009) or the median value was used (HR 0.42, 95%CI 0.19 to 0.95, p = 0.036) (Fig. 4). Similarly, high SnMVA was associated with long PFS, regardless of whether an optimal cutoff value was used (HR 0.27, 95%CI 0.14 to 0.52, p < 0.001) or the median value was used (HR 0.35, 95%CI 0.18 to 0.68, p = 0.002).
Forest plots of multivariate analysis of the prognostic value of MVA and SnMVA. The results depict HRs calculated after dichotomizing the patients according to low or high levels of clinicopathological features. Factors significantly related to survival are shown in red.
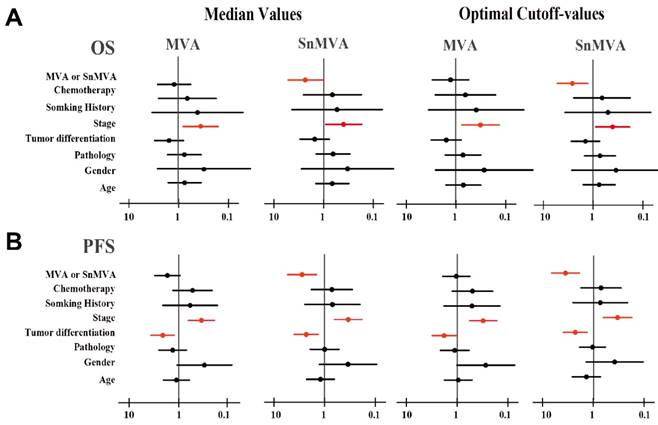
In contrast, MVA failed to show a significant correlation with OS, regardless of whether an optimal cutoff value was used (HR 0.81, 95%CI 0.37 to 1.81, p = 0.614) or the median value (HR 0.86, 95%CI 0.40 to 1.85, p = 0.707). Similarly, MVA failed to show a significant correlation with PFS, regardless of whether an optimal cutoff value was used (HR 0.86, 95%CI 0.46 to 1.60, p = 0.636) or the median value (HR 0.61, 95%CI 0.34 to 1.11, p = 0.109). This analysis further indicated that late-stage disease (III/IV) independently predicted poor OS and PFS, while well differentiated tumors independently predicted longer PFS.
Discussion
Neovascularization-based blood supply is critical for tumor progression once tumors have grown beyond a diameter of 2 mm [1, 18]. This led researchers to develop numerous surrogate markers of neovascularization, such as MVA and microvessel density, which capture aspects of microvasculature and which have shown promise for predicting prognosis of cancer patients [3, 19, 20]. However, these markers are incomplete because they ignore factors outside of microvessels, especially intratumor stroma, which can significantly impair the arrival of oxygen and nutrients to tumors [11-14]. Here we attempted to take into account these stroma effects by normalizing MVA to stroma area. The resulting marker, SnMVA, correlates positively with microvessel area and negatively with stroma area. Our validation tests with data from 100 NSCLC patients treated at our hospital suggest that SnMVA is superior to MVA for predicting prognosis.
Stroma impairs perfusion efficiency of most solid tumors [13, 14]. In our panel of 100 patients, the stroma fraction in tumor sections ranged from 12.2% to 48.7%, with a median value of 34.5%, suggesting that approximately one third of tumor tissue was stroma. Stroma is filled with highly compact, network-like extracellular matrix, which narrows extracellular spaces, increases interstitial fluid pressure, and elongates the diffusion path of oxygen and nutrients through the interstitial space. This ultimately limits the convection and diffusion of oxygen and nutrients from vessels to cancer cells [21-23]. In NSCLC, partial pressure of O2 in tumors decreases more than 50% after moving 50 μm away from microvessels [24]; indeed, the level of intratumor oxygen varies inversely with the square of the diffusion distance [25]. Interestingly, the square of diffusion distance can be used to represent stroma-area in most desmoplastic tumors. Here we calculated SnMVA by dividing MVA by the square of the diffusion distance, measured as stromal area. In our patients, SnMVA ranged from 0.00393 × 10⁻⁶ to 0.259 × 10⁻⁶ (median, 0.0441 × 10⁻⁶). MVA varied from 0.00393 to 0.172 (median, 0.0228), which is consistent with the previously reported range of 0 to 0.3 in other solid tumors [5, 26, 27].
In our study, significantly higher MVA was observed in squamous cell carcinoma (SCC) than in adenocarcinoma (ADC, p = 0.0007). A small number of studies reported the correlation between vascular profiles and histological subtypes of NSCLC, of which most were focused on MVD. The similar [28], increased [29], and decreased [30] MVD levels of SCC to ADC were reported. The MVD of SCC (44.1 ± 2.5) was comparable to ADC (37.7 ± 2.1, p=0.134) in our study. The finding was similar to the study reported by Chen (53.57 ± 5.76 of SCC vs. 50.34 ± 5.17 of ADC, p >0.05) [28]. In a study of both MVD and MVA, MVD was significantly higher for ADC (7.3 ± 4.7) as compared with SCC (2.3 ± 1.1, p < 0.0001), but MVA was comparable between SCC (0.20) and ADC (0.24, p =0.87) [31]. It was suggested that mean area of individual microvessel in SCC was higher than ADC. Thus, it was a reasonable finding of higher MVA in SCC than ADC at similar MVD levels in our study. However, the reason caused different area of individual microvessel between ADC and SCC was not clear.
We compared the ability of SnMVA and MVA to predict survival of NSCLC patients after dichotomyizing data using 33 cutoff values. Possible cutoff values, which were those among the 33 that showed a significant relationship of SnMVA or MVA with survival, were more numerous for SnMVA (20 for OS, 10 for PFS) than for MVA (4 for OS, 1 for PFS). SnMVA performed better than MVA at predicting disease-related death and relapse in uni- and multivariate analyses, especially when data were dichotomized using the optimal cutoff value. Moreover, the discrimination of SnMVA- and MVA- derived prediction-models was measured with c-index. As a commonly used index for predictive accuracy, the c-index represented the probability that for any randomly selected pair of individuals, one with and one without the outcome. High value of c-index means accurately predictive power [32]. In the current study, SnMVA presented higher c-index value than MVA both acting as simple univariate-factor (0.507-0.532 vs. 0.522-0.628) or derived multivariate-models (0.603-0.621 vs. 0.621-0.702).
MVA failed to correlate significantly with survival in our study, which likely reflects our relatively small sample. Previous reports have shown MVA or microvessel density to vary inversely with survival of patients with laryngeal cancer[33] or soft-tissue sarcoma[34], to vary positively with survival of patients with clear cell renal cell cancer[5], or not to vary significantly with survival of patients with astrocytic tumors[7] or breast carcinoma[35]. In the present study, low levels of SnMVA and MVA were associated with poor survival. The causes of paradoxical relation between microvessel quantity and survival remained unclear. Higher MVD or MVA contributed to poor survival by increasing nutrient and oxygen supply for proliferating clone of tumor cells, and providing vascular route for tumor cells metastasis [6]. On the contrary, abundant microvasculature meant well-differentiation tumor with good survival, as while as, less vascular lumens kept pace with the proliferation of tumor cells, and increased vessel permeability may compensate for their reduced amount [5]. In our point, an additional explanation should be considered was that low values of these indices indicate poor perfusion, leaving more of the tumor hypoxic. Hypoxia can trigger genetic and other adaptations in the tumor that facilitate its escape from host immune responses and resistance to chemo- and radiotherapy [36, 37]. Low MVA appears to trigger compensatory changes in vascular properties, such as increased vascular permeability and altered rheological properties of blood flow [5, 38]. These changes ultimately enhance tumor progression [13].
The limitations of SnMVA should be addressed. At first, the predictive power of SnMVA should been further evaluated across various population of patients by different researchers. Moreover, SnMVA was only a conceptual model of vascular-stroma combined factor. It was rough and need to be refined by optimizing parameters of microvessel and stroma, and algorithm of combination. For example, whether stroma area was an optimal factor to optimize the MVA should be discussed. Instead of a structural supporter of tumor with physiological inert, the stroma played crucial role in the development of tumors. Stroma ratio was reported as an independently prognostic factor of lung cancer patients: rich stroma in tumor means poor outcome of survival [39-41]. In the present study, stroma ratio significantly correlated to OS (HR =0.30, 95CI: 0.14-0.62, p=0.012) and PFS (HR =0.51, 95CI: 0.29-0.91, p=0.010), though, SnMVA seemed slightly better than stroma ratio as prognostic factor of OS (HR =0.26, 95CI: 0.11-0.60, p=0.002) and PFS (HR =0.36, 95CI: 0.15-0.81, p=0.004). So, although stoma area may be not the best optimal factor to optimize MVA, SnMVA was significantly improved the predictive power of MVA. It provided pilot proof of the concept of combined factor and we expected to inspire other researchers to focus this concept, optimize the vascular-stroma combined factor and provide more sufficient proof.
Despite these limitations, SnMVA appears to show promise as a more comprehensive index of tumor perfusion than MVA on its own, making SnMVA more attractive for predicting prognosis of cancer patients. This novel index takes into account both microvessel intensity and perfusion of oxygen and nutrients into the tumor. Using a relatively small clinical sample, we validated SnMVA as an independent prognostic indicator of prognosis in the case of NSCLC, and it showed higher predictive accuracy, significance and robustness than MVA. SnMVA may prove similarly effective at predicting prognosis of other cancers.
Clinical practice points
Tumor perfusion is crucial to growth and metastasis and can be a useful prognostic factor. However, typical indices that reflect perfusion, primarily microvessel density or MVA, are not always effective at predicting survival. This may reflect the fact that although they measure a characteristic that promotes perfusion, they do not take into account factors that reduce it, such as thick stroma surrounding microvessels.
This study describes SnMVA as a novel prognostic indicator that takes into account the same microvessel intensity as MVA, as well as the extent to which microvessel-surrounding stroma reduces perfusion efficiency. Using data from 100 patients with NSCLC, we showed that SnMVA was superior to MVA at predicting survival in uni- and multivariate analyses. SnMVA was significantly related to OS or PFS after data were dichotomized using median SnMVA or the optimal cutoff value identified through systematic tests of 33 possible cutoff values. MVA, in contrast, showed a significant relationship only with OS in univariate analysis and only when data were dichotomized using the optimal cutoff value.
Our results suggest that SnMVA may be more accurate than the traditional index MVA for predicting prognosis based on tumor perfusion. This approach of normalizing microvessel measures by stromal area may be relevant to the design of other prognostic markers for a variety of solid tumors.
Abbreviations
HR: hazard ratio; MVA: microvessel area; NSCLC: non-small cell lung cancer; OS: overall survival; PFS: progression-free survival; SnMVA: stroma-area normalized microvessel area.
Acknowledgements
The work was supported by the National Natural Science Foundation of China (81301873 and 81773819), Natural Science Foundation of Zhejiang Province (Y16H160129 and Q17H300007), Science and Technology in Zhejiang Province Chinese Medicine Program (2015ZA036), Scientific Research Key Program of the Health Bureau of Zhejiang Province (WKJ-ZJ-1504), Medical Science Research Foundation of Zhejiang Province (2015ZDA006), Zhejiang Provincial Program for the Cultivation of High-level Innovative Heath Talents (P.H.), Zhejiang Provincial Program for 151 Talents (P.H. and L.F.), and Zhejiang Cancer Hospital Program for the Cultivation of 1022 Talents (L.F.).
Competing Interests
The authors have declared that no competing interest exists.
References
1. Carmeliet P. Angiogenesis in life, disease and medicine. Nature. 2005;438:932-6
2. Fox SB, Leek RD, Weekes MP. et al. Quantitation and prognostic value of breast cancer angiogenesis: comparison of microvessel density, Chalkley count, and computer image analysis. The Journal of pathology. 1995;177:275-83
3. Irion LC, Prolla JC, Hartmann AA. et al. [Morphometric intratumoral microvessel area evaluation could be a useful indicator for coadjuvant therapy in ressected NSCLC]. Revista portuguesa de pneumologia. 2003;9:19-32
4. Sato M, Nakai Y, Nakata W. et al. Microvessel area of immature vessels is a prognostic factor in renal cell carcinoma. International journal of urology: official journal of the Japanese Urological Association. 2014;21:130-4
5. Mertz KD, Demichelis F, Kim R. et al. Automated immunofluorescence analysis defines microvessel area as a prognostic parameter in clear cell renal cell cancer. Hum Pathol. 2007;38:1454-62
6. Delahunt B, Bethwaite PB, Thornton A. Prognostic significance of microscopic vascularity for clear cell renal cell carcinoma. Br J Urol. 1997;80:401-4
7. Sharma S, Sharma MC, Gupta DK. et al. Angiogenic patterns and their quantitation in high grade astrocytic tumors. Journal of neuro-oncology. 2006;79:19-30
8. Jain RK. Normalization of tumor vasculature: an emerging concept in antiangiogenic therapy. Science (New York, NY). 2005;307:58-62
9. Vaupel P, Mayer A, Briest S. et al. Hypoxia in breast cancer: role of blood flow, oxygen diffusion distances, and anemia in the development of oxygen depletion. Advances in experimental medicine and biology. 2005;566:333-42
10. Menon C, Fraker DL. Tumor oxygenation status as a prognostic marker. Cancer letters. 2005;221:225-35
11. Ariffin AB, Forde PF, Jahangeer S. et al. Releasing pressure in tumors: what do we know so far and where do we go from here? A review. Cancer research. 2014;74:2655-62
12. Stylianopoulos T, Martin JD, Snuderl M. et al. Coevolution of solid stress and interstitial fluid pressure in tumors during progression: implications for vascular collapse. Cancer Res. 2013;73:3833-41
13. Khawar IA, Kim JH, Kuh HJ. Improving drug delivery to solid tumors: priming the tumor microenvironment. J Control Release. 2015;201:78-89
14. Provenzano PP, Hingorani SR. Hyaluronan, fluid pressure, and stromal resistance in pancreas cancer. British Journal of Cancer. 2013;108:1-8
15. Lee BL, Kim WH, Jung J. et al. A hypoxia-independent up-regulation of hypoxia-inducible factor-1 by AKT contributes to angiogenesis in human gastric cancer. Carcinogenesis. 2008;29:44-51
16. Fang L, He Y, Tong Y. et al. Flattened microvessel independently predicts poor prognosis of patients with non-small cell lung cancer. Oncotarget. 2017;8:30092-9
17. Budczies J, Klauschen F, Sinn BV. et al. - Cutoff Finder: a comprehensive and straightforward Web application enabling rapid cutoff optimization. PLoS One. 2012;7:e51862
18. Folkman J. Tumor angiogenesis: therapeutic implications. The New England journal of medicine. 1971;285:1182-6
19. Sharma SG, Aggarwal N, Gupta SD. et al. Angiogenesis in renal cell carcinoma: correlation of microvessel density and microvessel area with other prognostic factors. International urology and nephrology. 2011;43:125-9
20. Korkolopoulou P, Viniou N, Kavantzas N. et al. Clinicopathologic correlations of bone marrow angiogenesis in chronic myeloid leukemia: a morphometric study. Leukemia. 2003;17:89-97
21. Sato H, Takino T, Okada Y. et al. A matrix metalloproteinase expressed on the surface of invasive tumour cells. Nature. 1994;370:61-5
22. Jain RK, Stylianopoulos T. Delivering nanomedicine to solid tumors. Nat Rev Clin Oncol. 2010;7:653-64
23. Miao L, Huang L. Exploring the tumor microenvironment with nanoparticles. Cancer treatment and research. 2015;166:193-226
24. Swinson DE, Jones JL, Richardson D. et al. Carbonic anhydrase IX expression, a novel surrogate marker of tumor hypoxia, is associated with a poor prognosis in non-small-cell lung cancer. J Clin Oncol. 2003;21:473-82
25. Thomlinson RH, Gray LH. The histological structure of some human lung cancers and the possible implications for radiotherapy. British Journal of Cancer. 1955;9:539-49
26. Deb P, Boruah D, Dutta V. Morphometric study of microvessels in primary CNS tumors and its correlation with tumor types and grade. Microvascular research. 2012;84:34-43
27. Hong HS, Kim SH, Park HJ. et al. Correlations of dynamic contrast-enhanced magnetic resonance imaging with morphologic, angiogenic, and molecular prognostic factors in rectal cancer. Yonsei medical journal. 2013;54:123-30
28. Chen ZJ, Le HB, Zhang YK. et al. Microvessel density and expression of thrombospondin-1 in non-small cell lung cancer and their correlation with clinicopathological features. The Journal of international medical research. 2009;37:551-6
29. Koukourakis MI, Giatromanolaki A, Kakolyris S. et al. Different patterns of stromal and cancer cell thymidine phosphorylase reactivity in non-small-cell lung cancer: impact on tumour neoangiogenesis and survival. Br J Cancer. 1998;77:1696-703
30. Schuurbiers OC, Meijer TW, Kaanders JH. et al. Glucose metabolism in NSCLC is histology-specific and diverges the prognostic potential of 18FDG-PET for adenocarcinoma and squamous cell carcinoma. J Thorac Oncol. 2014;9:1485-93
31. Zhang L, Yankelevitz DF, Henschke CI. et al. Variation in vascular distribution in small lung cancers. Lung cancer (Amsterdam, Netherlands). 2010;68:389-93
32. Cook NR. Statistical evaluation of prognostic versus diagnostic models: beyond the ROC curve. Clin Chem. 2008;54:17-23
33. Pietruszewska W, Kobos J, Gryczynski M. [Microvessel density and endothelial area in assessment of angiogenesis in patients with laryngeal cancer]. Otolaryngologia polska = The Polish otolaryngology. 2003;57:5-15
34. Luong RH, Baer KE, Craft DM. et al. Prognostic significance of intratumoral microvessel density in canine soft-tissue sarcomas. Veterinary pathology. 2006;43:622-31
35. Siitonen SM, Haapasalo HK, Rantala IS. et al. Comparison of different immunohistochemical methods in the assessment of angiogenesis: lack of prognostic value in a group of 77 selected node-negative breast carcinomas. Modern pathology: an official journal of the United States and Canadian Academy of Pathology, Inc. 1995;8:745-52
36. Chouaib S, Noman MZ, Kosmatopoulos K. et al. Hypoxic stress: obstacles and opportunities for innovative immunotherapy of cancer. Oncogene. 2017;36:439-45
37. Rapisarda A, Melillo G. Overcoming disappointing results with antiangiogenic therapy by targeting hypoxia. Nature reviews Clinical oncology. 2012;9:378-90
38. Kohler HH, Barth PJ, Siebel A. et al. Quantitative assessment of vascular surface density in renal cell carcinomas. British journal of urology. 1996;77:650-4
39. Zhang T, Xu J, Shen H. et al. Tumor-stroma ratio is an independent predictor for survival in NSCLC. Int J Clin Exp Pathol. 2015;8:11348-55
40. Xi KX, Wen YS, Zhu CM. et al. Tumor-stroma ratio (TSR) in non-small cell lung cancer (NSCLC) patients after lung resection is a prognostic factor for survival. Journal of thoracic disease. 2017;9:4017-26
41. Ichikawa T, Aokage K, Sugano M. et al. The ratio of cancer cells to stroma within the invasive area is a histologic prognostic parameter of lung adenocarcinoma. Lung cancer (Amsterdam, Netherlands). 2018;118:30-5
Author contact
![]() Corresponding author: Ping Huang, Department of Pharmacy, Zhejiang Cancer Hospital, #1 Banshan East Road, 310022, Hangzhou, China. Tel: +86-571-88122118. Fax: +86-571-88122118. E-mail: Huangping1841org.cn
Corresponding author: Ping Huang, Department of Pharmacy, Zhejiang Cancer Hospital, #1 Banshan East Road, 310022, Hangzhou, China. Tel: +86-571-88122118. Fax: +86-571-88122118. E-mail: Huangping1841org.cn