Impact Factor ISSN: 1837-9664

 Global reach, higher impact
J Cancer 2019; 10(12):2764-2770. doi:10.7150/jca.31703 This issue Cite
Research Paper
LNC CRYBG3 inhibits tumor growth by inducing M phase arrest
Weidong Mao1,2,#, Ziyang Guo1,#, Yingchu Dai1,#, Jing Nie1,3, Bingyan Li1,3, Hailong Pei1,3, ![]() , Guangming Zhou1,3,
, Guangming Zhou1,3, ![]()
1. State Key Laboratory of Radiation Medicine and Protection, School of Radiation Medicine and Protection, Medical College of Soochow University, Suzhou 215123, China
2. The Second Affiliated Hospital of Soochow University, Suzhou 215123, China
3. Collaborative Innovation Center of Radiological Medicine of Jiangsu Higher Education Institutions, Suzhou 215123, China
# These authors contributed equally.
Received 2018-11-21; Accepted 2019-4-23; Published 2019-6-2
Abstract
Long noncoding RNAs (lncRNAs) are usually associated with tumor development and progression and some of them are dysregulated in various human cancers. The mechanisms underlying their dysregulation are worth further study. Here, we demonstrate that the expression level of LNC CRYBG3 is correlated with 1501 aberrantly expressed proteins in A549 cells (non-small cell lung cancer (NSCLC) cells). LNC CRYBG3 overexpression results in M phase arrest and promoted cell death, whereas LNC CRYBG3 knockdown did not elicit the opposite effects. The overexpression of LNC CRYBG3 inhibits cell proliferation both in vitro and in vivo. Moreover, it upregulates the expression of cyclin B1 and the phosphorylation of H3, whereas it inhibited the expression of cyclin-dependent kinase 6 and cyclin D1. Taken together, these findings suggest that LNC CRYBG3 regulates the cell cycle process of A549 cells, suggesting its potential application for the treatment of this disease.
Keywords: Non-small cell lung cancer, long non-coding RNA, cell cycle arrest, tumor suppressor
Introduction
Non-small cell lung cancer (NSCLC) remains the most frequently diagnosed cancer and is the first leading cause of cancer-related death in China [1]. Dysfunction of cell cycle checkpoints and increased cell proliferation are the generous characteristics of cancer development and progression and is associated with poor prognosis in patients with malignant tumors [2]. Advances in medical care have led to the development of several screening techniques for the early detection of NSCLC, including X-ray slices, bronchoscopy, thoracoscopy, and the CYFRA21-1 tumor marker. However, many patients are diagnosed at an advanced stage [3, 4], which also leads to a poor prognosis. Therefore, a better understanding of the mechanisms underlying NSCLC progression is important to identify potential therapeutic targets for improving clinical outcome.
Recent transcriptomic studies show that the most of human genome is transcribed into noncoding RNA molecules [5]. Long noncoding RNAs (lncRNAs) are noncoding transcripts that are larger than 200 nucleotides and lack protein-coding potential. Compared with protein-coding transcripts, lncRNA genes have relatively few exons, are of low abundance, and highly cell- and tissue-specific [6]. LncRNAs regulate gene expression at the transcriptional, post-transcriptional, and epigenetic levels by interacting with various biomolecules, including DNA, RNA, and proteins [6]. A growing body of evidence indicates that these noncoding transcripts participate in a wide range of cellular processes, including cell proliferation [7], apoptosis [8], differentiation [9], and immune response [10], which are the processes involved in tumorigenesis. Thus, studying the expression and functions of lncRNAs could be of value to improve our understanding of the mechanisms underlying NSCLC progression.
Recently we revealed that the radiation-inducible lncRNA, LNC CRYBG3 blocks cytokinesis by directly binding to G-actin. In the present study, we examined the proteomic changes occurring in response to LNC CRYBG3 overexpression by using isobaric tags for relative and absolute quantitation (iTRAQTM) technology, and identified 1501 differentially expressed proteins. Many aberrantly expressed proteins were associated with cell cycle process. LNC CRYBG3 overexpression suppressed cancer cell proliferation and induced G2/M phase arrest, which resulted in cell death both in vitro and in vivo. These findings suggest that LNC CRYBG3 acts as an anticancer agent, although further studies are required to confirm its potential application for the treatment of NSCLC.
Results
Protein expression profiles in A549 cells treated with LNC CRYBG3
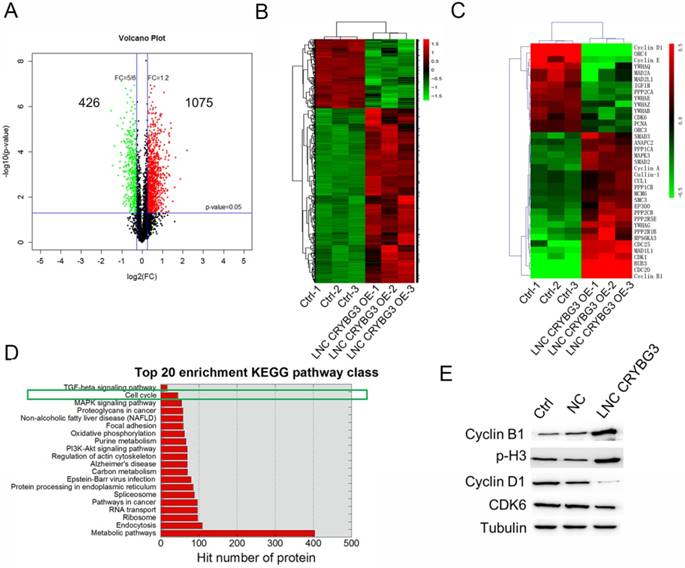
The analysis identified 1501 significantly differentially expressed proteins in A549 cells overexpressing LNC CRYBG3 compared with negative control cells [fold change (FC) >2; P < 0.05], of which 1075 were significantly upregulated and 426 were downregulated as shown in the volcano plot in Figure 1A. The heat map shows the results of unsupervised hierarchical clustering analysis of the expression of 1501 proteins (Figure 1B). Among the dysregulated transcripts, ubiquitin-conjugating enzyme E2 (UBE2R2) was the most upregulated, with a FC of 4.61, and actin was the most downregulated, with a FC of -3.47. KEGG analysis showed that several functional pathways were enriched, and the top 20 functionally enriched KEGG pathways were analysis. Pathways highly correlated with the aberrantly expressed proteins included metabolic pathways, endocytosis, the ribosome pathway in cancer, regulation of actin cytoskeleton, and cell cycle among others. Of these, 14 proteins were clustered into negative regulation of the cell cycle, whereas 23 proteins were clustered into positive regulation of the cell cycle. The expression of 37 proteins related to the cell cycle regulation pathway is shown in the heat map (Fig. 1C). In cells overexpressing LNC CRYBG3, the G1/S transition markers cyclin D1 and cyclin E were downregulated, whereas the G2/M transition markers cyclin B1 and BUB3 were upregulated. Top 20 enrichment KEGG pathway class was shown when cells were overexpressed LNC CRYBG3. Cell cycle played an important role after LNC CRYBG3 overexpressed. Although the number of targeted proteins had only 14, the proportion of targeted proteins in the whole cell cycle pathway was very high. Differentially expressed cell cycle regulation pathway proteins were detected by western blotting (Fig. 1E). Cyclin B1 and phosphorylated H3 were upregulated, whereas cyclin D1 and cyclin-dependent kinase 6 (CDK6) were downregulated in response to LNC CRYBG3 overexpression. The data of western blot coincide with the iTRAQTM data.
Protein expression profiles in A549 cells treated with LNC CRYBG3. (A) Volcano plot indicates the number of up- or down-expressed proteins after LNC CRYBG3 overexpression. (B) The heatmap displays of total differentially expressed proteins after overexpressed LNC CRYBG3. (C) The heatmap displays of differentially expressed proteins in cell cycle pathway. (D) Top 20 enrichment KEGG pathway class was shown when cells were overexpressed LNC CRYBG3. (E) The protein makers of cell cycle were confirmed by western blot after LNC CRYBG3 overexpression.
LNC CRYBG3 blocks cells at the M phase transition
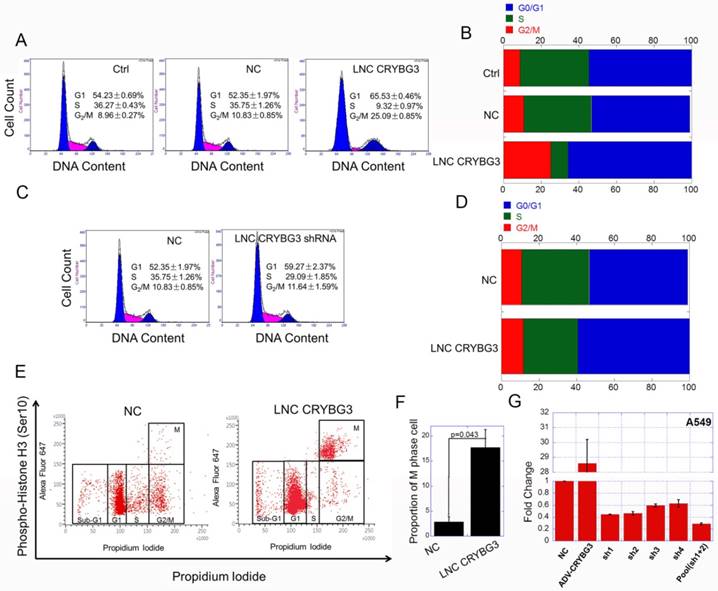
As LNC CRYBG3 has great influence on cell cycle related signaling pathways, we then examined the cell cycle when cells were up-regulated or down-regulated LNC CRYBG3. The results of flow cytometry showed that, LNC CRYBG3 overexpression increased the number of G2/M phase cells. Overexpression of LNC CRYBG3 in lung carcinoma A549 cells resulted in G2/M arrest (Fig. 2A and 2B). Small hairpin RNA (shRNA)-mediated LNC CRYBG3 knockdown had no significant effect on cell cycle distribution compared with the negative control group (Fig. 2C and 2D). Flow cytometry profiles of pH3 and DNA content. Phosphorylated of H3, as M phase maker, was used in the experiment. The results showed that the proportion of M phase cells was significantly up-regulated after overexpression of LNC CRYBG3 (Fig. 2E and 2F). From this we could conclude that overexpression of LNC CRYBG3 caused M phase arrest in cells.
Overexpressed LNC CRYBG3 causes M phase arrest. (A & B) Cell cycle distribution after overexpression of LNC CRYBG3, assayed by flow cytometry. NC, lncRNA Negative control. (C & D) Cell cycle distribution after depress LNC CRYBG3 expression, assayed by flow cytometry. shRNA used LNC CRYBG3 short hairpin RNAs. (E) Flow cytometry profiles of pH3 and DNA content. For both panels the Y-axes represent pH3 levels, while the X-axes indicate the DNA content. The left panel shows merged distribution profiles of pH3 and DNA content in negative control group. The right panel shows pH3 and DNA content in LNC CRYBG3 overexpress group. (F) The percentage of pH3 positive cells among total cells is indicated. (G) This figure shows short hairpin RNA ( shRNA) of LNC CRYBG3 interference efficiency.
LNC CRYBG3 induces apoptosis
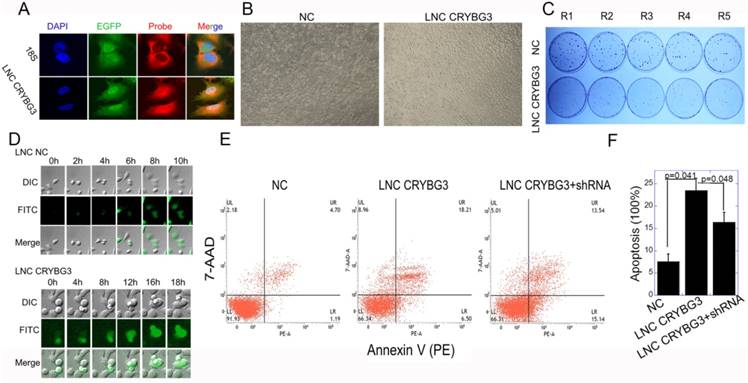
Fluorescence in situ hybridization (FISH) demonstrated that LNC CRYBG3 was distributed in the cytoplasm and nucleus, as detected using 18s and DAPI as markers of the cytoplasm and nucleus, respectively (Fig. 3A). LNC CRYBG3 overexpression resulted in morphological changes in cells (Fig. 3B). In addition, LNC CRYBG3 overexpressing cells showed a significantly lower rate of cell proliferation than control cells (Fig. 3C). A live cell imaging system confirmed that LNC CRYBG3 overexpressing cells were arrested in G2/M phase and had completed karyomitosis, although they failed to undergo cytoplasmic division (Fig. 3D). Overexpression of LNC CRYBG3 resulted in cellular apoptosis (Fig. 3E and 3F). But when overexpressed LNC CRYBG3 and then knockdown its expression with LNC CRYBG3 shRNA, the apoptosis decreased compared with LNC CRYBG3 overexpression group. The time-dependent expression of LNC CRYBG3 was correlated with cell cycle kinetics, and LNC CRYBG3 overexpression blocked cytokinesis. Taken together, the results indicated that LNC CRYBG3 is a regulator of cell cycle progression and its expression is correlated with cell death.
Overexpressed LNC CRYBG3 increases apoptosis. (A) RNA FISH analysis of LNC CRYBG3 localization in A549 cells. 18s used to indicate cytoplasm. (B) LNC CRYBG3 overexpression resulted in morphological changes in cells. (C) Determination of cell proliferation with clonogenic assay when cells were overexpressed with negative control or LNC CRYBG3. (D) Confocal microscopy was used to observe cell mitosis after overexpressed with LNC NC or LNC CRYBG3. (E&F) The apoptosis rate of cells when overexpressed with negative control or LNC CRYBG3 and then knockdown LNC CRYBG3. Data represent the mean ± SE of three independent experiments.
LNC CRYBG3 suppresses tumor growth
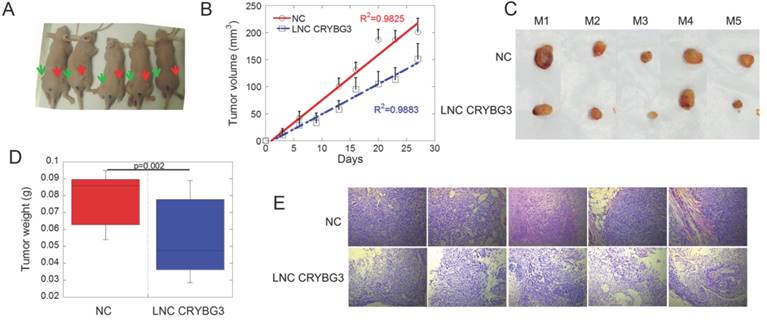
Because LNC CRYBG3 caused cell apoptosis, we hypothesized that LNC CRYBG3 may have antineoplastic properties. Tumor-bearing nude mice were generated by subcutaneously inoculating human lung carcinoma A549 cells, and the role of LNC CRYBG3 in carcinogenesis was assessed (Fig. 4A). When the tumor volume reached 100 mm3, tumors were injected with AdV-LNC CRYBG3 adenovirus particles or equal amounts of AdV-NC adenovirus particles. Tumors carrying LNC CRYBG3 adenovirus showed significantly suppressed tumor growth compared with NC adenovirus tumors (Fig. 4B), and tumor weight was significantly lower than that in sham control tumors (Fig. 4C and D). Hematoxylin and eosin (H&E) staining of transplanted lung tumor tissues showed decreased malignancy in LNC CRYBG3 overexpressing tissues (Fig. 4E). Taken together, these results indicated that LNC CRYBG3 inhibited tumor growth.
Overexpressed LNC CRYBG3 prevents tumor growth. (A) The mice photos were collected on 30th day. All the cells used were overexpressed with negative control (left Green Arrow) or LNC CRYBG3 (right Red Arrow). (B) Xenografted tumor grows curve after overexpressed LNC CRYBG3 (red arrow of mice) or negative control (green arrow of mice). The injection was begun on the time when xenografted tumor get 100 mm3 twice a week for 1 month (n=5 for each group). (C) The xenografed tumors obtained after 8 times injection (n=5 for each group). (D) The weight of xenografed tumors from different groups was compared (n=5 for each group). (E) Representative H&E staining of transplanted lung tumor tissues are shown. Data represent the mean ± SE of three independent biological experiments.
Discussion
The results of the present study showed that LNC CRYBG3 upregulation induced G2/M arrest and apoptosis and inhibited tumor cell proliferation. LNC CRYBG3 overexpression inhibited tumor growth and induced apoptosis of A549 cells in vitro and in vivo. Quantitative RT-PCR results show that LNC CRYBG3 is overexpressed in different NSCLC tumors and cell lines, suggesting the potential role of this lncRNA in NSCLC progression [11]. LNC CRYBG3 could overexpress 8000 copies in tumor tissues. However, we also have experimental evidence that if we continue to overexpress LNC CRYBG3 to 20,000 copies, it will significantly inhibit the growth of tumors (Unpublished data). The appeal of LNC CRYBG3 as a therapeutic target is based on the notion that its overexpression contributes to pathologic changes of tumors in vivo and could be effective for tumor treatment.
Cell cycle progression is a tightly regulated and ordered event in which genomic DNA is replicated and the genome is divided equally into two similar cells. The ability of eukaryotic cells to properly start and end cell cycle events depends on a complex cellular regulatory system, the cell cycle regulatory system. Cell cycle arrest helps maintain gene stability and induces apoptosis. Therefore, the study of the cell cycle and its regulation is of great significance for the prevention and treatment of diseases related to the cell cycle. The modulation of cell cycle arrest and induction of cell apoptosis are important strategies in cancer therapy [12]. G1 and G2-M are two critical cell cycle checkpoints that allow cells to repair DNA damage and maintain chromosomal integrity before entering mitosis [13]. Because targeting G1 may induce death in normal cells, many chemotherapeutic drugs such as paclitaxel, oxaliplatin, and pirarubicin cause arrest at the G2-M transition [14-17]. In the present study, the effect of LNC CRYBG3 was similar to that of biological processes causing arrest of human NSCLC cells in G2/M. Certain natural products can also cause arrest at the G2-M checkpoint in cancer cells [18]. These reagents provide novel potential candidates as lead compounds for developing a new generation of anti-tumor agents.
LNC CRYBG3 is present in the human lung, brain, liver, and kidney, and is transcribed from the crystallin beta-gamma domain containing 3 (CRYBG3) gene on chromosome 3 (http://www.noncode.org/). In a previous study, we reported that LNC CRYBG3 directly binds to G-actin and suppresses G-actin assembly [19]. Consistently, in the present study, unsupervised hierarchical clustering analysis of the expression of 1501 proteins showed that actin was the most downregulated. Among the top 20 enriched KEGG pathways identified, certain pathways such as regulation of actin cytoskeleton, focal adhesion, MAPK signaling pathway, and TGF-beta were highly correlated with the aberrantly expressed proteins. These four pathways are closely related with tumor progression, apoptosis, cell cycle and cell proliferation, etc. The adhesion, invasion, and metastasis of cells are characteristic of multicellular organisms and enable tissue specialization, thus increasing cell complexity. In epithelial cells, these cellular processes require the actin cytoskeleton as well as cadherins, which act as extracellular elements [20] and are important for tumor occurrence, development, and recurrence [21] [21] [22]. Therefore, it is of critical importance to clarify the regulatory and molecular mechanisms underlying actin cytoskeleton remodeling.
In summary, LNC CRYBG3 inhibited tumor progression in in vivo and in vitro by inducing G2/M arrest and promoting apoptosis, suggesting its potential for the treatment of cancer. Ultimately, its clinical efficiency will depend on how best to deliver the lncRNA into cancer cells efficiently and precisely to avoid side effects on normal tissues.
Materials and Methods
Cell culture
Human lung cancer A549 cells were maintained in RPMI-1640 medium (Sigma, St. Louis, MO, USA) supplemented with 10% fetal bovine serum (FBS, Gibco, Grand Island, NY, USA), 1% penicillin sodium, and 100 μg/mL streptomycin at 37°C in 5% CO2 in a humidified incubator (Thermo Scientific, Asheville, NC, USA). A549 cells were cultured to 80% confluence in φ100 mm culture dishes (Corning, NY, USA) before being subjected to other treatments. The A549 cell lines was obtained from ATCC. The cells were used within 10-20 passages according to the requirements of ATCC, and were routinely tested mycoplasma free mycoplasma detection kit (Beyotime, Guangzhou, China). A549 is a K-ras mutant but EGFR wild type cell line.
Gene silencing and overexpression
A549 cells (1 × 10⁵) were transfected with 1 × 10⁶ LNC CRYBG3 shRNA lentivirus particles (Sangon, Shanghai, China) for 24 h to generate A549-sh cells. Control shRNA (A549-LV-NC) and GFP lentivirus particles were used according to the manufacturer's instruction. Cells were cultured in MEM medium containing 2 μM puromycin (Invitrogen) and double-checked with RT-PCR. Adenovirus particles were used for LNC CRYBG3 overexpression (Sangon).
Protein isobaric tags for relative and absolute quantitation (iTRAQTM)
Frozen samples were transferred into low protein binding tubes (1.5 mL Eppendorf), and lysed with 300 µL digestion buffer supplemented with 1 mM PMSF with sonication on ice. Protein concentration was measured using the BCA method. Protein samples were digested and labeled with iTRAQ labeling reagent. RP separation was performed on an 1100 HPLC System (Agilent) using an Agilent Zorbax Extend RP column (5 μm, 150 × 2.1 mm). All LC-MS/MS analyses were performed on a Q-Exactive mass spectrometer (Thermo, USA) equipped with a Nanospray Flex source (Thermo, USA). The peptide mixtures were loaded onto a capillary C18 trap column (3 cm × 100 µm, C18, 3 µm, 150 Å) and separated using a C18 column (15 cm × 75 µm, C18, 3 µm, 120 Å) on a ChromXP Eksigent system (AB Sciex). Full MS scans were acquired in the mass range of 300-1600 m/z with a mass resolution of 70000, and the AGC target value was set at 1E6. The ten most intense peaks in MS were fragmented with higher-energy collisional dissociation (HCD) with collision energy of 30. MS/MS spectra were obtained with a resolution of 17500 with an AGC target of 200000 and a max injection time of 50 ms. The Q-E dynamic exclusion was set for 15.0 s and run under positive mode. Differentially expressed proteins were identified through fold change as well as P value calculated with t-test. The functional enrichment analyses of the proteins were performed using the hypergeometric cumulative distribution function. The KEGG pathway annotations were assigned to the lncRNAs as the predicted functions (http://www.genome.jp/kegg/).
Western blot
Cells were harvested and lysed using RIPA buffer. Samples were sonicated and centrifuged at 12,000 g for 15 min at 4ºC. The concentration of total protein was determined using the DC Protein Assay Kit I (Bio-Rad, Richmond, CA, USA). Then, samples were denatured at 100ºC for 5 min, and proteins were separated by 12% SDS-PAGE and transferred to Hybond nitrocellulose membranes (Amersham, NJ, USA). The membranes were blocked with 5% nonfat milk powder in Tris-buffered saline (pH 7.5) and hybridized overnight with primary antibodies against β-actin, β-tubulin, cyclin B1, cyclin D1, CDK6, and phosphorylated H3 (Abcam). Membranes were then incubated with horseradish peroxidase-conjugated anti-IgG for 2 h at room temperature and bands were visualized with an ECL kit (Millipore, Billerica, MA, USA). Proteins were normalized to the loading controls.
FISH
RNA in situ hybridization was performed with a RiboTM Fluorescent In Situ Hybridization Kit (R11060, Ribobio, Guangzhou, China). Cells were fixed in 4% paraformaldehyde for 10 min, washed with PBS for 30 min, treated with 0.5% Triton for 10 min, blocked for 1 h with blocking solution, and stained with lncRNA FISH Probe Mix or 18s rRNA Probe Mix at 37℃ overnight. Samples were washed with SSC for 5 min four times. Cell nuclei were counterstained with DAPI (Invitrogen, CA, USA). Slides were observed under a confocal laser scanning microscope (OLYMPUS FV1200, Tokyo, Japan).
Cell cycle assay
Cells were harvested and fixed with 70% pre-chilled ethanol for over 24 h at -20°C. The fixed cells were washed twice with PBS, and treated with 100 μg/mL RNase A and 50 μg/mL propidium iodide mixed buffer (BD Biosciences, San Jose, CA) for 30 min at room temperature. Cell cycle distribution was analyzed with Modfit software (Verity Software, Topsham, ME) from the histogram of DNA content measured with a flow cytometer (FACScan, Becton Dickinson).
In vivo test
A549 cells (1.6 × 10⁶) were injected subcutaneously into the flanks of 5-week-old nude mice (n=5). When the tumor volume reached 100 mm3, tumors were treated with 1 × 10⁷ AdV-LNC CRYBG3 adenovirus particles or equal amounts of AdV-NC adenovirus particles. Tumor volumes were measured every 2 days using a caliper for 1 month. Then, the tumors were excised and weighed. Tumor volume data were normalized to those obtained just before injection. Mice were kept in the SPF Animal Laboratory, Soochow University, under the approval of the Institutional Review Board or Animal Care and Use Committee. The committee approved the experiments and confirmed that all experiments conformed to the relevant regulatory standards.
H&E staining
Mouse tumor tissues were fixed with 4% formalin (V/V) and embedded with paraffin. Tissue blocks were cut into 6 μm sections, which were then deparaffinized with xylene and exposed to EDTA antigenic retrieval buffer for antigenic retrieval. Then, the sections were stained with H&E. Digital images of organs were acquired by Nanozoomer (Hamamatsu Photonics).
Statistical analysis
All experiments were independently repeated at least three times and data were presented as the mean ± standard error. Student's t-tests were used for statistical analysis. Probability (p) values <0.05 were considered statistically significant.
Acknowledgements
This work was supported by the National Key R&D Program of China (2018YFC0115704), National Natural Science Foundations of China awarded (No. 81602794, 81773463, 81673151). This work also supported by “A Project Funded by the Priority Academic Program Development of Jiangsu Higher Education Institutions (PAPD)”.
Competing Interests
The authors have declared that no competing interest exists.
References
1. Torre LA, Bray F, Siegel RL. et al. Global Cancer Statistics, 2012. Ca-Cancer J Clin. 2015;65:87-108
2. Schipper DL, Wagenmans MJM, Peters WHM. et al. Significance of cell proliferation measurement in gastric cancer. Eur J Cancer. 1998;34:781-90
3. Gasparri R, Santonico M, Valentini C. et al. Volatile signature for the early diagnosis of lung cancer. J Breath Res. 2016:10
4. Yasufuku K. Early Diagnosis of Lung Cancer. Clinics in chest medicine. 2010;31:39 -+
5. Du Z, Fei T, Verhaak RG. et al. Integrative genomic analyses reveal clinically relevant long noncoding RNAs in human cancer. Nature structural & molecular biology. 2013;20:908-13
6. Batista PJ, Chang HY. Long Noncoding RNAs: Cellular Address Codes in Development and Disease. Cell. 2013;152:1298-307
7. Yang L, Lin C, Jin C. et al. lncRNA-dependent mechanisms of androgen-receptor-regulated gene activation programs. Nature. 2013;500:598-602
8. Lian YF, Yan CS, Xiao CX. et al. Overexpression of Lncrna Linc00460 Affects Cell Proliferation and Apoptosis by Regulating Klf2 and Cul4a Expression in Colorectal Cancer. Gut. 2018;67:A6-A
9. Yang Q, Wan Q, Zhang LT. et al. Analysis of LncRNA expression in cell differentiation. RNA biology. 2018;15:413-22
10. Wu H, Wen F, Jiang M. et al. LncRNA uc.48+is involved in the diabetic immune and inflammatory responses mediated by P2X(7) receptor in RAW264.7 macrophages. International journal of molecular medicine. 2018;42:1152-60
11. Chen HY, Pei HL, Hu WT. et al. Long non-coding RNA CRYBG3 regulates glycolysis of lung cancer cells by interacting with lactate dehydrogenase A. J Cancer. 2018;9:2580-8
12. Shen J, Lu X, Du W. et al. Lobetyol activate MAPK pathways associated with G1/S cell cycle arrest and apoptosis in MKN45 cells in vitro and in vivo. Biomedicine & pharmacotherapy = Biomedecine & pharmacotherapie. 2016;81:120-7
13. Macurek L, Benada J, Mullers E. et al. Downregulation of Wip1 phosphatase modulates the cellular threshold of DNA damage signaling in mitosis. Cell cycle. 2013;12:251-62
14. Chen NC, Chyau CC, Lee YJ. et al. Promotion of mitotic catastrophe via activation of PTEN by paclitaxel with supplement of mulberry water extract in bladder cancer cells. Scientific reports. 2016;6:20417
15. Chiu SJ, Hsu TS, Chao JI. Opposing securin and p53 protein expression in the oxaliplatin-induced cytotoxicity of human colorectal cancer cells. Toxicology letters. 2006;167:122-30
16. Zheng SE, Xiong S, Lin F. et al. Pirarubicin inhibits multidrug-resistant osteosarcoma cell proliferation through induction of G(2)/M phase cell cycle arrest. Acta pharmacologica Sinica. 2012;33:832-8
17. Kalimutho M, Minutolo A, Grelli S. et al. Satraplatin (JM-216) mediates G2/M cell cycle arrest and potentiates apoptosis via multiple death pathways in colorectal cancer cells thus overcoming platinum chemo-resistance. Cancer chemotherapy and pharmacology. 2011;67:1299-312
18. Jiang XY, Zhu XS, Xu HY. et al. Diallyl trisulfide suppresses tumor growth through the attenuation of Nrf2/Akt and activation of p38/JNK and potentiates cisplatin efficacy in gastric cancer treatment. Acta pharmacologica Sinica. 2017;38:1048-58
19. Pei H, Hu W, Guo Z. et al. Long Noncoding RNA CRYBG3 Blocks Cytokinesis by Directly Binding G-Actin. Cancer research. 2018;78:4563-72
20. Adams CL, Nelson WJ, Smith SJ. Quantitative analysis of cadherin-catenin-actin reorganization during development of cell-cell adhesion. The Journal of cell biology. 1996;135:1899-911
21. Kazazian K, Go C, Wu H. et al. Plk4 Promotes Cancer Invasion and Metastasis through Arp2/3 Complex Regulation of the Actin Cytoskeleton. Cancer research. 2017;77:434-47
22. Roos E. Cellular adhesion, invasion and metastasis. Biochimica et biophysica acta. 1984;738:263-84
Author contact
![]() Corresponding authors: Guangming Zhou, 199 Renai Road, Suzhou 215123, P. R. China. Phone: +86 512 65884829, E-mail: gmzhouedu.cn and Hailong Pei, 199 Renai Road, Suzhou 215123, P. R. China. Phone: +86 512 65884829, E-mail: hlpeiedu.cn
Corresponding authors: Guangming Zhou, 199 Renai Road, Suzhou 215123, P. R. China. Phone: +86 512 65884829, E-mail: gmzhouedu.cn and Hailong Pei, 199 Renai Road, Suzhou 215123, P. R. China. Phone: +86 512 65884829, E-mail: hlpeiedu.cn