Impact Factor ISSN: 1837-9664

 Global reach, higher impact
J Cancer 2019; 10(12):2706-2719. doi:10.7150/jca.31845 This issue Cite
Research Paper
CBX2 Regulates Proliferation and Apoptosis via the Phosphorylation of YAP in Hepatocellular Carcinoma
Jiakai Mao1,*, Yu Tian1,2,*, Chengye Wang1, Keqiu Jiang1, Rui Li1, Yifan Yao1, Rixin Zhang1, Deguang Sun1, Rui Liang1, Zhenming Gao1, Qi Wang3 ![]() , Liming Wang1
, Liming Wang1 ![]()
1. Division of Hepatobiliary and Pancreatic Surgery, Department of General Surgery, The Second Affiliated Hospital of Dalian Medical University, Dalian, Liaoning, China
2. Department of Vascular Surgery, The Second Affiliated Hospital of Dalian Medical University, Dalian, Liaoning, China
3. Department of Pulmonary Medicine, The Second Affiliated Hospital of Dalian Medical University, Dalian, Liaoning, China
*These authors have contributed equally to this work
Received 2018-11-28; Accepted 2019-5-9; Published 2019-6-2
Abstract
Chromobox 2 (CBX2), a chromobox family protein, is a crucial component of the polycomb group complex: polycomb repressive complex 1 (PRC1). Research on CBX2 as an oncogene has been published in recent years. However, the connection between CBX2 and hepatocellular carcinoma (HCC) has not been studied. In this article, based on the results of immunohistochemical (IHC) staining of HCC and adjacent liver tissue microarrays, we found that high CBX2 expression is associated with poor prognosis in HCC patients. The results of a CCK8 assay, a clonogenic survival assay and a nude mouse tumorigenicity assay showed that knockdown of CBX2 inhibited the proliferation of HCC cells. According to the results of Annexin V-FITC/propidium iodide (PI) staining-based fluorescence activated cell sorting (FACS) analysis, knockdown of CBX2 increased HCC cell apoptosis. Furthermore, the RNA-seq results revealed that knockdown of CBX2 inhibited the expression of WTIP, which is an inhibitor of the Hippo pathway. We used western blotting to validate the mechanism and discovered that knockdown of CBX2 increased the phosphorylation of YAP, which explains why knockdown of CBX2 inhibits proliferation and increases apoptosis in HCC cells. In conclusion, CBX2 could be a potential target for HCC anticancer treatment.
Keywords: Chromobox 2 (CBX2), Hepatocellular carcinoma (HCC), Hippo pathway, Yes-associated protein (YAP)
Introduction
Hepatocellular carcinoma (HCC) is the third leading cause of cancer-related death worldwide, and morbidity is much higher in men than in women [1,2]. Treatments such as transplantation, resection, and ablation are effective for early-stage HCC. However, the diagnostic rate of early-stage HCC is low. Because the symptoms of early-stage HCC are mild, doctors in the clinic often must treat advanced-stage HCC patients, for whom there are no effective treatments. Molecular targeted drugs are among the main treatment options for advanced-stage HCC. However, the low effectiveness, high incidence of drug resistance and toxicity severely restrict the prognosis of HCC patients who are treated with molecular targeted drugs [3]. Therefore, finding new molecular targeted agents for HCC has drawn increasing attention from researchers.
PcG proteins were originally identified as a set of genes that control proper body segmentation in Drosophila via repressing Hox genes. They are now widely recognized in all metazoans for their roles in a variety of biological processes, such as cell cycle control, maintenance of pluripotency, self-renewal in embryonic stem cells (ESCs), cell fate determination, and developmental control [4-6]. Some of these functions are important factors of cancer progression. Two of the PcG complexes are the polycomb repressive complexes 1 and 2 (PRC1&PRC2) [6], which are crucial members of the PcG onset process. They participate in the regulation of heterochromatin, gene expression, and developmental programs. Chromobox (CBX) family proteins such as CBX2, CBX4, CBX6, CBX7, and CBX8 are crucial components of PRC1 [7-11]. Among these CBX family proteins, CBX4, CBX6, CBX7 and CBX8 have all been shown to be related to the progression of HCC and other cancers [12-15]. CBX2, an important member of the CBX family whose C-terminal polycomb repressor box is involved in transcriptional silencing and binding to other PRC1 components, also participates in human cancer progression.
Recent studies have been published on CBX2 as an oncogene. Some studies have stated that CBX2 is a novel biomarker of cancer because CBX2 expression was higher in breast cancer tissues than in adjacent normal tissues [16]. High CBX2 expression was significantly associated with larger tumor size, lymph node metastasis, high tumor, node, metastasis (TNM) stage and positive human epidermal growth factor receptor-2 (HER-2) status in breast cancer [16]. Some studies have reported CBX2 as a potential drug target because CBX2 was recurrently upregulated in metastatic castration resistant prostate cancer (CRPC), and CBX2 expression was correlated with poor clinical outcome in prostate cancer (PCa) cohorts [17]. Furthermore, CBX2 depletion abrogated cell viability and induced caspase-3-mediated apoptosis in metastatic PCa cell lines [17]. Previous studies have shown that CBX2 influences breast and prostate cancer prognosis and progression. However, whether it affects HCC progression remains unknown. Therefore, we devoted this study to elucidating these questions.
Materials and Methods
Antibodies
Rabbit polyclonal antibody for CBX2 was purchased from Abcam (Cambridge, MA, USA) and GeneTex (Irvine, CA, USA). Rabbit polyclonal antibody for WTIP was purchased from OmnimAbs (ALHAMBRA, CA, USA). Rabbit polyclonal antibodies for YAP and P-YAP were purchased from Abcam (Cambridge, MA, USA). Rabbit polyclonal antibodies for AREG, GLI2 and GAPDH were purchased from Proteintech (Wuhan, Hubei, China). Rabbit polyclonal antibody for β-tubulin was purchased from CST (Danvers, MA, USA).
Tissue microarray and immunohistochemistry analysis
The HCC tissue microarray containing 86 primary HCC samples and their corresponding adjacent liver tissues was purchased from Shanghai Outdo Biotech (Shanghai, China). The OS for the corresponding patients was calculated from the day of surgery to the day of death or the last follow-up. Immunohistochemistry was performed using a standard methodology to analyze CBX2 protein expression. Briefly, the tissue microarray (TMA) slides were heated in citrate buffer (pH 6.0) in a pressure cooker for 6 min and incubated with the rabbit polyclonal anti-CBX2 antibody (1:200) overnight at 4°C. The TMA was then incubated with goat anti-rabbit Envision System plus-HRP (Dako Cytomation) for 30 min at room temperature and counterstained with Mayer's hematoxylin. The degrees of immunostaining were reviewed and scored by two independent pathologists who were blinded to patient outcome. Cytoplasmic staining for CBX2 was considered positive. The proportion of stained cells and the extent of the staining were used as criteria for evaluation. For each case, at least 1,000 tumor cells were analyzed, and the percentage of tumor cells with positive staining was recorded. The percentage of positive cells was assigned a score from 0 (< 5%), 1 (5-25%), 2 (> 25-50%), 3 (> 50-75%), or 4 (> 75%), and the staining intensities within the respective subcellular locations were noted as 0 = negative, 1 = weak, 2 = moderate, or 3 = strong. A final score was then calculated by multiplying the above two scores. If the final score was equal to or greater than six, the protein expression in the tumor was considered high; otherwise, the protein expression in the tumor was considered low.
Cell lines and cell culture
The human normal liver cell line L-O2 and the HCC cell lines Huh7, Bel-7402, Bel7402/5FU, Hep3B, SK-Hep-1, and 97-H were obtained from KeyGen Biotech Co., Ltd. The cell lines were cultured in RPMI 1640 (Gibco, USA) or DMEM (Gibco, USA) supplemented with antibiotics (1× penicillin/streptomycin 100 U/ml, Gibco, USA) and 10% fetal bovine serum (Gibco, USA). Cells were incubated at 37°C in a humidified atmosphere containing 5% CO2.
SiRNA transfection and stable transfection technique
CBX2 siRNA2 (Si2 forward: UCCAGCAGUUCCUCCUCUUTT, Si2 reverse: AAGAGGAGGAACUGCUGATT), siRNA3 (Si3 forward: CCAGCCUAAUGAAGGGCAUTT, Si3 reverse: AUGCCCUUCAUUAGGCUGGTT) oligonucleotides with 3′dTdT overhangs were synthesized by Shanghai GenePharma Co. (Shanghai, China). Control siRNA in the experiments refers to an All-Star nonsilencing siRNA (forward sequence: UUCUCCGAACGUGUCACGUTT, reverse sequence: ACGUGACACGUUCGGAGAATT) synthesized by Shanghai GenePharma Co. (Shanghai, China). WTIP siRNA (forward: GCGGGACUACUUCGGCAUUTT, reverse: AAUGCCGAAGUAGUCCCGCTT) oligonucleotides with 3′dTdT overhangs and overexpression of WTIP transfection vehicle were synthesized by Shanghai GenePharma Co. (Shanghai, China). Lipofectamine 2000 (Invitrogen, Carlsbad, CA, USA) was used for transfection of siRNA transfection according to the manufacturer's instructions. Recombinant lentivirus was used for stable transfection of CBX2, and knockdown (LV3-2, LV3-3), overexpression (LV5-CBX2) and NC (LV3-ctl, LV5-ctl) groups were synthesized by Shanghai GenePharma Co. (Shanghai, China), using their lentivirus products type 3 (H1/GFP&Puro for knockdown) and 5 (EF-1aF/GFP & Puro for overexpression).
Western blot
Cells were harvested and lysed in immune precipitation assay buffer (KeyGen Biotech Co., Ltd, Nanjing, China) supplemented with 1 mM phenylmethylsulfonyl fluoride (KeyGen Biotech Co., Ltd, Nanjing, China) and 1 mM phosphatase inhibitor cocktail (KeyGen Biotech Co., Ltd) for extracting whole cell protein samples. Protein concentration was determined using a bicinchoninic acid (BCA) protein assay kit (KeyGen Biotech Co., Ltd). Equal amounts of protein samples were separated on 10% SDS-PAGE gels and then transferred onto polyvinylidene difluoride membranes (Pall Corporation, Port Washington, NY, USA). The protein band intensities were evaluated using an electrochemiluminescence (ECL) western blotting kit (Advansta, Menlo Park, CA, USA) and were normalized to GAPDH or β-tubulin. All experiments were performed at least three times.
Cell viability assay
Cell viability was determined using a CCK-8 assay according to the manufacturer's instructions. Cells were seeded in 96-well plates at 2000 cells/well. At 24 hours after seeding, cells were transfected with All-Star NS siRNA or CBX2 siRNA. Then, after the cells were cultivated for 24, 48, or 72 hours, the medium was exchanged with 100 μl of RPMI-1640, and 10 μl of CCK-8 reagent was added. The cells were incubated for 3 hours at 37°C. The optical density was measured using an EnSpire TM 2300 Multilabel Reader (Perkin Elmer, Waltham, MA, USA) at 450 nm. Six replicates were prepared for each condition.
Annexin V-FITC/propidium iodide (PI) staining for apoptosis
An Annexin V-FITC/PI apoptosis kit was used to quantify the percentage of cells that underwent apoptosis. Cells cultured in 6-well plates were treated with All-Star NS siRNA or CBX2 siRNA for 48 hours. Cells were then harvested and stained with 5 μL Annexin V-FITC and 5 μL PI in 500 μL of apoptosis reaction solution at room temperature in the dark for 30 min. An Accuri C6 flow cytometer (Accuri Cytometers, Inc., Ann Arbor, MI, USA) was used to detect apoptotic cells. Cell populations in different quadrants were calculated statistically.
RNA-seq
RNA quantification and qualification: RNA degradation and contamination was monitored on 1% agarose gels. RNA purity was checked using the NanoPhotometer spectrophotometer (IMPLEN, CA, USA). RNA concentration was measured using Qubit RNA Assay Kit in Qubit 2.0 Flurometer (Life Technologies, CA, USA). RNA integrity was assessed using the RNA Nano 6000 Assay Kit of the Bioanalyzer 2100 system (Agilent Technologies, CA, USA).
Library preparation for Transcriptome sequencing: A total amount of 3 µg RNA per sample was used as input material for the RNA sample preparations. Sequencing libraries were generated using NEBNext UltraTM RNA Library Prep Kit for Illumina (NEB, USA) following manufacturer's recommendations and index codes were added to attribute sequences to each sample. Briefly, mRNA was purified from total RNA using poly-T oligo-attached magnetic beads. Fragmentation was carried out using divalent cations under elevated temperature in NEBNext First Strand Synthesis Reaction Buffer (5X). First strand cDNA was synthesized using random hexamer primer and M-MuLV Reverse Transcriptase (RNase H-). Second strand cDNA synthesis was subsequently performed using DNA Polymerase I and RNase H. Remaining overhangs were converted into blunt ends via exonuclease/polymerase activities. After adenylation of 3' ends of DNA fragments, NEBNext Adaptor with hairpin loop structure were ligated to prepare for hybridization. In order to select cDNA fragments of preferentially 150~200 bp in length, the library fragments were purified with AMPure XP system (Beckman Coulter, Beverly, USA). Then 3 µl USER Enzyme (NEB, USA) was used with size-selected, adaptor-ligated cDNA at 37°C for 15 min followed by 5 min at 95 °C before PCR. Then PCR was performed with Phusion High-Fidelity DNA polymerase, Universal PCR primers and Index (X) Primer. At last, PCR products were purified (AMPure XP system) and library quality was assessed on the Agilent Bioanalyzer 2100 system.
Clustering and sequencing (Novogene Experimental Department): The clustering of the index-coded samples was performed on a cBot Cluster Generation System using TruSeq PE Cluster Kit v3-cBot-HS (Illumia) according to the manufacturer's instructions. After cluster generation, the library preparations were sequenced on an Illumina Hiseq platform and 125 bp/150 bp paired-end reads were generated.
Quality control: Raw data (raw reads) of fastq format were firstly processed through in-house perl scripts. In this step, clean data (clean reads) were obtained by removing reads containing adapter, reads containing ploy-N and low quality reads from raw data. At the same time, Q20, Q30 and GC content the clean data were calculated. All the downstream analyses were based on the clean data with high quality.
Reads mapping to the reference genome: Reference genome and gene model annotation files were downloaded from genome website directly. Index of the reference genome was built using STAR and paired-end clean reads were aligned to the reference genome using STAR (v2.5.1b). STAR used the method of Maximal Mappable Prefix (MMP) which can generate a precise mapping result for junction reads.
Quantification of gene expression level: HTSeq v0.6.0 was used to count the reads numbers mapped to each gene. And then FPKM of each gene was calculated based on the length of the gene and reads count mapped to this gene. FPKM, expected number of Fragments Per Kilobase of transcript sequence per Millions base pairs sequenced, considers the effect of sequencing depth and gene length for the reads count at the same time, and is currently the most commonly used method for estimating gene expression levels.
Differential expression analysis: (For DESeq2 with biological replicates) Differential expression analysis of two conditions/groups (two biological replicates per condition) was performed using the DESeq2 R package (1.10.1). DESeq2 provide statistical routines for determining differential expression in digital gene expression data using a model based on the negative binomial distribution. The resulting P-values were adjusted using the Benjamini and Hochberg's approach for controlling the false discovery rate. Genes with an adjusted P-value <0.05 found by DESeq2 were assigned as differentially expressed. (For edgeR without biological replicates) Prior to differential gene expression analysis, for each sequenced library, the read counts were adjusted by edgeR program package through one scaling normalized factor. Differential expression analysis of two conditions was performed using the edgeR R package (3.12.1). The P values were adjusted using the Benjamini & Hochberg method. Corrected P-value of 0.05 and absolute foldchange of 2 were set as the threshold for significantly differential expression.
GO and KEGG enrichment analysis of differentially expressed genes Gene Ontology (GO) enrichment analysis of differentially expressed genes was implemented by the clusterProfiler R package, in which gene length bias was corrected. GO terms with corrected Pvalue less than 0.05 were considered significantly enriched by differential expressed genes. KEGG is a database resource for understanding high-level functions and utilities of the biological system, such as the cell, the organism and the ecosystem, from molecular-level information, especially large-scale molecular datasets generated by genome sequencing and other high-through put experimental technologies (http://www.genome.jp/kegg/). We used clusterProfiler R package to test the statistical enrichment of differential expression genes in KEGG pathways.
SNP analysis: GATK2 (v3.2.1) software was used to perform SNP calling and SnpEff software was used to annotation for the Variablesite.
AS analysis: Alternative Splicing is an important mechanism for regulate the expression of genes and the variable of protein. rMATS (3.2.1) software was used to analysis the ASevent.
Fusion Analysis: Fusion gene is refers to the two genes of all or part of the sequences perform fusion, results of the chimeric gene, usually caused by reasons such as chromosome translocation and problem. We used SOAPfuse (1.27) software analysis and detection of fusion genes.
Animal studies
Female nu/nu mice (4-6 weeks old) were used, and all animal experiments were maintained in a specific pathogen-free (SPF) Laboratory Animal Center at Dalian Medical University. Four groups (LV5-ctl, LV5-up, LV3-ctl, LV3-3) of stably transfected Huh7 cells (5×10⁶ in 100 μL PBS) were inoculated subcutaneously into the flanks of 20 nude mice (5 for each group). Tumors were measured with a caliper every 4 days, and the tumor volume was calculated using the formula V = 1/2 (width 2× length). At 20 days after tumor cell inoculation, all mice were terminated with ether anesthesia, and the total weight of the tumors in each mouse was measured. Tumor specimens were harvested for H&E staining and CBX2, WTIP, and YAP protein immunohistochemistry staining.
All animal maintenance and procedures were carried out in strict accordance with the recommendations established by the Animal Care and Ethics Committee of Dalian Medical University and the guidelines of the U.S. National Institutes of Health Guide for the Care and Use of Laboratory Animals. The protocol was approved by the Animal Care and Ethics Committee of Dalian Medical University.
Statistical analysis
All experiments were repeated three times. The chi-squared test, analysis of variance, and two-tailed Student's t-test were performed as appropriate. The cumulative survival probability was evaluated using the Kaplan-Meier method, and the differences were assessed using the log-rank test. Cox multivariate regression analysis was used to determine independent prognostic factors. A p-value˂0.05 defined statistical significance. SPSS 20.0 software was used for all statistical analyses.
Results
CBX2 is highly expressed in human HCC patient tissues and is associated with poor prognosis in HCC patients
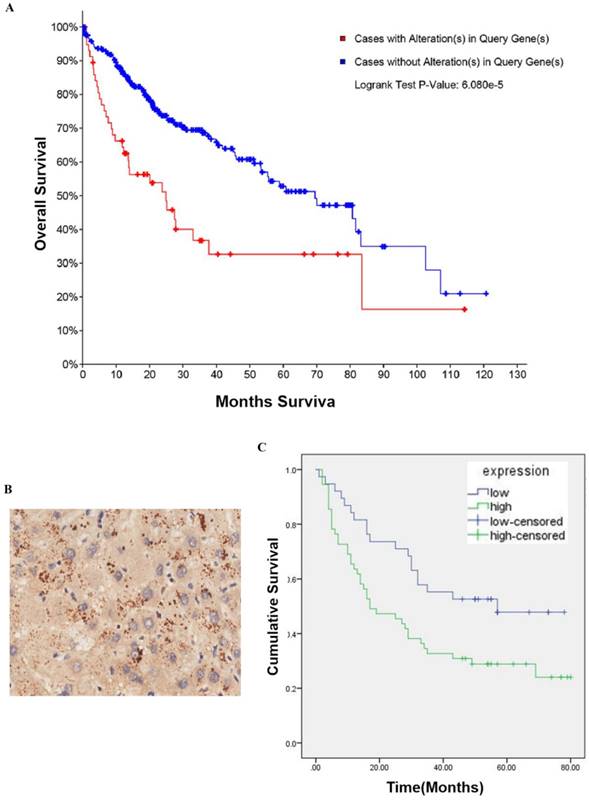
To determine whether CBX2 is related to HCC, we performed searches of online databases. According to data from The Cancer Genome Atlas (TCGA) (2016), CBX2 mRNA was altered (amplification and upregulation) in approximately 18% of HCC cases (360 cases total). Furthermore, based on the overall survival (OS) Kaplan-Meier estimate, the OS of patients with CBX2 mRNA alterations was worse than that of patients without alterations (P<0.001) (Figure 1A). To further explore whether CBX2 is an important factor in determining the clinical outcomes of HCC patients, we examined the expression of CBX2 in 86 primary HCC patient tissues and their corresponding adjacent liver tissues in a tissue microarray by immunohistochemical (IHC) staining. Positive immunoreactivity for CBX2 was primarily observed in the cell cytoplasm (Figure 1B). The segregation of patients into CBX2-positive and CBX2-negative groups did not reveal any significant correlations of CBX2 expression with the clinical pathological parameters of age, sex, gender, or TNM stage (Table 1). Furthermore, the OS analysis indicated that patients with low CBX2 expression had significantly higher survival rates than patients with high CBX2 expression (P=0.014) (Figure 1C). Multivariate analyses revealed that CBX2 expression, pathology grade and TNM stage are independent prognostic factors for patient survival (Table 2). These results showed that high CBX2 expression is important in tumor progression and serves as an independent molecular marker for poor HCC prognosis.
CBX2 is highly expressed in human HCC patient tissues and is associated with poor prognosis in HCC patients. (A) CBX2 mRNA alteration is negatively associated with the OS of human HCC patients. Kaplan-Meier analysis of OS was performed for 377 primary human HCC patients with high or low CBX2 expression (P<0.001, log-rank test). (B) IHC staining of HCC tissue microarray and positive immunoreactivity for CBX2 were primarily observed in the cell cytoplasm. (C) CBX2 expression was negatively associated with the OS of human HCC patients. Kaplan-Meier analysis of OS with high or low CBX2 expression in 86 primary human HCC patients (P = 0.014, log-rank test).
Correlation between CBX2expression and clinicopathological characteristics
| Variables | CBX2 expression | Total | χ2 | P | ||
|---|---|---|---|---|---|---|
| Low | High | |||||
| Age(y) | 0.628 | 0.428 | ||||
| ≤50 | 15 | 17 | 32 | |||
| >50 | 23 | 27 | 60 | |||
| Sex | 0.387 | 0.534 | ||||
| Female | 5 | 5 | 10 | |||
| Male | 33 | 50 | 83 | |||
| Grade | 0.027 | 0.869 | ||||
| I/II | 32 | 47 | 79 | |||
| III | 6 | 8 | 14 | |||
| TNM stage | 0.315 | 0.575 | ||||
| I/II | 20 | 23 | 43 | |||
| III/IV | 17 | 25 | 42 | |||
Multiple analyses of factors associated with Overall survival of Liver carcinoma patients
| Variables | Hazard ratio | 95%CI | P |
|---|---|---|---|
| CBX2 expression | 1.952 | 1.128-3.377 | 0.017* |
| Age | 0.932 | 0.544-1.599 | 0.799 |
| Sex | 1.453 | 0.581-3.635 | 0.424 |
| Grade | 1.958 | 1.131-3.392 | 0.016* |
| T stage | 2.07 | 1.382-3.100 | 0* |
| N stage | 3.119 | 0.421-23.103 | 0.266 |
| M stage | 41.666 | 3.778-459.503 | 0.002* |
| TNM stage | 2.17 | 1.408-3.344 | 0* |
CBX2 is highly expressed in HCC cell lines
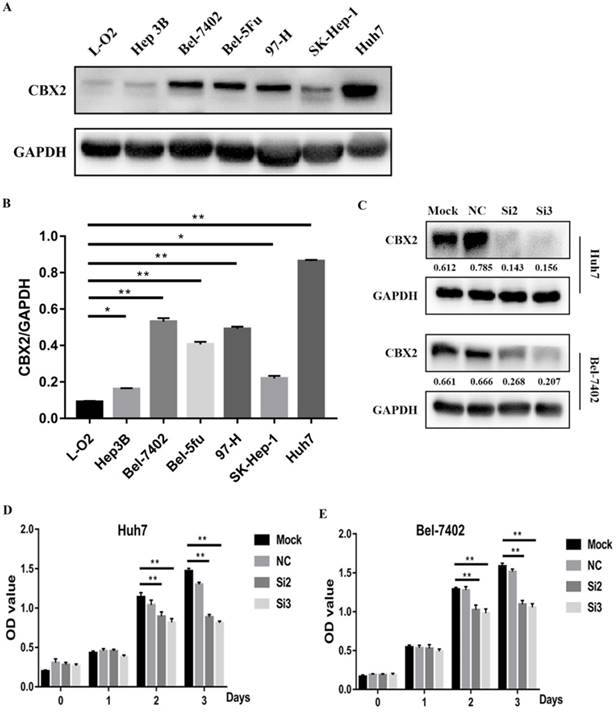
To further study the role of CBX2 in HCC progression, we performed a pre-experiment to compare the relative expression of CBX2 protein between liver cells and HCC cells by western blot. We tested several HCC cell lines (Hep3B, Bel-7402, Bel-5Fu, 97-H, SK-Hep-1, Huh7) and one normal liver cell line (L-O2). The results showed that compared with L-O2 cells, the expression of CBX2 protein was significantly increased in Bel-7402, Huh7, Bel-5Fu, and 97-H cells (Figure 2A, B). We chose Bel-7402 and Huh7 cells to perform the following experiments.
CBX2 is highly expressed in HCC cell lines, and knockdown of CBX2 decreases the proliferation of human HCC cells in vitro. (A) High CBX2 expression was detected in HCC cells, including Hep3B, Bel-7402, Bel-5Fu, 97-H, SK-Hep-1 and Huh7 cells. Protein levels were monitored by western blot. (B) The intensities of western blots were quantified using Image Lab 5.0 software and were normalized to GAPDH. (C) Two of the CBX2 siRNAs (Si2 and Si3) significantly reduced the expression of CBX2 protein in both Huh7 and Bel-7402 cells. (D, E) CCK-8 assay demonstrated that knockdown of CBX2 by CBX2 siRNAs (Si2 and Si3) significantly decreased the proliferation of Huh7 and Bel-7402 cells.(* P < 0.05, ** P < 0.01).
CBX2 knockdown decreases proliferation and increases apoptosis in human HCC cells in vitro
To verify whether knockdown of CBX2 could decrease the proliferation of human HCC cells, CBX2 siRNA was used to silence the expression of CBX2 in Huh7 and Bel-7402 cells. The efficiency of transfection was evaluated by western blot. The results showed that two of the CBX2 siRNAs (Si2 and Si3) significantly reduced the expression of CBX2 protein in both Huh7 and Bel-7402 cells (Figure 2C). Then, we performed a CCK-8 assay to evaluate the proliferation ability of Huh7 and Bel-7402 cells and CBX2 knockdown cells. The cells were divided into 4 groups, and each group included mock, normal control (NC), Si2 and Si3 cells. The results showed that the optical density (OD) values of Si2 and Si3 were significantly lower than the OD value of mock. Thus, knockdown of CBX2 by CBX2 siRNAs (Si2 and Si3) significantly decreased the proliferation ability of Huh7 and Bel-7402 cells (Figure 2D, E).
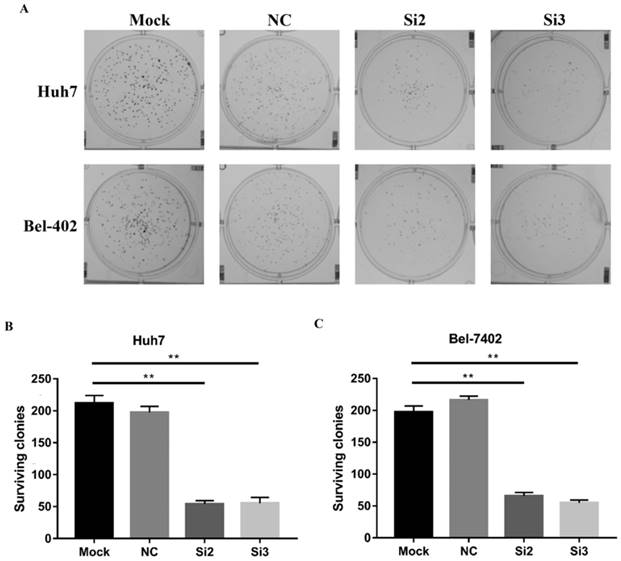
Then, we performed a clonogenic survival assay using CBX2 siRNA (Si2 and Si3)-transfected Huh7 and Bel7402 cells to further confirm the influence of CBX2 on HCC cell proliferation in vitro. A clonogenic assay showed that the colony numbers of the Si2 and Si3 groups were lower than those of the mock groups (Figure 3A, B, C). Thus, knockdown of CBX2 by siRNA reduced the colony number of Huh7 and Bel-7402 cells, which is further proof that knocking down CBX2 decreases the proliferation ability of HCC cells in vitro.
Knockdown of CBX2 decreases the proliferation of human HCC cells in vitro. (A, B, C) A clonogenic survival assay was used to measure the clonogenicity of Huh7 and Bel-7402 cells treated with Si2 and Si3. The results were analyzed and showed the average number of surviving colonies. The data are presented as the mean ± SD of three independent experiments. (* P < 0.05, ** P < 0.01).
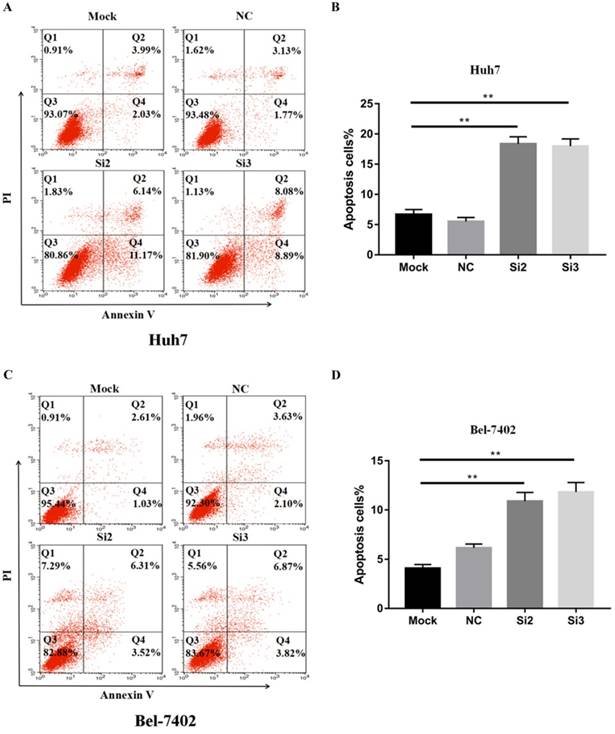
To confirm that apoptosis contributes to the inhibitory effects of CBX2 knockdown on HCC cell proliferation in vitro, we performed Annexin V-FITC/propidium iodide (PI) staining-based fluorescence activated cell sorting (FACS) analysis on Huh7, Bel-7402 cells and CBX2 knockdown cells. The results showed that the number of apoptotic cells (%) in the Si2 and Si3 groups was higher than that in the mock groups (Figure 4A, B, C, D). Thus, knockdown of CBX2 increased the apoptosis of Huh7 and Bel-7402 cells.
Knockdown of CBX2 increases the apoptosis of human HCC cells in vitro. (A, C) Knockdown of CBX2 increases apoptosis of Huh7 and Bel 7402 cells. Apoptotic cells were detected by Annexin V-PI dual staining. Representative data from three independent experiments are shown. The total number of cells in the Q2 and Q4 quadrants was regarded as apoptotic cells. (B, D) Percentages of apoptotic Huh7 and Bel 7402 cells are shown in the bar graph (right panel). The data are the means ± SD of three independent assays (** P < 0.01).
Knockdown of CBX2 inhibits WTIP and increases the phosphorylation of YAP
To determine the mechanism by which CBX2 knockdown decreases proliferation and increases apoptosis in human HCC cells. We established stable CBX2 knockdown and overexpression in Huh7 and Bel-7402 cells using lentiviruses. The efficiency of transfection was evaluated by western blot. The results showed that CBX2 protein expression in the knockdown groups (LV3-Si3) was significantly lower than in the control groups (LV3-ctl), and CBX2 protein expression in the upregulated groups (LV5-CBX2) was significantly higher than in the control groups (LV5-clt) in both Huh7 and Bel-7402 cells (Figure 5C, D). Then, we selected Huh7 cells stably overexpressing CBX2 to perform the RNA-seq test with the control group to determine whether knockdown of CBX2 decreased the proliferation and increased the apoptosis of HCC cells. The RNA-seq results showed some pathway enrichment differences between the knockdown and control groups according to the Kyoto Encyclopedia of Genes and Genomes (KEGG) database (Figure 5A). Among the pathways revealed by RNA-seq, the Hippo pathway is an important pathway for maintaining the balance between cell proliferation and apoptosis. Among the differential genes found by RNA-seq, WTIP was one of the significant differential genes (*P<0.05) that influenced the Hippo pathway (Figure 5B). According to the KEGG pathway database and previous reports, the Hippo pathway affects HCC cell proliferation and apoptosis by regulating Yes-associated protein (YAP) [18, 19]. YAP is regulated via phosphorylation, which inactivates YAP. WTIP can inhibit the phosphorylation of YAP through the Hippo pathway [20]. We assumed that knockdown of CBX2 inhibits the expression of WTIP and causes the phosphorylation of YAP, thus affecting the proliferation and apoptosis of HCC cells.
Knockdown of CBX2 inhibits WTIP and increases the phosphorylation of YAP. (A) RNA-seq showed some pathway enrichment differences between the CBX2 knockdown group and the control group according to the KEGG database. (B) Heatmap of the RNA differentiation cluster between the CBX2 knockdown group and the control group (the result shown in this figure is a portion of the entire heatmap). Compared with the control group, the RNA level of WTIP decreased significantly in the CBX2 knockdown group (P<0.05). (C) CBX2 protein was decreased in LV3-Si3 cells. CBX2, WTIP, YAP, P-YAP, AREG and GLI2 protein levels in the LV3-ctl and LV3-Si3 groups of Huh7 and Bel7402 cells were determined using western blot. Band intensities were quantified using Image Lab 5.0 software and were normalized to GAPDH. The data are presented as the mean ± SD of three separate experiments (*P<0.05). (D) CBX2 protein was increased in LV5-CBX2 cells. CBX2, WTIP, YAP, P-YAP, AREG and GLI2 protein levels in the LV5-ctl and LV5-CBX2 groups of Huh7 and Bel7402 cells were determined using western blot. Band intensities were quantified using Image Lab 5.0 software and were normalized to GAPDH. The data are presented as the mean ± SD of three separate experiments (*P<0.05).
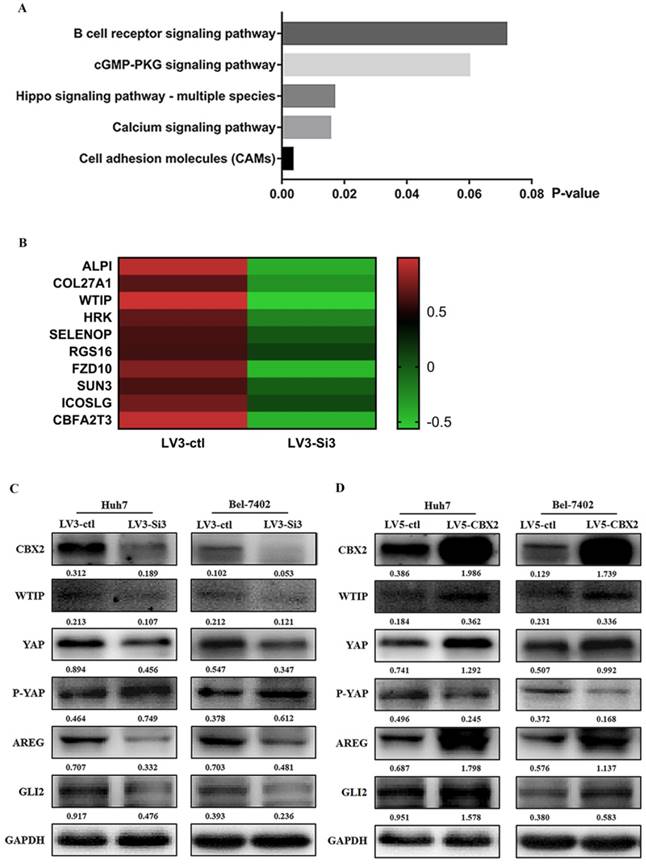
To prove this assumption, we used western blotting to check the relative expression of CBX2, WTIP and some proteins in the Hippo pathway using Huh7- and Bel7402-stably transfected cells. The western blot results showed that when the expression of CBX2 was downregulated, the expression of WTIP and YAP were inhibited while the expression of P-YAP was elevated in both Huh7 and Bel-7402 cells. The expression of downstream targets such as AREG and Gli2, which are oncogenes that affect cell proliferation and cell survival [21, 22], also decreased. When the expression of CBX2 was upregulated, the expression of WTIP, YAP, P-YAP, AREG and Gli2 proteins was decreased (Figure 5C, D).
To further validate the relationship of CBX2, WTIP and the phosphorylation of YAP, we upregulated WTIP in CBX2 knockdown Huh7 cells and performed western blotting to determine the expression of YAP and P-YAP. The results showed that compared with the just CBX2 knockdown group, the expression of YAP increased and the expression of P-YAP decreased in the WTIP-upregulated group (Figure 6A). This result proved that WTIP overexpression reversed the increase in YAP phosphorylation caused by CBX2 knockdown in Huh7 cells. Then, we downregulated WTIP in CBX2 overexpressing Huh7 cells, and the result showed that the inhibition of YAP phosphorylation caused by CBX2 overexpression was reversed by the downregulation of WTIP (Figure 6A).
Further prove knockdown of CBX2 inhibits WTIP and increases the phosphorylation of YAP. (A) Overexpression of WTIP in CBX2 knockdown Huh7 cells. CBX2, WTIP, YAP and P-YAP protein levels in the test and NC groups were determined using western blot. Knockdown of WTIP in CBX2-overexpressing Huh7 cells. CBX2, WTIP, YAP and P-YAP protein levels in the test and NC groups were determined using western blot. Band intensities were quantified using Image Lab 5.0 software and were normalized to GAPDH. The data are presented as the mean ± SD of three separate experiments (*P<0.05). (B) Overexpression of WTIP in CBX2 knockdown Huh7 cells (G2) and just CBX2 knockdown Huh7 cells (G1); knockdown of WTIP in CBX2-overexpressing Huh7 cells (G4) and just CBX2-overexpressing Huh7 cells (G3). Overexpression of WTIP reduced the increased apoptosis caused by knockdown of CBX2 in Huh7 cells. Knockdown of WTIP increased the apoptosis of Huh7 cells. Apoptotic cells were detected by Annexin V-PI dual staining. Representative data from three independent experiments are shown. The total number of cells in the Q2 and Q4 quadrants was regarded as the total apoptotic cells. (C) Percentages of apoptotic Huh7 cells are shown in the bar graph. The data are the means ± SD of three independent assays (** P < 0.01).
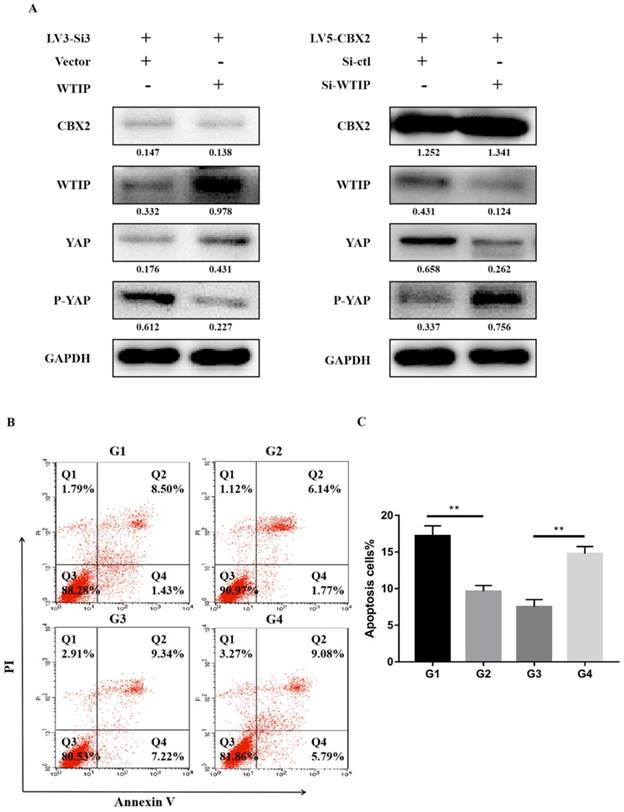
We also performed Annexin V-FITC/PI staining-based FACS analysis on the WTIP upregulated, CBX2 knockdown (G2) group and just CBX2 knockdown (G1) group. The results showed that overexpression of WTIP reduced the increased apoptosis caused by knockdown of CBX2 in Huh7 cells (Figure 6B, C). We tested the WTIP downregulated, CBX2 overexpression (G4) group and just CBX2 overexpression (G3) group, and the results showed that knockdown of WTIP increased Huh7 cell apoptosis (Figure 6B, C).
These results indicated that knockdown of CBX2 inhibited the expression of WTIP, which increased the phosphorylation of YAP. Therefore, knockdown of CBX2 inhibits proliferation and increases apoptosis in HCC cells.
Knockdown of CBX2 inhibits hepatocellular carcinoma proliferation in vivo
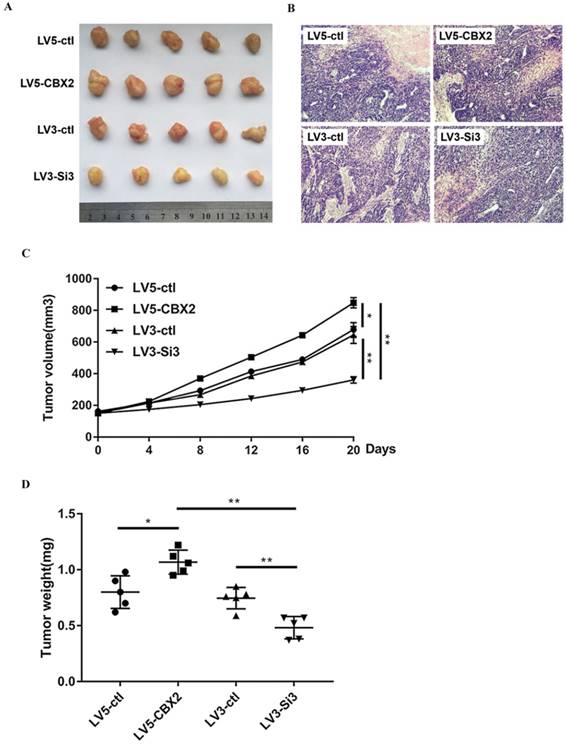
To determine whether knockdown of CBX2 has the same effect on HCC in vivo and in vitro, we cultured stably-transfected Huh7 cells and subcutaneously injected the cells into nude mice. We measured the volume of tumors every four days and executed the mice 20 days after the injection. Compared with the control group, the tumors in the CBX2 knockdown group grew at a slower rate. By 20 days, the volume of tumors of the CBX2 knockdown group was approximately half that of the control group (Figure 7A, C). After execution, we dissected and weighed the tumors. The tumors of the CBX2 knockdown group were lighter in weight than those of the control group (Figure 7D). Moreover, the volume and weight of the CBX2 upregulation group and the control group were also recorded and compared. The results showed that both the volume and weight of tumors of the CBX2-upregulated group were higher than those of the control group (Figure 7C, D). These results proved that knockdown of CBX2 decreases tumor proliferation in vivo.
Knockdown of CBX2 inhibits hepatocellular carcinoma proliferation in vivo. (A) Knockdown of CBX2 decreases the tumor size. We cultivated stable transfected Huh7 cells (LV3-ctl, LV3-Si3, LV5-ctl, LV5-CBX2) and injected the cells into nude mice subcutaneously for 20 days. (B) H&E staining results prove four groups of tumors are malignant tumors.(C) Knockdown of CBX2 decreases the tumor volumes. Upregulation of CBX2 increases the tumor volumes. The data are presented as the mean ± SD of three independent experiments. (*P < 0.05, **P < 0.01). (D) Knockdown of CBX2 decreases the tumor weights. Upregulate of CBX2 increases the tumor weights. The data are presented as the mean ± SD of three independent experiments. (*P < 0.05, **P < 0.01).
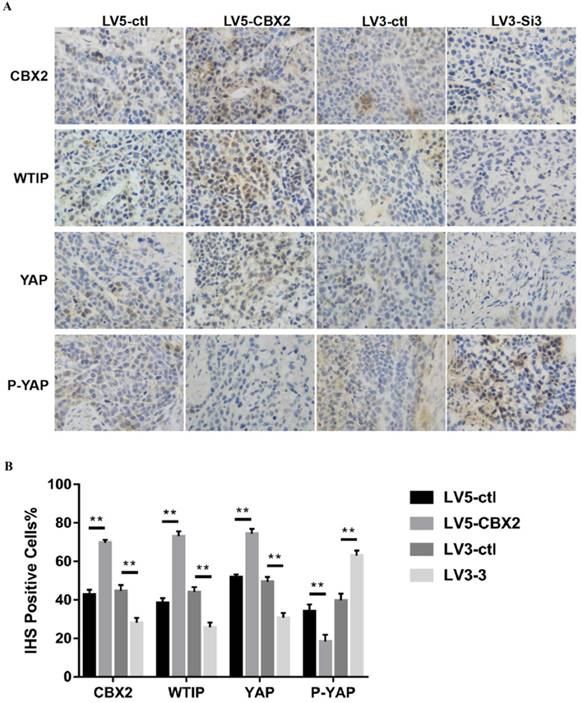
To further prove the results, we performed an animal experiment to verify the mechanism discussed in the in vitro experiments. We performed H&E staining and immunohistochemistry (IHC) staining on the tumors. The H&E staining results showed that all four groups of tumors had tumor cell characteristics (Figure 7B). Then, we used CBX2, WTIP, YAP and P-YAP antibodies to perform IHC staining. The rate of CBX2 positivity according to IHC was higher in the CBX2 upregulated group than in the control group and lower in the CBX2 knockdown group than in the control group, which proved the reliability of stably transfected Huh7 cells cultured in vivo. The IHC positive rates of WTIP and YAP were lower and the IHC positive rate of P-YAP was higher in the CBX2 knockdown group than in the control group; furthermore, the IHC positive rates of WTIP and YAP were higher, and IHC positive rate of P-YAP was lower in the CBX2 overexpression group than in the control group (Figure 8A, B). Thus, the IHC staining results supported the results obtained by western blot in vitro. The IHC results were quantized by the IHS (Intensity, Hue, Saturation) marking system.
Knockdown of CBX2 inhibits hepatocellular carcinoma proliferation in vivo. (A) Knockdown of CBX2 decreases WTIP and YAP protein levels in vivo. Upregulate of CBX2 increases WTIP and YAP protein levels in vivo. Representative IHC staining images showing the staining of CBX2, WTIP and YAP in tumors tissue samples obtained at the end point. (B) The IHC staining images were analyzed and showed the average percentage of positive cells. The data are presented as the mean ± SD of three independent experiments. (** P < 0.01).
Discussion
As the symptoms of early-stage HCC are mild, patients are often diagnosed with HCC in the advanced stage. Furthermore, HCC is not sensitive to traditional radiotherapy or chemotherapy. For these reasons, the prognosis of HCC is often poor, and very few choices, mainly including palliative operation, transcatheter arterial chemoembolization (TACE) and molecular targeted treatments, are available to patients and doctors. For patients with HCC diagnosed at an advanced stage, sorafenib is the only choice for use as a systemic therapy, while potentially curative treatments, such as resection and liver transplantation, are merely applicable for patients diagnosed at an early stage [23]. However, the development of resistance to sorafenib has raised concerns in recent years due to the high-level heterogeneity among individual responses to sorafenib treatment [24]. Therefore, identifying new treatment targets to promote the effectiveness of molecular targeted treatment for HCC has attracted increasing attention.
PcG proteins are important epigenetic regulators that regulate the methylation of H3K4 and H3K27 histones [25]. It was reported that mammalian CBX proteins exhibit differential binding to methylated histone tails. CBX2 and CBX7 bind to both H3K9Me3 and H3K27Me3 [26]. CBX2 is an important component of the classic PcG complex, PRC1. PRC1 plays an important role in epigenetic regulation. Epigenetic aberrations can give rise to all classic hallmarks of cancer [27]. In this study, we found that CBX2 knockdown increased apoptosis and inhibited the proliferation of HCC cells, causing YAP phosphorylation. However, whether the epigenetic pathway is activated by this progression is also an important scientific issue and deserves further study.
Wt1-interacting protein (WTIP), an Ajuba family LIM domain scaffold protein expressed in podocytes, coordinates cell adhesion changes and transcriptional responses to regulate podocyte phenotypic plasticity [28]. Downregulation of WTIP abolished BRCA2 centrosome localization and abnormal cell division in HeLa cells [29]. It has been reported that WTIP can work as a crucial point of crosstalk between EGFR and Hippo signaling and suppress the Hippo pathway [30]. Thus, downregulation of WTIP may reduce the inhibition of the Hippo pathway and cause the phosphorylation of YAP.
YAP, an oncogene of HCC, is a transcriptional regulator whose activity is key for the growth of organs and for cell proliferation. YAP can reprogram cancer cells into cancer stem cells and incite tumor initiation, progression and metastasis. A previous study showed that YAP may affect not only HCC cells but also apoptosis and proliferation in other types of cancer cells [31-33]. Thus, YAP is an appealing therapeutic target in anticancer medicine [34]. YAP is inactivated by phosphorylation, as phosphorylated YAP (p-YAP) cannot enter the nucleus and degrades in the cytoplasm. Phosphorylation of YAP is regulated by the Hippo pathway [35, 36]. In this study, we demonstrated that knockdown of CBX2 caused a decrease in WTIP expression, provoked the Hippo pathway [37], and caused the phosphorylation of YAP. However, these findings deserve further work to more deeply elucidate the mechanism.
In summary, our results demonstrate that knockdown of CBX2 expression in HCC cells increases HCC cell apoptosis, suppresses HCC cell proliferation and increases the phosphorylation of YAP both in vitro and in vivo. This study offers a novel viable option for HCC molecular targeted treatment.
Acknowledgements
This study was supported by funds from the National Natural Science Foundation of China (No. 81272368 and 81471755) and the Clinical Capability Construction Project for Liaoning Provincial Hospitals (LNCCC-B03-2014).
Competing Interests
The authors have declared that no competing interest exists.
References
1. Liu CY, Chen KF, Chen PJ. Treatment of Liver Cancer. Cold Spring Harb Perspect Med. 2015;5(9):a021535
2. Lindsey A. Torre, Freddie Bray, Rebecca L.Siegel, et al. Global Cancer Statistics, 2012. CA CANCER J CLIN. 2015;65(2):87-108
3. Kudo M. Systemic Therapy for Hepatocellular Carcinoma: 2017 update. Oncology. 2017;93(Suppl 1):135-146
4. Vincenz C, Kerppola TK. Different polycomb group CBX family proteins associate with distinct regions of chromatin using nonhomologous protein sequences. PNAS. 2008;105(43):16572-16577
5. Sparmann A, van Lohuizen M. Polycomb silencers control cell fate, development and cancer. Nat Rev Cancer. 2006;6(11):846-56
6. Ma RG, Zhang Y, Sun TT, Cheng B. Epigenetic regulation by polycomb group complexes: focus on roles of CBX proteins. J Zhejiang Univ Sci B. 2014May;15(5):412-28
7. Pearce JJ, Singh PB, Gaunt SJ. The mouse has a Polycomb-like chromobox gene. Development. 1992;114:921-929
8. Alkema MJ, Jacobs J, Voncken JW, Jenkins NA, Copeland NG, Satijn DP, Otte AP, Berns A, van Lohuizen M. MPc2, a new murine homolog of the Drosophila polycomb protein is a member of the mouse polycomb transcriptional repressor complex. J Mol Biol. 1997;273:993-1003
9. Bardos JI, Saurin AJ, Tissot C, Duprez E, Freemont PS. HPC3 is a new human polycomb orthologue that interacts and associates with RING1 and Bmi1 and has transcriptional repression properties. J Biol Chem. 2000;275:28785-28792
10. Gil J, Bernard D, Martinez D, Beach D. Polycomb CBX7 has a unifying role in cellular lifespan. Nat Cell Biol. 2004;6:67-72
11. Bernstein E, Duncan EM, Masui O, Gil J, Heard E, Allis CD. Mouse polycomb proteins bind differentially to methylated histone H3 and RNA and are enriched in facultative heterochromatin. Mol Cell Biol. 2006;26(7):2560-9
12. Yongyu Z, Lewei Y, Jian L, Yuqin S. MicroRNA-18a targets IRF2 and CBX7 to promote cell proliferation in hepatocellular carcinoma. Oncol Res. 2018 [Epub ahead of print]
13. Gao SB, Sun SL, Zheng QL, Zhang L, Zhu Y, Jin GH, Xue LX. Genetic alteration and misexpression of Polycomb group genes in hepatocellular carcinoma. Am J Cancer Res. 2015;5(10):2969-79
14. Li J, Xu Y, Long XD, Wang W, Jiao HK. et al. Cbx4 Governs HIF-1 a to Potentiate Angiogenesis of Hepatocellular Carcinoma by Its SUMO E3 Ligase Activity. Cancer Cell. 2014;25:118-131
15. Zheng H, Jiang WH, Tian T, Tan HS. et al. CBX6 overexpression contributes to tumor progression and is predictive of a poor prognosis in hepatocellular carcinoma. Oncotarget. 2017;8:18872-18884
16. Chen WY, Zhang XY, Liu T, Liu Y, Zhao YS, Pang D. Chromobox homolog 2 protein: A novel biomarker for predicting prognosis and Taxol sensitivity in patients with breast cancer. Oncol Lett. 2017;13:1149-1156
17. Clermont PL, Crea F, Chiang YT, Lin D, Zhang A. et al. Identification of the epigenetic reader CBX2 as a potential drug target in advanced prostate cancer. Clinical Epigenetics. 2016;8:16
18. Steven W Plouffe, Audrey W Hong, Kun-Liang Guan. Disease implications of the Hippo/YAP pathway. Trends Mol Med. 2015;21(4):212-222
19. Perra A, Kowalik MA, Ghiso E, Ledda-Columbano GM. et al. YAP activation is an early event and a potential therapeutic target in liver cancer development. J Hepatol. 2014;61(5):1088-96
20. Das Thakur M, Feng Y, Jagannathan R, Seppa MJ, Skeath JB, Longmore GD. Ajuba LIM Proteins are Negative Regulators of the Hippo Signaling Pathway. Curr Biol. 2010;20(7):657-662
21. Zhao B, Wei X, Li W, Udan RS, Yang Q, Kim J. et al. Inactivation of YAP oncoproteinby the Hippo pathway is involved in cell contact inhibition and tissue growth control. Genes Dev. 2007;21:2747-61
22. Hao Y, Chun A, Cheung K, Rashidi B, Yang X. Tumor suppressor LATS1 is a negative regulator of oncogene YAP. J Biol Chem. 2008;283:5496-509
23. J. Lo, E.Y. Lau, R.H. Ching, B.Y. Cheng, M.K. Ma, I.O. Ng, et al. NF-kappaB mediated CD47 upregulation promotes sorafenib resistance and its blockade synergizes the effect of sorafenib in hepatocellular carcinoma, Hepatology. 2015;62(2):534-45
24. Chen J, Jin R, Zhao J, Liu J, Ying H. et al. Potential molecular, cellular and microenvironmental mechanism of sorafenib resistance in hepatocellular carcinoma. Cancer Lett. 2015;367(1):1-11
25. Dawson MA. The cancer epigenome: Concepts, challenges, and therapeutic opportunities. Science. 2017;355:1147-1152
26. Bernstein E, Duncan EM, Masui O, Gil J, Heard E, Allis CD. Mouse polycomb proteins bind differentially to methylated histone H3 and RNA and are enriched in facultative heterochromatin. Mol Cell Biol. 2006;26(7):2560-9
27. Flavahan WA, Gaskell E, Bernstein BE. Epigenetic plasticity and the hallmarks of cancer. Science. 2017;357:6348
28. Kim JH, Mukherjee A, Madhavan SM, Konieczkowski M, Sedor JR. WT1-interacting protein (Wtip) regulates podocyte phenotype by cell-cell and cell-matrix contact reorganization. Am J Physiol Renal Physiol. 2012;302(1):F103-15
29. Zhang J, Xu J, Wang G, Sun P, Yan T, Zhao X. WTIP interacts with BRCA2 and is essential for BRCA2 centrosome localization in cervical cancer cell. Arch Gynecol Obstet. 2016;294(6):1311-1316
30. Reddy BV1, Irvine KD. Regulation of Hippo signaling by EGFR-MAPK signaling through Ajuba family proteins. Dev Cell. 2013;24(5):459-71
31. Tu K, Yang W, Li C, Zheng X, Lu Z, Guo C, Yao Y, Liu Q. Fbxw7 is an independent prognostic marker and induces apoptosis and growth arrest by regulating YAP abundance in hepatocellular carcinoma. Mol Cancer. 2014;13:110
32. Cao JJ, Zhao XM, Wang DL. et al. YAP is overexpressed in clear cell renal cell carcinoma and its knockdown reduces cell proliferation and induces cell cycle arrest and apoptosis. Oncol Rep. 2014;32(4):1594-600
33. Moroishi T, Hansen CG, Guan KL. The emerging roles of YAP and TAZ in cancer. Nat Rev Cancer. 2015;15(2):73-79
34. Piccolo S, Dupont S, Cordenonsi M. The biology of YAP/TAZ: hippo signaling and beyond. Physiol Rev. 2014;94(4):1287-312
35. Liu CY, Zha ZY, Zhou X, Zhang H, Huang W, Zhao D, Li T, Chan SW, Lim CJ, Hong W, Zhao S, Xiong Y, Lei QY, Guan KL. The hippo tumor pathway promotes TAZ degradation by phosphorylating a phosphodegron and recruiting the SCF-TrCP E3 ligase. J Biol Chem. 2010;285:37159-37169
36. Zhao B, Wei X, Li W, Udan RS, Yang Q, Kim J, Xie J, Ikenoue T, Yu J, Li L, Zheng P, Ye K, Chinnaiyan A, Halder G, Lai ZC, Guan KL. Inactivation of YAP oncoprotein by the Hippo pathway is involved in cell contact inhibition and tissue growth control. Genes Dev. 2007;21:2747-2761
37. Reddy BV, Irvine KD. Regulation of Hippo signaling by EGFR-MAPK signaling through Ajuba family proteins. Dev Cell. 2013;24(5):459-71
Author contact
![]() Corresponding authors: Liming Wang, e-mail: wangbcc259com; Qi Wang, e-mail: wqdlmucom
Corresponding authors: Liming Wang, e-mail: wangbcc259com; Qi Wang, e-mail: wqdlmucom