Impact Factor ISSN: 1837-9664

 Global reach, higher impact
J Cancer 2019; 10(10):2261-2275. doi:10.7150/jca.31077 This issue Cite
Research Paper
Small Nucleolar RNA 71A Promotes Lung Cancer Cell Proliferation, Migration and Invasion via MAPK/ERK Pathway
Guiliang Tang1, Zihang Zeng1, Wenjie Sun1, Shuying Li1, Chengcheng You1, Fang Tang1, Shan Peng1, Shijing Ma1, Yuan Luo1, Jieyu Xu1, Xiaoli Tian1, Nannan Zhang1, Yan Gong2 ![]() , Conghua Xie1,3,4
, Conghua Xie1,3,4 ![]()
1. Department of Radiation and Medical Oncology, Zhongnan Hospital of Wuhan University, Wuhan, Hubei 430071, China
2. Department of Biological Repositories, Zhongnan Hospital of Wuhan University, Wuhan, Hubei 430071, China
3. Hubei Key Laboratory of Tumor Biological Behaviors, Zhongnan Hospital of Wuhan University, Wuhan, Hubei 430071, China
4. Hubei Cancer Clinical Study Center, Zhongnan Hospital of Wuhan University, Wuhan, Hubei 430071, China
Received 2018-10-31; Accepted 2019-3-14; Published 2019-5-21
Abstract
Objective: Increasing evidence suggested that dysregulated small nucleolar RNAs (snoRNAs) were involved in tumor development. The roles of snoRNA 71A (SNORA71A) in the progression of non-small cell lung cancer (NSCLC) remained unclear.
Methods: Dataset GSE19188 from Gene Expression Omnibus (GEO) database was downloaded to detect the expression levels of SNORA71A in NSCLC tissues. The biological significance of SNORA71A was explored by loss-of-function analysis both in vitro and in vivo.
Results: SNORA71A was overexpressed in NSCLC tissues compared with normal tissues, and upregulated SNORA71A was significantly associated with worse survival of NSCLC patients. Knockdown of SNORA71A suppressed proliferation of both A549 and PC9 cells, and induced G0/G1 phase arrest. Knockdown of SNORA71A also suppressed xenograft tumor growth in mice. In addition, knockdown of SNORA71A inhibited cell invasion and migration and suppressed epithelial-mesenchymal transition. Furthermore, downregulated SNORA71A decreased the phosphorylation of MEK and ERK1/2 in the MAPK/ERK signal pathway.
Conclusion: SNORA71A functions as an oncogene in NSCLC and may serve as a therapeutic target and promising prognostic biomarker of NSCLC.
Keywords: Non-small cell lung cancer, Small nucleolar RNA, SNORA71A, MAPK/ERK, Tumorigenesis
Introduction
Lung cancer is one of the most common tumors and the leading cause of cancer death in both more and less developed regions [1]. Because of its asymptomatic and chronic process, lung cancer patients are usually diagnosed at an advanced stage, and 85% of them belong to non-small cell lung cancer (NSCLC) [2]. Surgery, radiotherapy, chemotherapy and immunotherapy are the major treatments for lung cancer. The outcome of NSCLC patients remains pretty poor and this disease is still not curable with currently available therapies [3, 4]. The 1-year survival rate was reported to be 83% for Stage I NSCLC patients who received effective treatments, but only 14% for advanced NSCLC patients [5]. Therefore, it is of an urgent need to reveal the underlying molecular mechanism in the development of NSCLC, and to identify new biomarkers for the detection of earlier and potentially curable stages.
Small nucleolar RNAs (snoRNAs) are a group of small non-coding RNAs (ncRNAs). They interact with their associated proteins to form small nucleolar ribonucleoproteins and play important roles in the maturation and modification of ribosomal RNAs (rRNAs), messenger RNAs (mRNAs) and small nuclear RNAs [6]. There are 2 subtypes of snoRNAs that have been described based on their structural difference, box H/ACA snoRNAs and box C/D snoRNAs, which regulates catalyzing pseudouridylation of rRNAs and 2'-O -ribose methylation respectively [7]. snoRNAs were considered as house-keeping genes since they were discovered. However, emerging evidence indicated that the development of human diseases was partly due to dysregulated snoRNAs, especially in human malignancy [8]. SNORD113-1 was reported to inhibit HepG2 and Huh7 cells growth via MAPK/ERK and TGF-β pathways as a tumor suppressor [9]. SNORD78 was reported to affect the activity of cancer stem-like cells and induce epithelial-mesenchymal transition (EMT) of A549 cells [10]. SNORA42 was upregulated in prostate cancer tissues, and promoted DU145 and PC3 cells proliferation, migration and EMT [11]. snoRNA ACA11 was reported to promote human hepatoma cell line Huh7 proliferation and EMT through the PI3K/AKT pathway [12]. SNORD105b was overexpressed in gastric cancer tissues and induced tumorigenesis via ALDOA/C-Myc pathway [13]. SNORA23 promoted pancreatic ductal adenocarcinoma cell proliferation and invasion, as well as tumor growth and metastasis, via inducing spectrin repeat-containing nuclear envelope 2 in mice [14]. SNORA18L5 was reported to promote hepatocellular carcinoma cell proliferation and tumor growth via inducing mouse double minute 2 mediated proteolysis of p53 in mice [15].
SNORA71A was encoded from the third intron of snoRNA host gene 17 (SNHG17), and guided the pseudouridylation of U406 in 18S rRNA [16]. Previous studies reported that SNORA71A was overexpressed in NSCLC tissues [17]. However, its effects and potential mechanisms under the malignant development of lung cancer remained unclear.
In our study, the overexpression of SNORA71A was confirmed in NSCLC tissues compared with normal tissues by weighted gene co-expression network analysis (WGCNA) using the GSE19188 dataset. Our results indicated that the upregulation of SNORA71A was associated with decreased overall survival in lung adenocarcinoma patients. Functional studies suggested that knockdown of SNORA71A inhibited NSCLC cell proliferation, migration and invasion in vitro. Animal experiment consistently indicated knockdown of SNORA71A suppressed xenograft tumor growth in vivo. Further mechanistic studies revealed that SNORA71A modulated cell cycle and EMT partly through the classical MAPK/ERK pathway.
Materials and methods
Data collection
Raw expression data of lung cancer were downloaded from the GEO database. Dataset GSE19188 [18] was used to construct co-expression networks and identify our target gene SNORA71A in this study. The dataset was performed on Affymetrix Human Genome U133 Plus 2.0 Array (Affymetrix, Santa Clara, CA, USA). This dataset included 91 lung tumor samples and 65 adjacent normal samples. The clinical information of patients, including age, sex, race, tobacco history, tumor type and stage, was also contained.
Data preprocessing
Robust Multi-Array Average background correction was performed, followed by log2 transformation and quantile normalization. The “affy” [19] R package was then used to summarize the median of probe sets. Affymetrix annotation files were used to annotate probes. The sample clustering was performed and 14 samples were removed from the dataset, according to the different distance and average linkage between samples in Pearson's correlation matrices.
Co-expression network construction
“WGCNA” [20] package in R was used to construct the co-expression network. The Pearson's correlation matrices were performed for all pair-wise genes. Next, a weighted adjacency matrix was constructed according to a power function: axy = |cxy|β (axy: adjacency between gene x and gene y; cxy: Pearson's correlation between gene x and gene y; β: a soft-thresholding parameter). β =3 (scale-free R2 = 0.874) was chosen to build a scale-free network for penalizing weak correlations and emphasizing strong correlations. The adjacency matrix was then transformed into the topology overlay matrix (TOM). To classify genes with similar expression profiles into gene modules, average linkage hierarchical clustering was conducted according to the TOM-based dissimilarity measure. To further analyze the module, we calculated the dissimilarity of the module information, selected a tangent for the module tree, and merged some of the modules.
Identification of clinically significant modules
Gene significance (GS) was defined as the correlation coefficient in the Spearman correlation between gene expression and selected clinical phenotype. Module significance (MS) was defined as the correlation coefficient between module eigengene (ME) and clinical data. The module with the top absolute MS rank was selected as the one related to the clinical trait. Next, we defined ME as the first component in the principal component analysis for each gene module. The expression patterns of all genes were summarized into a single characteristic expression profile within the selected module. Finally, we calculated the correlation between ME and single gene expression as module membership (MM) to identify the importance of genes in modules.
Functional and pathway enrichment analysis
Blue module which contained our interested gene (SNORA71A) was selected for the following analysis. Pearson's correlation analysis was performed to identify hub genes that were significantly associated with SNORA71A and belonged to the blue module (|r| ≥ 0.5, P < 0.05). For Functional and pathway enrichment analysis, the information of hub genes was imported into Cytoscape [21] software (version 3.6.0) by “WGCNA” package in R, interaction network of Gene Ontology (GO) terms and Kyoto Encyclopedia of Genes and Genomes (KEGG) pathway enrichment analysis was then established by ClueGO plugin [22]. “ClusterProfiler” [23] package was also used to screen enriched GO terms and KEGG pathway maps.
Cell culture
Lung cancer cell lines (A549, PC9, NCI-H1299, NCI-H1975, H292, H460, H661) were purchased from the Type Culture Collection of the Chinese Academy of Sciences (Shanghai, China). All these cells were cultured in RPMI-1640 medium (Hyclone Ltd., USA) supplemented with 10% FBS (Hyclone Ltd., USA), as well as 100 U/ml penicillin and 100 mg/ml streptomycin (Sangon Ltd., China). All cells were maintained in a humidified incubator (Sanyo, Japan) at 37 °C with a presence of 5% CO2.
RNA extraction and qRT-PCR
Total RNA was isolated from cells using TRIzol (Vazyme Ltd., China). The RNA concentrations and the A260/A280 nm ratios were detected by a Nanodrop spectrophotometer (Thermo Scientific Ltd., USA). Total RNA (500 ng) was reversely transcripted using HiScript® Q RT SuperMix for qPCR kit (Vazyme Ltd., China) according to manufacturer's instructions. Quantitative real-time polymerase chain reaction (qRT-PCR) was performed using the ChamQTM SYBR® qPCR Master Mix (Vazyme Ltd., China) on the CFX ConnectTM RealTime PCR Detection System (Bio-Rad, USA). β-actin and U6 were used as the reference for normalization. The relative expression fold change of mRNAs was calculated by the 2-ΔΔCt method. The primers used are presented in Table 1.
Primer sequences and siRNA sequences used in this study.
| Gene | sequences or target sequence (5'→3') |
|---|---|
| SNORA71A-F | CCGAAAGTGATCATAGGCTGC |
| SNORA71A-R | TTCGGATGGGATAGGGTGGA |
| SNHG17-F | TGCTTGTAAGGCAGGGTCTC |
| SNHG17-R | TGCTTGTAAGGCAGGGTCTC |
| β-actin-F | TGGCACCCAGCACAATGAA |
| β-actin-R | CTAAGTCATAGTCCGCCTAGAAGCA |
| U6-F | GCTTCGGCAGCACATATACTAAAAT |
| U6-R | CGCTTCACGAATTTGCGTGTCAT |
| SNORA71A-NC | UUCUCCGAACGUGUCACGUTT (sense) |
| ACGUGACACGUUCGGAGAATT (antisense) | |
| SNORA71A-siRNA | CCUGCAUCCGAAAGUGAUCTT (sense) |
| GAUCACUUUCGGAUGCAGGTT (antisense) |
RNA interference and lentiviral transfection
Small interfering RNAs (siRNAs) targeting SNORA71A and negative control (NC) RNAs were purchased from Genepharm Technologies (GenePharma Ltd., China). Transient transfection was performed using jetPRIME® transfection reagent (Polyplus-transfection® SA, France) following the manufacturer's recommendations. Briefly, 25-30 × 104 cells were seeded in each well of 6-well plates. After growing to 30-50% confluence, the cells were transfected with NC or target siRNAs. Cells were harvested 48 hours after transfection. A549 and PC9 cells were infected with lentiviral-NC (LV-NC, OBiO Technology, China) or lentiviral-siRNA (LV-siRNA, OBiO Technology) according to the supplier's recommendations. Puromycin (Cayman chemical Ltd., USA) was used to select stable knockdown cells at the concentration of 4 mg/mL or 2 mg/mL for A549 and PC9 cells respectively.
Cell proliferation assay
Cell proliferation was assessed by the MTT (Sigma Chemical Ltd., USA) assay. Cells (3000 cells/well) were seeded into 96-well plates. The optical density (OD) values were measured at 490 nm every 24 hours using a multimodal plate reader (PE Enspire, USA). This assay was repeated 3 times and each group contained at least 5 replicants.
Colony formation assay
Cells (500 cells/well) were plated in 6-well plates and cultured for 2 weeks. Cell colonies were fixed with 4% paraformaldehyde (Sangon Ltd., China) for 20 min and stained with 0.5% crystal violet (Beyotime Ltd., China) for 30 min at room temperature. The number of colonies was counted under the microscope after washing with water. This assay was repeated 3 times and performed in triplicates.
Cell cycle analysis
Cells were harvested with trypsin without EDTA (Corning Ltd., USA) 48 hours after transfection. After washing with cold phosphate buffered saline (PBS), the cells were treated with the cell cycle staining kit (MultiSciences Biotech Ltd., China). Flow cytometry (Beckman, China) was used to detect the percentage of cells at different cell-cycle phases. This assay was repeated at least 3 times.
Immunofluorescence analysis
Cells were cultured on 24 × 24 mm glass slides. For membrane staining (zonula occludens 1, ZO-1), cells were fixed with 4% paraformaldehyde (Sangon Ltd., China) for 15 min. For intracellular staining (Ki-67), the cells were fixed with 4% paraformaldehyde and permeabilized by incubation with 0.5% Triton X-100 (Beyotime Ltd., China) in PBS for 15 min. After washing 3 times with PBS, the cells were incubated with 5% bovine serum albumin in PBS at room temperature for 30 min, and then incubated with specific primary antibodies at 4 °C overnight. The cells were then washed and incubated with FITC-conjugated goat anti-rabbit IgG for 1 h. After stained with DAPI (Sigma Chemical Ltd., USA), images were taken by fluorescence microscope (Olympus Ltd., Japan).
Cell migration and invasion assays
Cells (5 × 10⁴) transfected with NC or siRNA were seeded in the upper chamber of transwell units (Corning Ltd., USA) with 200 μl basal medium. The lower chamber was filled with 700 μL culture medium containing 10% FBS and 1% penicillin/streptomycin. After incubation for 24 h, the filters were fixed with 4% paraformaldehyde for 20 min and stained with 0.5% crystal violet for 20 min at room temperature. Cells on the upper surface of the filter were completely removed by wiping with a cotton swab. The migrated cells through the pores to the lower surface of the filter were counted. For cell invasion assays, 1 × 10⁵ cells transfected with NC or siRNA were seeded in the upper chamber, and the transwell units were pre-coated with 100 μl diluted Matrigel (Becton-Dickinson Ltd., USA, dilution 1:40). Cells that invaded through the Matrigel and reached the lower surface of the filter were counted. Experiments were independently repeated 3 times in triplicates.
Wound healing assay
The cells were seeded in 12-well plates and transfected with NC or siRNA until full confluence. The cells were then scratched with a pipette tip and washed with PBS gently. The migration rate was calculated by the formula: wound closure (%) = (Distance of initial scratched - Distance of final imaged without cells) / Distance of initial scratched.
Western blot analysis
Protein was extracted from the cells using RIPA cell lysis buffer (Beyotime Ltd., China) supplemented with phosphatase inhibitors and protease inhibitors (Sigma Chemical Ltd., USA). The lysates were then collected and centrifugated for 15 min at 4 °C. The supernatants were collected, and protein concentration was measured by a bicinchoninic acid system (Beyotime Ltd., China). Equal amounts of proteins were applied to a 10-12% sodium dodecyl sulfate-polyacrylamide separating gel and transferred to a polyvinylidene fluoride membrane. The membrane was blocked with 5% nonfat milk and then incubated with primary antibodies with gentle shaking at 4 °C overnight. After washing, the membrane was incubated with HRP-conjugated goat anti-mouse or goat anti-rabbit antibody at room temperature for 1.5 hours. Enhanced chemiluminescence kit (Bio-Rad Ltd., USA) was used to detect the antibody-bound proteins under a gel imaging analyzer (Bio-Rad Ltd., USA). Antibodies used for detection were listed in Table 2.
Antibodies used in this study.
| Antibody | Company | Dilution |
|---|---|---|
| E-Cadherin (20874-1-AP) | Proteintech | 1:1000 |
| N-Cadherin (22018-1-AP) | Proteintech | 1:1000 |
| Vimentin (10366-1-AP) | Proteintech | 1:1000 |
| MMP9 (10375-2-AP) | Proteintech | 1:1000 |
| MMP2 (10373-2-AP) | Proteintech | 1:1000 |
| CyclinD1 (#2978) | Cell Signaling Technology (CST) | 1:1000 |
| CyclinE1 (11554-1-AP) | Proteintech | 1:1000 |
| CDK6 (14052-1-AP) | Proteintech | 1:1000 |
| CDK4 (11026-1-AP) | Proteintech | 1:1000 |
| CDK2 (10122-1-AP) | Proteintech | 1:1000 |
| P27 (25614-1-AP) | Proteintech | 1:1000 |
| p-ERK1/2(#4370) | Cell Signaling Technology (CST) | 1:1000 |
| ERK1/2 (16443-1-AP) | Proteintech | 1:1000 |
| p-MEK (#9154) | Cell Signaling Technology (CST) | 1:1000 |
| MEK (11049-1-AP) | Proteintech | 1:1000 |
| Ki-67 (ab16667) | Abcam | 1:200 |
| ZO-1 (21773-1-AP) | Proteintech | 1:200 |
| GAPDH (10494-1-AP) | Proteintech | 1:2500 |
Animals
Male BALB/c Nude mice (5-6 weeks of age) were purchased from the Vital River Laboratories (Beijing, China). A549-LV-NC or A549-LV-siRNA cells (4 × 10⁶ per 100 μl) were injected subcutaneously into the right armpits of the nude mice to build the xenograft model. Length and width of the tumor were measured every 4 days to calculate the volume (length × width × width × 0.5). After 8 weeks, the mice were anesthetized with pentobarbital (Sigma Chemical Ltd., USA), and the D-Luciferin (PerkinElmer, USA) was injected into animals intraperitoneally for bioluminescence image by using IVIS Lumina XRMS Series III (PerkinElmer, USA). Mice were then sacrificed and tumors were exercised. All experimental procedures were approved by the Institutional Animal Care and Use Committee of Center for Animal Experiments/Animal Biosafety Level 3 Laboratory, Wuhan University.
Statistical analysis
All statistical analyses were performed with GraphPad version 5.0 software. All data were presented as the mean ± standard deviation (SD). Unpaired 2 tail student's t-test was used for comparison between groups. A value of p < 0.05 was considered as statistical significance.
Results
SNORA71A was overexpressed in NSCLC and associated with worse survival
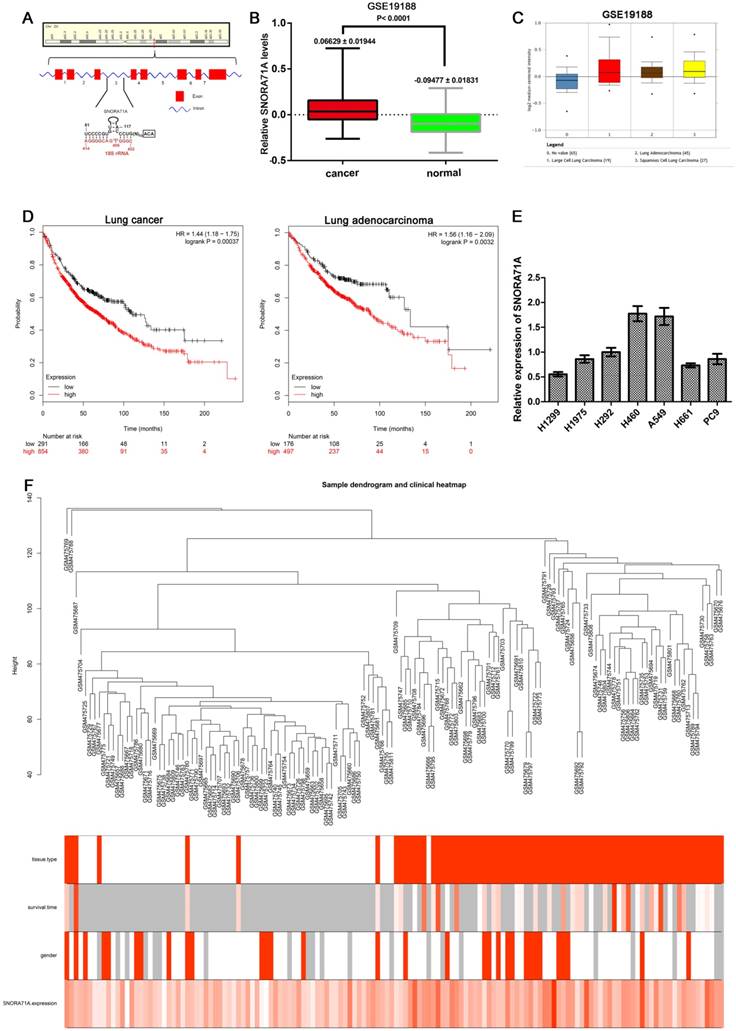
SNORA71A was located at 20q11.23, and the gene copy number amplifications at this location were observed in many cancers such as bladder carcinoma [24], breast cancer [25], pancreatic adenocarcinoma [26], myeloid malignancies [27] and colorectal cancers [28]. SNORA71A resides in the third intron of SNHG17 which consists of 8 exons (Figure 1A). To confirm that SNORA71A was overexpressed in NSCLC tissues versus non-tumor lung tissues, dataset GSE19188 was downloaded from the GEO database and analyzed with package “WGCNA” in R. SNORA71A was obviously upregulated in lung cancer tissues (P < 0.001). The expression levels of SNORA71A in lung adenocarcinoma, large cell lung carcinoma and squamous cell lung carcinoma were also higher than in normal tissues (Figure 1B&C). However, there was no significant difference of SNORA71A expression between lung adenocarcinoma and squamous cell lung carcinoma tissues. Moreover, increased expression of SNORA71A was associated with reduced the overall survival of lung adenocarcinoma patients in Kaplan-Meier plotter database (Figure 1D). In addition, qRT-PCR assay was performed to compare SNORA71A expression levels in different lung cancer cell lines (Figure 1E). A549 and PC9 cells showed higher endogenous expression levels of SNORA71A and were selected for the further experiment.
SNORA71A was overexpressed in lung cancer and associated with worse survival. (A) Schematic diagram of SNORA71A and its host gene SNHG17 in 20q11.23. SNHG17 (middle) was composed of 8 exons and SNORA71A located in the third intron of SNHG17. (B) Different expression levels of SNORA71A in lung cancer and matched normal tissues of GSE19188. SNORA71A expression in lung cancer was obviously higher than in normal lung tissues. (C) The expression of SNORA71A in lung adenocarcinoma, large cell lung carcinoma, and squamous cell lung carcinoma were higher than normal tissues in GSE19188. (D) High levels of SNORA71A were associated with reduced overall survival of lung cancer patients (left) and lung adenocarcinoma patients (right) in Kaplan-Meier plotter database. (E) Expression of SNORA71A in different NSCLC cell lines using qRT-PCR analysis (H1299, H1975, H292, H460, A549, H661, PC9). (F) Sample dendrogram and trait indicator after detecting outliers from GSE19188 by WGCNA analysis. The clustering was based on the expression data. The color intensity was proportional to clinical information including tissue type, survival time, gender and SNORA71A expression (For binary clinical information data, white means normal tissues and male, and red means lung cancer tissues and female).
SNORA71A co-expression network
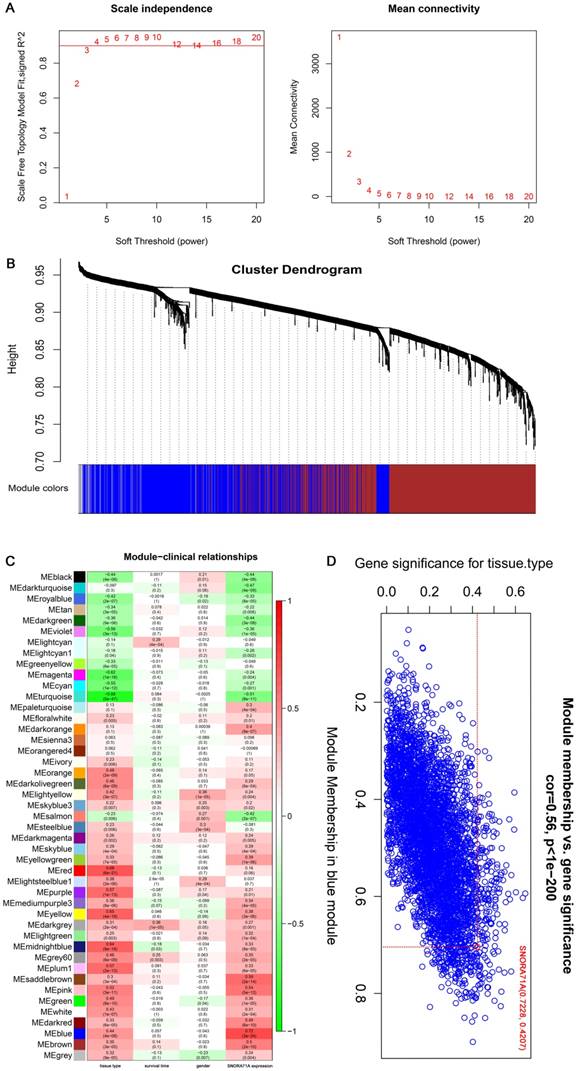
The expression matrices consisted of 142 samples in GSE19188 was constructed using WGCNA analysis (Figure 2A). The blue module was selected for subsequent analysis due to its higher MS rank in terms of tissue type (r = 0.44, P = 4 × 10⁻⁸) and SNORA71A expression (r = 0.72, P = 3 × 10-24) (Figure 2B&C). Interestingly, SNORA71A also had higher MM rank (MM = 0.723) in the blue module than most other genes (ranks top 3.7%). The GS rank for the tissue type of SNORA71A in the blue module was 0.421 (Figure 2D). These results indicated that SNORA71A was a quite important variate correlated with tissue type and played an important role in the module.
Analysis of GSE19188 by weighted gene co-expression network analysis. (A) Determination of soft-thresholding power in the WGCNA. Analysis of the scale-free fit index (R^2) for the various soft-thresholding parameter (power) of Power law distribution (the horizontal line in the diagram represents 0.9) (left). Analysis of the mean connectivity for various soft thresholding powers (right). β = 3 was selected as the optimal soft-thresholding parameter. (B) Dendrogram of gene modules based on TOM and k-means clustering algorithm (different colors represent different modules). (C) Heatmap of the Pearson correlation between ME and different clinical information (tissue type, survival time, gender, SNORA71A expression). (D) Scatter plot of GS for tissue type and the MM in the blue module, the MM of SNORA71A was 0.723 in blue module.
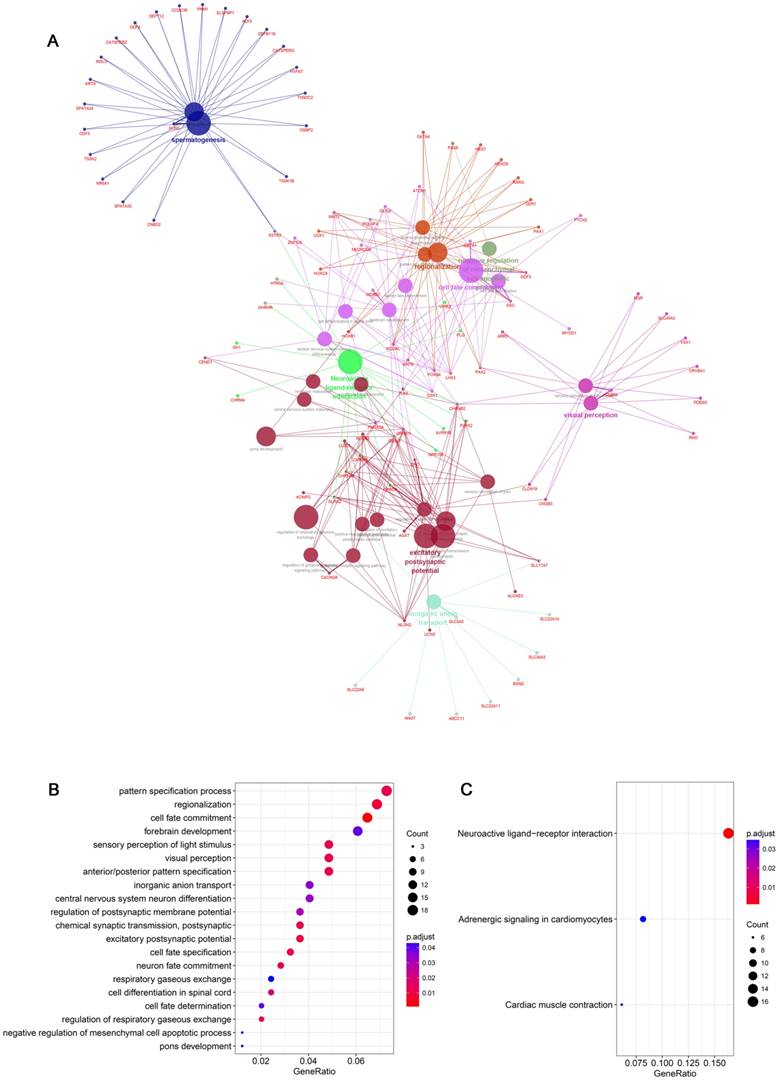
In addition, hub genes information (a total of 372 hub genes which included both snoRNAs and mRNAs information) in the blue module were imported into Cytoscape software by “WGCNA” package in R, and “ClusterProfiler” package was used to construct protein-protein interaction networks for SNORA71A co-expressing proteins (Figure 3A). GO analysis indicated that SNORA71A co-expressing proteins were enriched in 20 biological processes (Figure 3B). Moreover, SNORA71A co-expressing proteins were involved in 3 KEGG pathways, including regulation of neuroactive ligand-receptor interaction, adrenergic signaling in cardiomyocytes and cardiac muscle contraction (Figure 3C).
SNORA71A co-expression network. (A) Construction of PPI network for SNORA71A co-expressing networks. Interaction network of GO and KEGG pathway enrichment analysis of hub genes in the blue module. The circle size of each node presented the connectivity degree in the weighted gene co-expression network, and different colors represented different GO or KEGG pathways. (B) The top 20 biological processes of SNORA71A co-expressed genes in the blue module were listed. (C) KEGG pathway analysis indicated the pathway of SNORA71A co-expressed genes in the blue module.
Knockdown of SNORA71A inhibited cell proliferation and induced cell cycle arrest via classical MAPK/ERK pathway
The high expression of SNORA71A in NSCLC and its association with poor outcomes inspired us to explore the potential role of SNORD71A dysregulation in NSCLC. A549 and PC9 cells were transfected with specific siRNAs target SNORA71A to downregulate SNORA71A expression. qRT-PCR results suggested SNORA71A was specifically downregulated rather than its host gene, because SNORA71A knockdown had no effect on SNHG17 expression in both A549 and PC9 cells (Figure 4A&B). The results of MTT assay indicated a significant decrease of the proliferation of in A549 and PC9 cells after SNORA71A knockdown (Figure 4A&B). Immunofluorescent analysis of Ki-67 indicated that knockdown of SNORA71A inhibited cell division (Figure 4C). Colony formation assay displayed smaller number and size of colonies after knockdown of SNORA71A (Figure 4D).
Knockdown of SNORA71A inhibited cell proliferation and induced cell cycle arrest via the MAPK/ERK pathway. (A&B) qRT-PCR analysis indicated that knockdown of SNORA71A had no effect on its host gene SNHG17 expression, and MTT assays indicated that knockdown of SNORA71A reduced cell proliferation in both A549 and PC9 cells. *, p < 0.05; **, p < 0.01; ***, p < 0.001; ns, not significant. (C) Representative images of Ki-67 staining in A549 and PC9 cells. Ki67 was downregulated after knockdown of SNORA71A. The images were taken at 400X magnification. The scale bar was 20 μm. (D) Colony formation assay indicated that knockdown of SNORA71A reduced colonies numbers 12 days after transfection. (E&F) Flow cytometry was performed to detect the percentage of cells at different cell-cycle phases after propidium iodide staining. The data were shown here as the mean ± S.D. from 3 independent experiments. *, p < 0.05; **, p < 0.01. (G&H) Western blot analysis of the cell cycle-related proteins, cyclin D1, cyclin E1, CDK2/4/6, P27 and classical MAPE/ERK pathway proteins, t-ERK1/2, p-ERK1/2, t-MEK, p-MEK. GAPDH was used as an internal control.
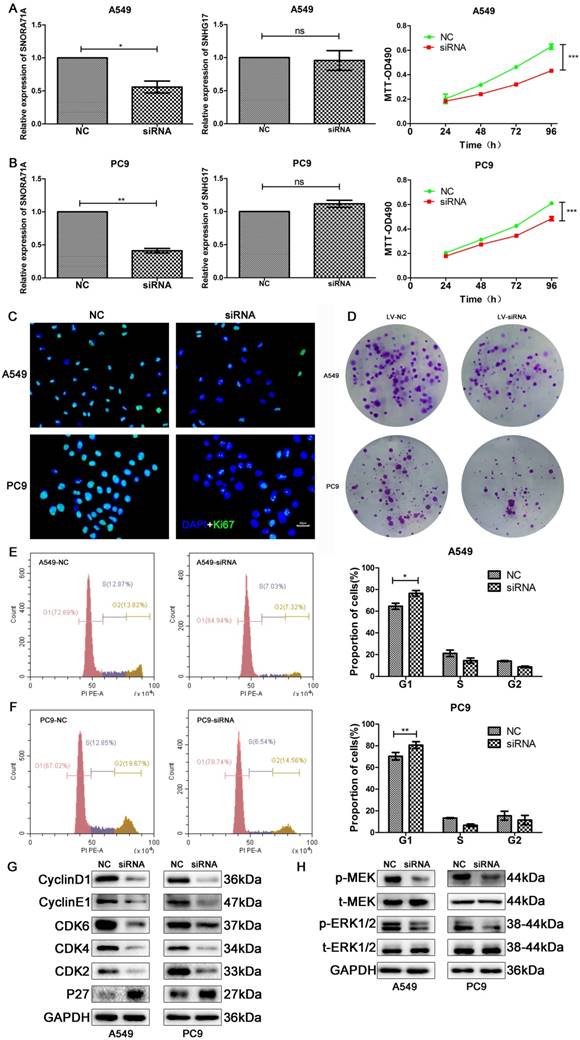
Moreover, cell cycle distribution was assessed by flow cytometry. Knockdown of SNORA71A induced a significant G0/G1 arrest in both A549 and PC9 cells (Figure 4E&F). The results of Western blot indicated that protein levels of CyclinD1, CyclinE1, CDK2/4/6 were downregulated and P27 was upregulated after SNORA71A knockdown (Figure 4G). Previous studies reported that snoRNA might inhibit HepG2 and Huh7 cells growth partly through the MAPK/ERK pathway [9]. Our results of Western blot indicated that knockdown of SNORA71A decreased the phosphorylation of MEK and ERK1/2 in A549 and PC9 cells (Figure 4H).
Knockdown of SNORA71A suppressed migration and invasion
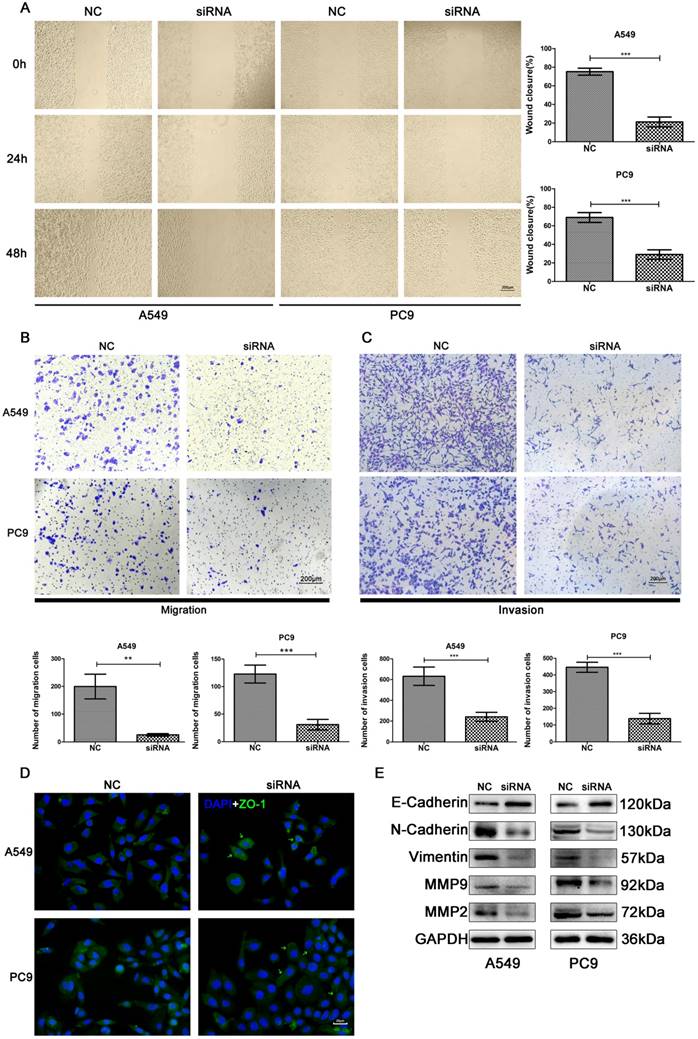
The effects of SNORA71A knockdown on cell migration was examined by scratch wound healing and transwell migration assays. Knockdown of SNORA71A significantly impaired cell migration in both A549 and PC9 cells (Figure 5A&B). Moreover, the results of transwell assay demonstrated that SNORA71A silencing reduced the invasion of both A549 and PC9 cells (Figure 5C). In addition, the expression of ZO-1 was increased in A549 and translocated to the cell surface in PC9 after knockdown of SNORA71A (Figure 5D). The results of Western blot indicated that expression of N-Cadherin, Vimentin, Matrix Metalloproteinase 9 (MMP9), MMP2 were downregulated and E-Cadherin was upregulated after SNORA71A knockdown (Figure 5E).
Knockdown of SNORA71A inhibited cell migration and invasion. (A) Wound healing assay indicated that knockdown of SNORA71A decreased wound closure 48 h after scratch in both A549 and PC9 cells. The images were taken at 100X magnification. The scale bar was 200 μm. The data were shown here as the mean ± S.D. from 3 independent experiments. ***, p < 0.001. (B&C) Transwell assays indicated that knockdown of SNORA71A reduced migrative and invasive cell numbers. The images were taken at 100X magnification. The scale bar was 200 μm. The data were shown here as the mean ± S.D. from 3 independent experiments. **, p < 0.01; ***, p < 0.001. (D) Representative images of ZO-1 staining in A549 and PC9 cells. ZO-1 was upregulated in A549 and translocated to the cell membrane surface in PC9 after SNORA71A deficiency, marked by the green arrows. The images were taken at 400X magnification. The scale bar was 20 μm. (E) Invasion-related proteins, N-Cadherin, E-Cadherin, Vimentin, MMP9 and MMP2 were detected by Western blot analysis. GAPDH was used as an internal control.
Downregulating of SNORA71A suppressed tumorigenesis of NSCLC in vivo
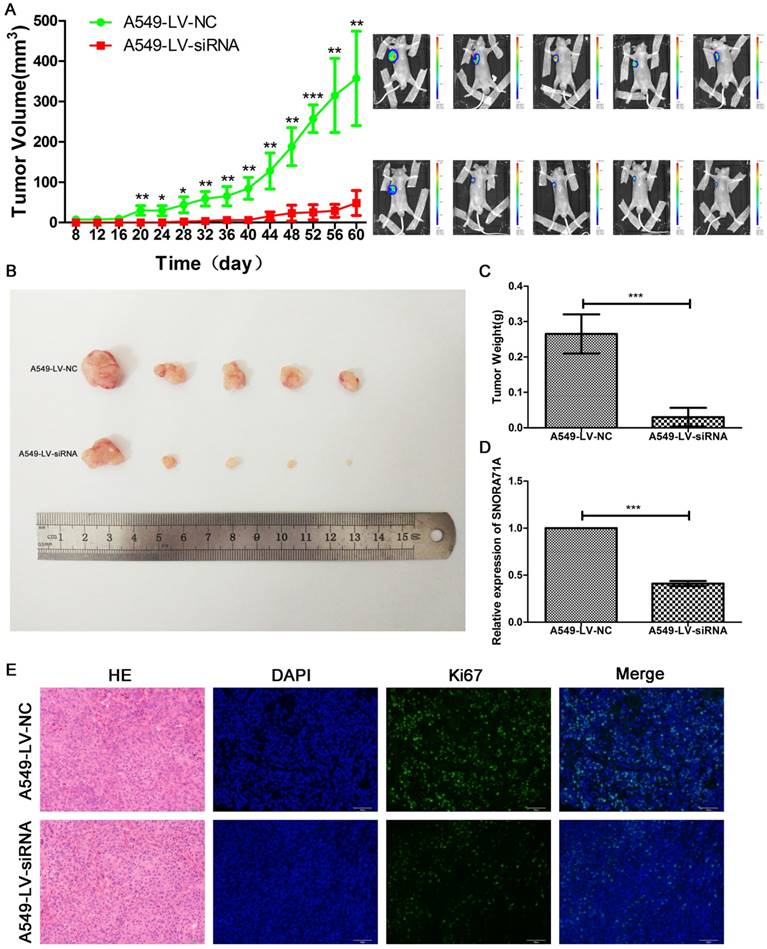
Stable knockdown cells A549-LV-siRNA, as well as A549-LV-NC, were constructed for the animal experiment. Palpable tumors were measured by length and width every 4 days. SNORA71A deficient tumors grew slower than control. The tumors size of A549-LV-siRNA cells were much smaller than control 8 weeks later (Figure 6A&B). Tumors were then exercised for immunohistochemical and immunofluorescent stain of Ki67. The weight of tumors in the control group was significantly higher than that in the SNORA71A deficient group (Figure 6C). The results of qRT-PCR confirmed the lower expression levels of SNORA71A in the A540-LV-siRNA group than those in the A549-LV-NC group (Figure 6D). The Ki67 positive cell percentage was lower in the mice xenografted with SNORA71A deficient cells than the control cells (Figure 6E). Taken together, our results suggested that knockdown of SNORA71A significantly suppressed tumor growth in vivo.
Knockdown of SNORA71A suppressed tumorigenesis in vivo. (A) Tumors in A549-LV-siRNA group grew slower than those in the control group. The bioluminescent images taken at day 60 indicated that the tumor size in the A549-LV-siRNA group was smaller. *, p < 0.05; **, p < 0.01; ***, p < 0.001. (B&C) The tumors sizes and weights in the A549-LV-siRNA group were smaller than control. ***, p < 0.001. (D) Expression levels of SNORA71A in the A549-LV-siRNA group were significantly lower than those in the A549-LV-NC group. ***, p < 0.001. (E) Representative images of hematoxylin-eosin and Ki67 staining of tumors. The Ki67 positive cell rate was lower in the A549-LV-siRNA group. The images were taken at 200X magnification. The scale bar was 50 μm.
Discussion
Emerging evidence indicated that ncRNAs played important roles in the progression of lung cancer [29]. With the rapid development and widespread application of microarray and next-generation deep sequencing, increasing ncRNAs were identified and annotated. ncRNAs were recognized as functional regulatory molecules in cellular processes and human diseases particularly in cancer [30]. SNORA71A was originally cloned by Ganot et al. and predicted to modulate the pseudouridine of rRNA[31]. It was considered as a housekeeping gene until Gao, L. et al. reported its aberrant expression in NSCLC tissues [17].
Dataset GSE19188 from GEO database was downloaded to validate the previous study. Consistently, the expression of SNORA71A was significantly upregulated in lung cancer than normal tissues (P < 0.001), and the expression levels of SNORA71A in lung adenocarcinoma, large cell lung carcinoma and squamous cell lung carcinoma were also higher than those in normal tissues. However, the SNORA71A levels were not significantly different among lung adenocarcinoma, large cell lung carcinoma and squamous cell lung carcinoma tissues (Figure 1C). A gene expression matrix was constructed and we identified the gene modules associated with the interested clinical information. The blue module which contained our target gene SNORA71A suggested a higher correlation with tumor tissues than other modules, and SNORA71A indicated a central value among the blue module. In addition, GO enrichment indicated SNORA71A was obviously enriched in pattern specification process, regionalization, cell fate commitment and forebrain development and so on. Moreover, KEGG enrichment indicated that SNORA71A was overrepresented in the regulation of neuroactive ligand-receptor interaction, adrenergic signaling in cardiomyocytes and cardiac muscle contraction. These results suggested that SNORA71A participated in biological functions besides in the formation of small nucleolar ribonucleoproteins.
To further understand the role of SNORA71A in NSCLC, the Kaplan-Meier plotter database was used, and overexpression of SNORA71A was associated with reduced overall survival times of lung cancer patients, especially in lung adenocarcinoma patients rather than squamous cell lung carcinoma patients. The results suggested that dysregulated SNORA71A was involved in the progression of NSCLC. In our study, SNORA71A was firstly reported to promote human lung adenocarcinoma cells growth. Downregulating of SNORA71A suppressed NSCLC cells proliferation, induced cell GO/G1 arrest, and inhibited invasion and migration. Moreover, the results of animal experiment provided the direct evidence that knockdown of SNORA71A caused tumor growth suppression. Our results suggested us that SNORA71A might play a role as an oncogene.
SNORA71A was located in 20q11.23, whose instability was observed in many other cancers. Diversity in genomic instability processes including copy number alterations, translocations, and mutations take important accounts in lung cancer evolution [32].
Siprashvili, Z. et al. [33] reported that the locus of SNORD50A/B was deleted in 10-40% of 12 common cancers, and loss of these snoRNAs catalyzed K-Ras protein farnesylation and enhanced tumorigenesis. SNORA71A resided in the third intron of SNHG17, therefore, both SNORA71A and its host gene SNHG17 might be targets of genomic instability. SNHG17 was upregulated in colorectal cancer tissues and promoted colorectal cancer cell proliferation by epigenetically silencing P57 [34]. Likely, the upregulation of SNORA71A in NSCLC tissues and its relationship with worse survival reminded us that it might act as an oncogene in NSCLC. In addition, our results proved that SNORA71A performed its oncogenic functions in NSCLC cells independent from its host gene SNHG17. Which was consistent with previous studies that snoRNAs dysregulation in disease was independent of its host gene transcription [10, 35].
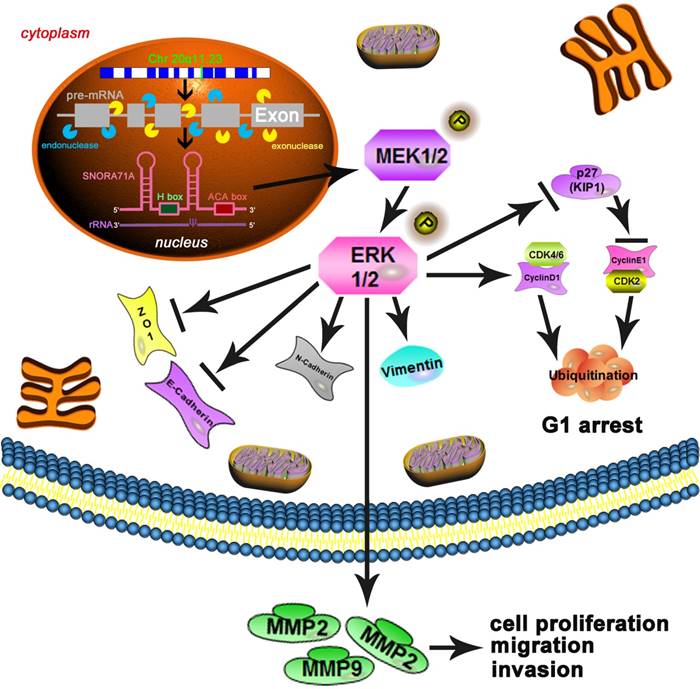
Mechanism diagram. SNORA71A was located at 20q11.23 and encoded from the third intron of SNHG17 under both endonucleases and exonucleases. In our study, knockdown of SNORA71A decreased the phosphorylation of MEK and ERK1/2. Knockdown of SNORA71A induced G1 phase arrest and suppressed proliferation of both A549 and PC9 cells. In addition, knockdown of SNORA71A decreased MMP2 and MMP9 levels and suppressed EMT, then inhibited cell invasion and migration. Furthermore, knockdown of SNORA71A suppressed xenograft tumor growth in mice.
The mechanism between snoRNA and cancer remained unknown. The tumor associated pathways such as Wnt, Notch or NF-kB et al. might play important roles in the development of tumorigenesis. To further explore the potential molecular mechanism by which SNORA71A participate in A549 and PC9 cells, we focused on the MAPK/ERK signaling pathway. The MAPK/ERK pathway was an important cancer-associated pathway in NSCLC and various cancers [36]. Previous studies reported that ncRNAs affected the MAPK/ERK signal pathway [37]. Aberrant activation of the MAPK/ERK pathway promoted cell proliferation, differentiation and migration, and induced cell cycle arrest [38]. Consistent with the previous study [9], our founding indicated that knockdown of SNORA71A decreased phosphorylation of MEK and ERK1/2 in A549 and PC9 cells, which supported our hypothesis that SNORA71A activated the MAPK/ERK pathway to promote NSCLC cell proliferation, migration and invasion. Cyclins and cyclin-dependent kinases (CDKs) regulated cell progression through the phases of the cell cycle, whereas cyclin-CDK inhibitors caused cell cycle arrest [39]. In our study, knockdown of SNORA71A inactivated MAPK/ERK pathway and influenced downstream cell-cycle proteins. Cyclin D/CDK4/CDK6 complex was decreased, and increasing P27 expression reduced cyclin E/CDK2 complex expression, and induced cell G0/G1 arrest and growth inhibition. We also examined TGF-β signaling pathway, but observed no significant difference. EMT consists of the gain of mesenchymal and migratory phenotype and loss of epithelial phenotype and usually leads to tumor metastasis. NF-kB, STAT3, HIF1α, β-catenin, YAP and MAPK/ERK have been reported as the key pathways involved in the EMT process [40, 41]. In our study, knockdown of SNORA71A inhibited the MAPK/ERK signal pathway, decreased expression of MMP2 and MMP9, and resulted in an obvious decrease of the levels of mesenchymal markers N-cadherin, Vimentin. The induced expression of epithelial marker E-cadherin and ZO-1 indicated that SNORA71A regulated EMT and metastasis of NSCLC. Our results were consistent with the previous studies that activation of MAPK/ERK could promote the EMT progress [42-44].
In summary, our work firstly demonstrated that SNORA71A played an oncogenic role in NSCLC tumorigenesis. Upregulated SNORA71A was significantly associated with worse survival. Knockdown of SNORA71A suppressed cells proliferation, invasion, migration and EMT at least partly through the classical MAPK/ERK pathway. Therefore, SNORA71A may act as not only a useful snoRNA-directed diagnostic and predictive biomarker, but also a potential therapeutic target for NSCLC patients. Furthermore, we might investigate its carcinogenic effect via overexpressing it in normal lung epithelial cells and a larger population should be applied to validate its prognostic value and then developed a more effective treatment strategy for NSCLC patients.
Abbreviations
snoRNAs: small nucleolar RNAs; SNORA71A: small nucleolar RNA 71A; NSCLC: non-small cell lung cancer; GEO: Gene Expression Omnibus; EMT: epithelial-mesenchymal transition; ncRNA: non-coding RNA; rRNAs: ribosomal RNAs; mRNA: message RNA; SNHG17: small nucleolar RNA host gene 17; WGCNA: weighted gene co-expression network analysis; TOM: topology overlay matrix; GS: Gene Significance; MS: module significance; ME: module eigengene; MM: module membership; GO: Gene Ontology; KEGG: Kyoto Encyclopedia of Genes and Genomes; qRT-PCR: quantitative real-time polymerase chain reaction; siRNAs: small interfering RNAs; NC: negative control; OD: optical density; PBS: phosphate buffered solution; LV-NC: lentiviral-NC; LV-siRNA: lentiviral-siRNA; CDKs: cyclin-dependent kinases; MAPK: mitogen-activated protein kinase; ERK: extracellular signal-related kinases; MEK: mitogen-activated protein kinase kinase; ZO-1: zonula occludens 1; MMP: matrix metalloproteinase.
Acknowledgements
The authors would like to thank Dr. Tian Lan at Department of Liver Surgery and Liver Transplantation in West China Hospital for excellent technical assistance.
Funding
This work was supported by National Natural Science Foundation of China (81372498, 81572967, 81773236 and 81800429), National Project for Improving the Ability of Diagnosis and Treatment of Difficult Diseases, National Key Clinical Speciality Construction Program of China ([2013]544), the Fundamental Research Funds for the Central Universities (2042018kf0065 and 2042018kf1037), Health Commission of Hubei Province Scientific Research Project (WJ2019H002 and WJ2019Q047), Wuhan City Huanghe Talents Plan, and Zhongnan Hospital of Wuhan University Science, Technology and Innovation Seed Fund (znpy2016050, znpy2017001, znpy2017049 and znpy2018028).
Competing Interests
The authors have declared that no competing interest exists.
References
1. Bray F, Ferlay J, Soerjomataram I, Siegel RL, Torre LA, Jemal A. Global cancer statistics 2018: GLOBOCAN estimates of incidence and mortality worldwide for 36 cancers in 185 countries. CA: a cancer journal for clinicians. 2018;68:394-424
2. Bunn PA Jr, Dimou A. Systemic Therapy for Elderly Patients With Advanced Non-Small-Cell Lung Cancers. Journal of clinical oncology: official journal of the American Society of Clinical Oncology. 2018;36:2571-4
3. Doroshow DB, Herbst RS. Treatment of Advanced Non-Small Cell Lung Cancer in 2018. JAMA oncology. 2018;4:569-70
4. Postmus PE, Kerr KM, Oudkerk M, Senan S, Waller DA, Vansteenkiste J. et al. Early and locally advanced non-small-cell lung cancer (NSCLC): ESMO Clinical Practice Guidelines for diagnosis, treatment and follow-up. Annals of oncology: official journal of the European Society for Medical Oncology. 2017;28:iv1-iv21
5. Chen W, Zheng R, Baade PD, Zhang S, Zeng H, Bray F. et al. Cancer statistics in China, 2015. CA: a cancer journal for clinicians. 2016;66:115-32
6. Maxwell ES, Fournier MJ. The small nucleolar RNAs. Annual review of biochemistry. 1995;64:897-934
7. Kiss T. Small nucleolar RNAs: an abundant group of noncoding RNAs with diverse cellular functions. Cell. 2002;109:145-8
8. Williams GT, Farzaneh F. Are snoRNAs and snoRNA host genes new players in cancer? Nature reviews Cancer. 2012;12:84-8
9. Xu G, Yang F, Ding CL, Zhao LJ, Ren H, Zhao P. et al. Small nucleolar RNA 113-1 suppresses tumorigenesis in hepatocellular carcinoma. Molecular cancer. 2014;13:216
10. Zheng D, Zhang J, Ni J, Luo J, Wang J, Tang L. et al. Small nucleolar RNA 78 promotes the tumorigenesis in non-small cell lung cancer. Journal of experimental & clinical cancer research: CR. 2015;34:49
11. Yi C, Wan X, Zhang Y, Fu F, Zhao C, Qin R. et al. SNORA42 enhances prostate cancer cell viability, migration and EMT and is correlated with prostate cancer poor prognosis. The international journal of biochemistry & cell biology. 2018;102:138-50
12. Wu L, Zheng J, Chen P, Liu Q, Yuan Y. Small nucleolar RNA ACA11 promotes proliferation, migration and invasion in hepatocellular carcinoma by targeting the PI3K/AKT signaling pathway. Biomedicine & pharmacotherapy = Biomedecine & pharmacotherapie. 2017;90:705-12
13. Zhang C, Zhao LM, Wu H, Tian G, Dai SL, Zhao RY. et al. C/D-Box Snord105b Promotes Tumorigenesis in Gastric Cancer via ALDOA/C-Myc Pathway. Cellular physiology and biochemistry: international journal of experimental cellular physiology, biochemistry, and pharmacology. 2018;45:2471-82
14. Cui L, Nakano K, Obchoei S, Setoguchi K, Matsumoto M, Yamamoto T. et al. Small Nucleolar Noncoding RNA SNORA23, Up-Regulated in Human Pancreatic Ductal Adenocarcinoma, Regulates Expression of Spectrin Repeat-Containing Nuclear Envelope 2 to Promote Growth and Metastasis of Xenograft Tumors in Mice. Gastroenterology. 2017;153:292-306.e2
15. Cao P, Yang A, Wang R, Xia X, Zhai Y, Li Y. et al. Germline Duplication of SNORA18L5 Increases Risk for HBV-related Hepatocellular Carcinoma by Altering Localization of Ribosomal Proteins and Decreasing Levels of p53. Gastroenterology. 2018;155:542-56
16. Ganot P, Bortolin ML, Kiss T. Site-specific pseudouridine formation in preribosomal RNA is guided by small nucleolar RNAs. Cell. 1997;89:799-809
17. Gao L, Ma J, Mannoor K, Guarnera MA, Shetty A, Zhan M. et al. Genome-wide small nucleolar RNA expression analysis of lung cancer by next-generation deep sequencing. International journal of cancer. 2015;136:E623-9
18. Hou J, Aerts J, den Hamer B, van Ijcken W, den Bakker M, Riegman P. et al. Gene expression-based classification of non-small cell lung carcinomas and survival prediction. PloS one. 2010;5:e10312
19. Gautier L, Cope L, Bolstad BM, Irizarry RA. affy-analysis of Affymetrix GeneChip data at the probe level. Bioinformatics (Oxford, England). 2004;20:307-15
20. Langfelder P, Horvath S. WGCNA: an R package for weighted correlation network analysis. BMC bioinformatics. 2008;9:559
21. Shannon P, Markiel A, Ozier O, Baliga NS, Wang JT, Ramage D. et al. Cytoscape: a software environment for integrated models of biomolecular interaction networks. Genome research. 2003;13:2498-504
22. Bindea G, Mlecnik B, Hackl H, Charoentong P, Tosolini M, Kirilovsky A. et al. ClueGO: a Cytoscape plug-in to decipher functionally grouped gene ontology and pathway annotation networks. Bioinformatics (Oxford, England). 2009;25:1091-3
23. Yu G, Wang LG, Han Y, He QY. clusterProfiler: an R package for comparing biological themes among gene clusters. Omics: a journal of integrative biology. 2012;16:284-7
24. Armengol G, Eissa S, Lozano JJ, Shoman S, Sumoy L, Caballin MR. et al. Genomic imbalances in Schistosoma-associated and non-Schistosoma-associated bladder carcinoma. An array comparative genomic hybridization analysis. Cancer genetics and cytogenetics. 2007;177:16-9
25. Cornen S, Guille A, Adelaide J, Addou-Klouche L, Finetti P, Saade MR. et al. Candidate luminal B breast cancer genes identified by genome, gene expression and DNA methylation profiling. PloS one. 2014;9:e81843
26. Nowak NJ, Gaile D, Conroy JM, McQuaid D, Cowell J, Carter R. et al. Genome-wide aberrations in pancreatic adenocarcinoma. Cancer genetics and cytogenetics. 2005;161:36-50
27. Huh J, Tiu RV, Gondek LP, O'Keefe CL, Jasek M, Makishima H. et al. Characterization of chromosome arm 20q abnormalities in myeloid malignancies using genome-wide single nucleotide polymorphism array analysis. Genes, chromosomes & cancer. 2010;49:390-9
28. Chen W, Ding J, Jiang L, Liu Z, Zhou X, Shi D. DNA copy number profiling in microsatellite-stable and microsatellite-unstable hereditary non-polyposis colorectal cancers by targeted CNV array. Functional & integrative genomics. 2017;17:85-96
29. Beermann J, Piccoli MT, Viereck J, Thum T. Non-coding RNAs in Development and Disease: Background, Mechanisms, and Therapeutic Approaches. Physiological reviews. 2016;96:1297-325
30. Anastasiadou E, Jacob LS, Slack FJ. Non-coding RNA networks in cancer. Nature reviews Cancer. 2018;18:5-18
31. Ganot P, Caizergues-Ferrer M, Kiss T. The family of box ACA small nucleolar RNAs is defined by an evolutionarily conserved secondary structure and ubiquitous sequence elements essential for RNA accumulation. Genes & development. 1997;11:941-56
32. de Bruin EC, McGranahan N, Mitter R, Salm M, Wedge DC, Yates L. et al. Spatial and temporal diversity in genomic instability processes defines lung cancer evolution. Science (New York, NY). 2014;346:251-6
33. Siprashvili Z, Webster DE, Johnston D, Shenoy RM, Ungewickell AJ, Bhaduri A. et al. The noncoding RNAs SNORD50A and SNORD50B bind K-Ras and are recurrently deleted in human cancer. Nature genetics. 2016;48:53-8
34. Ma Z, Gu S, Song M, Yan C, Hui B, Ji H. et al. Long non-coding RNA SNHG17 is an unfavourable prognostic factor and promotes cell proliferation by epigenetically silencing P57 in colorectal cancer. Molecular bioSystems. 2017;13:2350-61
35. Mei YP, Liao JP, Shen J, Yu L, Liu BL, Liu L. et al. Small nucleolar RNA 42 acts as an oncogene in lung tumorigenesis. Oncogene. 2012;31:2794-804
36. Comprehensive molecular profiling of lung adenocarcinoma. Nature. 2014; 511: 543-50.
37. Paroo Z, Ye X, Chen S, Liu Q. Phosphorylation of the human microRNA-generating complex mediates MAPK/Erk signaling. Cell. 2009;139:112-22
38. Reddy KB, Nabha SM, Atanaskova N. Role of MAP kinase in tumor progression and invasion. Cancer metastasis reviews. 2003;22:395-403
39. Lim S, Kaldis P. Cdks, cyclins and CKIs: roles beyond cell cycle regulation. Development (Cambridge, England). 2013;140:3079-93
40. Marcucci F, Stassi G, De Maria R. Epithelial-mesenchymal transition: a new target in anticancer drug discovery. Nature reviews Drug discovery. 2016;15:311-25
41. Lamouille S, Xu J, Derynck R. Molecular mechanisms of epithelial-mesenchymal transition. Nature reviews Molecular cell biology. 2014;15:178-96
42. Okada T, Sinha S, Esposito I, Schiavon G, Lopez-Lago MA, Su W. et al. The Rho GTPase Rnd1 suppresses mammary tumorigenesis and EMT by restraining Ras-MAPK signalling. Nature cell biology. 2015;17:81-94
43. Chen L, Guo P, He Y, Chen Z, Chen L, Luo Y. et al. HCC-derived exosomes elicit HCC progression and recurrence by epithelial-mesenchymal transition through MAPK/ERK signalling pathway. Cell death & disease. 2018;9:513
44. Hu X, Zhai Y, Kong P, Cui H, Yan T, Yang J. et al. FAT1 prevents epithelial mesenchymal transition (EMT) via MAPK/ERK signaling pathway in esophageal squamous cell cancer. Cancer letters. 2017;397:83-93
Author contact
![]() Corresponding authors: Dr. Conghua Xie, Email: chxie_65edu.cn, Tel: +86-27-67812607; Dr. Yan Gong, Email: yan.gongedu.cn, Tel: +86-27-67811461
Corresponding authors: Dr. Conghua Xie, Email: chxie_65edu.cn, Tel: +86-27-67812607; Dr. Yan Gong, Email: yan.gongedu.cn, Tel: +86-27-67811461