Impact Factor ISSN: 1837-9664

 Global reach, higher impact
J Cancer 2019; 10(10):2205-2219. doi:10.7150/jca.30612 This issue Cite
Research Paper
The prognostic value of the proteasome activator subunit gene family in skin cutaneous melanoma
Qiaoqi Wang1*, Fuqiang Pan1*, Sizhu Li2, Rui Huang3, Xiangkun Wang4, Shijun Wang5, Xiwen Liao4, Dong Li1 ![]() , Liming Zhang1
, Liming Zhang1 ![]()
1. Department of Medical Cosmetology, The Second Affiliated Hospital of Guangxi Medical University, Nanning, Guangxi Zhuang Autonomous Region, People's Republic of China
2. Department of Medical Oncology, The First Affiliated Hospital of Guangxi Medical University, Nanning, Guangxi Zhuang Autonomous Region, People's Republic of China
3. Department of Hematology, The First Affiliated Hospital of Guangxi Medical University, Nanning, Guangxi Zhuang Autonomous Region, People's Republic of China
4. Department of Hepatobiliary Surgery, The First Affiliated Hospital of Guangxi Medical University, Nanning, Guangxi Zhuang Autonomous Region, People's Republic of China
5. Department of Colorectal and Anal Surgery, The First Affiliated Hospital of Zhengzhou University, Zhengzhou, Henan Province, People's Republic of China
*These authors contributed to the work equally and should be regarded as co-first authors
Received 2018-10-12; Accepted 2019-4-25; Published 2019-5-22
Abstract
Background: The functional significance of the proteasome activator subunit (PSME) gene family in the pathogenesis of skin cutaneous melanoma (SKCM) remains to be elucidated.
Materials and methods: Clinical data for patients with SKCM, including expression levels of PSME genes, were extracted from TCGA. GO term and KEGG pathway enrichment analyses were performed. Correlations between the expression levels of PSME genes in SKCM were evaluated with the Pearson correlation coefficient. Functional and enrichment analyses were conducted using DAVID. Univariate and multivariate survival analyses adjusted by Cox regression were used to construct a prognostic signature. The mechanisms underlying the association between PSME gene expression and overall survival (OS) were explored with gene set enrichment analysis. Joint-effects survival analysis was performed to evaluate the clinical value of the prognostic signature.
Results: The median expression levels of PSME1, PSME2 and PSME3 were significantly higher in SKCM than in normal skin. PSME1, PSME2, and PSME3 were significantly enriched in several biological processes and pathways including cell adhesion, adherens junction organization, regulation of autophagy, cellular protein localization, the cell cycle, apoptosis, and the Wnt and NF-κB pathways. High expression levels of PSME1 and PSME2 combined with a low expression level of PSME3 was associated with favorable OS.
Conclusion: Knowledge of the expression levels of the PSME gene family could provide a sensitive strategy for predicting prognosis in SKCM.
Keywords: Proteasome activator subunit, melanoma, prognosis, nomogram, overall survival
Introduction
Skin cutaneous melanoma (SKCM) is considered one of the most aggressive and lethal cancers of the skin. In 2012, globally, there were an estimated 232,000 new cases of melanoma and 55,000 melanoma-related deaths.[1] In 2018, in the United States, there will be approximately 91,270 new cases of melanoma and 9,320 melanoma-related deaths.[2] Tumor stage is significantly associated with prognosis in melanoma, whereby early diagnosis and treatment results in favorable overall survival (OS) rates.[3]
Proteasome activator subunit 1 (PSME1), proteasome activator subunit 2 (PSME2), proteasome activator subunit 3 (PSME3) and proteasome activator subunit 4 (PSME4) are members of the proteasome activator subunit (PSME) gene family. Proteasome activator 28 (PA28) consists of three subunits, PA28α, PA28β and PA28γ, encoded by PSME1, PSME2 and PSME3, respectively. Proteasome activators regulate proteasome function but have also been associated with several cancers and may have prognostic significance. Previous studies showed elevated expression of PSME1 in prostate cancer,[4] elevated expression of PSME2 in gastric cancer,[5] and elevated expression of PSME3 in breast cancer,[6-9] colorectal cancer,[10] and laryngeal carcinoma.[11] In some cancers, overexpression of PSME3 was associated with poor OS.[6, 12] Currently, the functional significance of PSME4 in the pathogenesis of cancer remains to be elucidated.
The objectives of the present study were to 1) identify associations between PSME gene expression levels in SKCM and 2) develop a risk score that includes clinical factors and the expression patterns of PSME genes to predict prognosis in patients with SKCM. In the present research, we were the first to analysis the prognosis value of PSME gene family in SKCM, made a nomogram model for predicting the prognosis of SKCM patients, and used whole-genome RNA-Seq dataset to explore prospective molecular mechanisms through gene set enrichment analysis (GSEA) approach.
Method and Materials
Data source
Clinical data for patients with SKCM, including gender, age, survival time, mortality, and expression levels of PSME genes, were extracted from The Cancer Genome Atlas (TCGA). Boxplots of expression profiles of the PSME genes in SKCM and healthy skin were created using Gene Expression Profiling Interactive Analysis (GEPIA, http://gepia.cancer-pku.cn/, accessed on June 20, 2018).[13] After exclusive the patients, which don't have gene expression data and complete prognostic information including survival status and days, 458 cases were included in ours research.
PSME gene family bioinformatics analysis and correlation analysis
Gene ontology (GO) term enrichment analysis, including molecular function (MF), cellular component (CC), and biological process (BP), as well as the Kyoto Encyclopedia of Genes and Genomes (KEGG) pathway enrichment analysis were performed. PSME gene co-expression networks and/or pathways were predicted with GeneMANIA (http://genemania.org/, accessed June 22, 2018).[14] Correlations between expression levels of PSME genes in SKCM were evaluated with the Pearson correlation coefficient. Functional and enrichment analyses were conducted using The Database for Annotation, Visualization, and Integrated Discovery (DAVID) v.6.8 (https://david.ncifcrf.gov/tools.jsp, accessed June 22, 2018).[15, 16]
Survival analysis
Prognosis of patients with SKCM was determined by OS. Correlations between expression levels of PSME genes in SKCM and patients' OS were evaluated using the Kaplan-Meier method and the log-rank test as well as Cox proportional hazards regression with adjustment for age and tumor stage; race was excluded as a variable due to small sample size (94% of the included patients were White). PSME genes were stratified by high or low expression around the median OS. The prognostic impact of high and low expression levels of each PSME gene was assessed.
Prognostic risk score
A prognostic risk score was developed based on the adjusted (age, tumor stage) expression levels of the PSME1, PSME2 and PSME3 genes in SKCM. Nomograms for predicting 1-, 3-, and 5-year survival were used to evaluate the association between the prognostic risk score and OS in patients with SKCM and its potential clinical application;[17] a high score was associated with poor prognosis.
Gene set enrichment analysis (GSEA)
The mechanisms underlying the association between PSME gene expression in SKCM and patients' OS were explored with GSEA. Pathway-based analysis in SKCM with high and low expression levels of each PSME gene was conducted using comparisons with the reference c5 (GO gene sets: c5.all.v6.1.symbols.gmt) and c2 (KEGG gene sets: c2.all.v6.1.symbols.gmt) gene sets from the Molecular Signatures Database (MSigDB) [18] using GSEA v.3.0 (http://software.broadinstitute.org/gsea/msigdb/index.jsp, accessed June 25, 2018). The number of permutations was set at 1,000. P<0.05 and a false discovery rate (FDR) <0.25 were considered statistically significant.
Joint-effects survival analysis
Associations between the expression levels of combinations of PSME genes in SKCM and patients' OS were assessed with joint-effects survival analysis. PSME genes with prognostic value on multivariate survival analysis were grouped as better OS, worse OS, or other. The prognostic value of the expression of combinations of PSME genes in each group was evaluated using the Kaplan-Meier method and the log-rank test.
Statistical analyses
Statistical analyses were performed with SPSS v.25.0 software (IBM, Chicago, IL, USA). Vertical scatter plots and survival curves were generated in GraphPad Prism v.7.0 (GraphPad Software, La Jolla, CA, USA) and R 3.5.1 (http://www.R-project.org). OS was calculated with the Kaplan-Meier method and the log-rank test. Multivariate survival analysis was evaluated with hazard ratios (HR), and 95% confidence intervals (CIs) were calculated using Cox proportional hazards regression with adjustment for influential clinical characteristics including age and tumor stage. P<0.05 was considered statistically significant.
Results
Patients' clinical characteristics
Demographic and clinical data obtained from TCGA for 458 patients with SKCM are summarized. The associations between demographic and clinical characteristics and OS in patients with SKCM are summarized in Table 1. Race, age and tumor stage were significantly associated with median survival time (MST; P=0.004, P=0.001, and P=0.001, respectively).
Clinical data for included patients.
| Variables | Patients (n=458) | No. of events (%) | MST (days) | HR (95% CI) | Log-rank P |
|---|---|---|---|---|---|
| Race | 0.004 | ||||
| White | 435 | 208 (47.8%) | 2454 | Ref. | |
| Others | 13 | 8 (61.5%) | 636 | 0.348 (0.171-0.709) | |
| Gender | 0.278 | ||||
| Male | 284 | 146 (51.4%) | 2454 | Ref. | |
| Female | 174 | 72 (41.4%) | 2030 | 0854 (0.642-1.136) | |
| Age (years) | 0.001 | ||||
| ≥60 | 219 | 102 (46.6%) | 1860 | Ref. | |
| <60 | 239 | 116 (48.3%) | 3564 | 0.620 (0.470-2.136) | |
| Tumor stage | 0.001 | ||||
| 0+I+II+I/II nos | 231 | 108 (46.8%) | 3259 | Ref. | |
| III+IV | 191 | 91 (47.6%) | 1960 | 0.600 (0.449-0.802) | |
| Missing | 36 |
Abbreviations: PSME, proteasome activator subunit; MST, median survival time; HR, hazard ratio; CI, confidence interval.
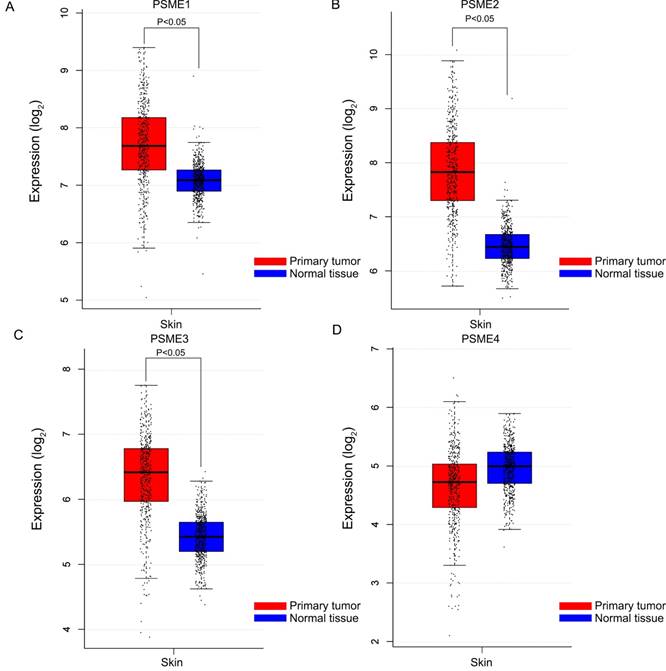
Boxplots showing the expression profiles of PSME genes in SKCM or healthy skin are presented in Figure 1. Findings showed that median expression levels of PSME1, PSME2 and PSME3 were significantly higher in SKCM than in healthy skin.
Boxplots showing PSME gene expression levels in SKCM and healthy skin. (A) PSME1; (B) PSME2; (C) PSME3; (D) PSME4. Abbreviations: PSME, proteasome activator subunit; GEPIA, gene expression profiling interactive analysis
PSME gene family correlation analysis and bioinformatics analysis
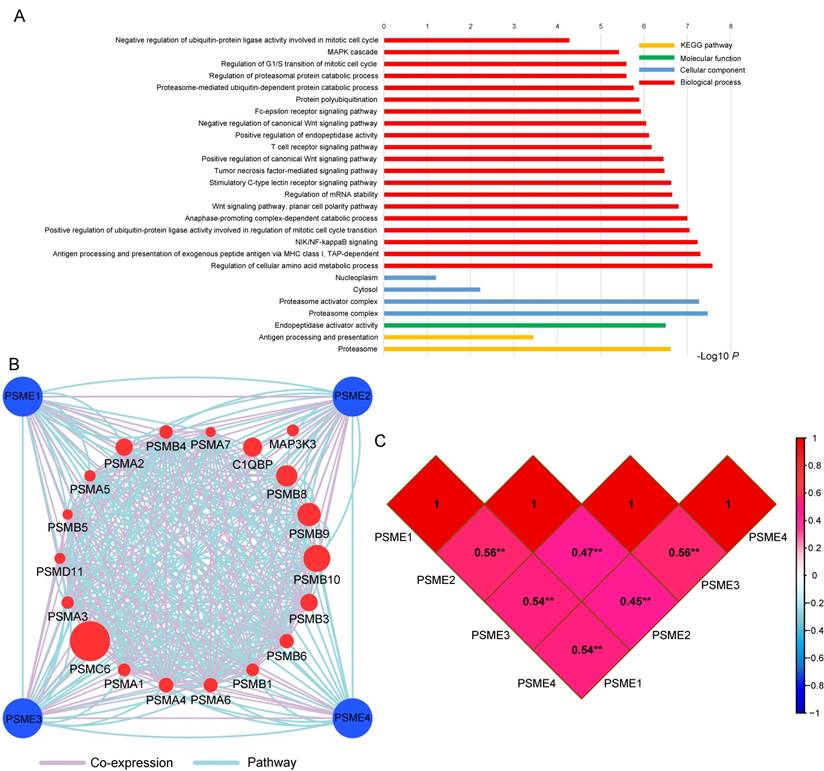
GO term analysis and KEGG pathway enrichment analysis are shown in Figure 2A. The PSME gene family was involved in the MAPK cascade, NIF/NF-κB and Wnt signaling pathways and the cell cycle, which are tumor-related processes. The pathway and co-expression prediction among PSME1, PSME2 and PSME3 is shown in Figure 2B. Correlations between the expression levels of individual PSME genes in SKCM investigated with Pearson correlation coefficient are shown in Figure 2C. There were correlations between the expression levels of all PSME genes except for PSME1 and PSME3 and PSME2 and PSME3.
(A) GO enrichment and KEGG pathway analysis by DAVID; (B) Gene interaction networks among selected genes by GeneMANIA; (C) Pearson's correlation coefficients between PSME1, PSME2 and PSME3 expression levels; and **P<0.001. Abbreviations: PSME, proteasome activator subunit; TCGA, The Cancer Genome Atlas; GeneMANIA, gene multiple association network integration algorithm; DAVID, the database for annotation, visualization, and integrated discovery; GO, gene ontology; KEGG, Kyoto encyclopedia of genes and genomes.
Survival analysis
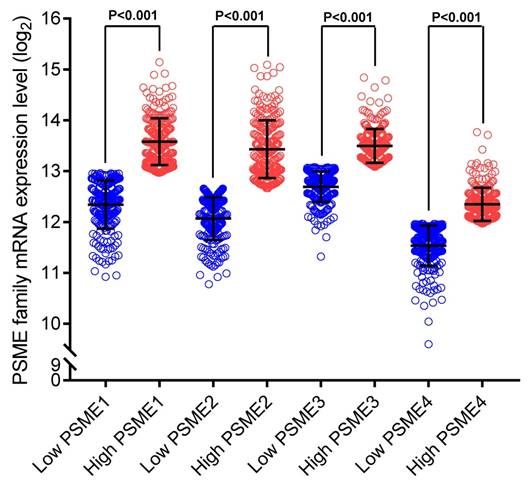
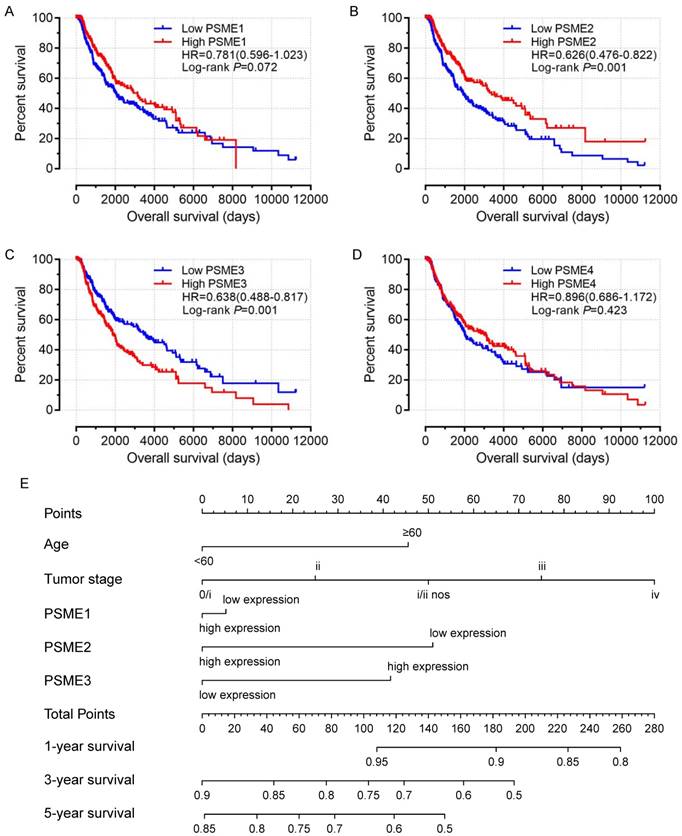
Scatter plots showing the expression levels of PSME genes in SKCM, stratified as high expression or low expression, are shown in Figure 3. Survival analysis is summarized in Table 2 and shown in Figure 4. On univariate survival analysis, a high expression level of PSME2 (log-rank P=0.001, HR=0.626, 95%CI=0.476-0.822; Figure 4B) and low expression level of PSME3 (log-rank P=0.001, HR=0.638, 95%CI=0.488-0.817; Figure 4C) in SKCM were associated with better OS. On multivariate survival analysis, a high expression level of PSME1 (log-rank P=0.009 HR=0.685 95%CI=0.516-0.910), high expression level of PSME2 (log-rank P=0.001 HR=0.576 95%CI=0.431-0.769), and low expression level of PSME3 (log-rank P=0.002 HR=0.634 95%CI=0.477-0.842) in SKCM were associated with better OS.
Scatter plots showing PSME1, PSME2 and PSME3 expression levels in SKCM Abbreviations: PSME, proteasome activator subunit; SKCM, skin cutaneous melanoma.
Univariate and multivariate survival analyses.
| Gene | Patients (n=458) | No. of events (%) | MST (days) | Crude HR (95% CI) | Crude P | Adjusted HR* (95% CI) | Adjusted P* |
|---|---|---|---|---|---|---|---|
| PSME1 | 0.072 | 0.009 | |||||
| Low | 229 | 124 (54.1%) | 2030 | Ref. | Ref. | ||
| High | 229 | 94 (41.0%) | 3136 | 0.781 (0.596-1.023) | 0.685 (0.516-0.910) | ||
| PSME2 | 0.001 | 0.001 | |||||
| Low | 229 | 133 (58.1%) | 1917 | Ref | Ref. | ||
| High | 229 | 85 (37.1%) | 3379 | 0.626(0.476-0.822) | 0.576 (0.431-0.769) | ||
| PSME3 | 0.001 | 0.002 | |||||
| High | 229 | 114 (49.8%) | 1910 | Ref. | Ref. | ||
| Low | 229 | 104 (45.4%) | 3564 | 0.638 (0.488-0.817) | 0.634 (0.477-0.842) | ||
| PSME4 | 0.423 | 0.410 | |||||
| Low | 229 | 100 (43.7%) | 2028 | Ref. | Ref. | ||
| High | 229 | 118 (51.5%) | 2993 | 0.896 (0.686-1.172) | 0.888(0.669-1.178) |
Notes: *, adjustment for age and tumor stage.
Abbreviations: PSME, proteasome activator subunit; MST, median survival time; HR, hazard ratio; CI, confidence interval.
Univariate survival analysis and nomogram. (A) PSME1, (B) PSME2, (C) PSME3, (D) PSME4, (E) nomogram to predict survival in SKCM. Abbreviation: PSME, proteasome activator subunit; SKCM, skin cutaneous melanoma.
Nomogram of SKCM risk score model
A nomogram substantiated that age, tumor stage, and PSME2 and PSME3 expression levels in SKCM created a prognostic signature that contributed the most risk (range 0-100 points) for poor OS. Each variable was assigned points based on the Cox regression coefficients. These points were summed, and the probability of survival was estimated by drawing a vertical line between the Total Points axis and the 1-year, 3-year and 5-year survival probability axes (Figure 4E).
GSEA
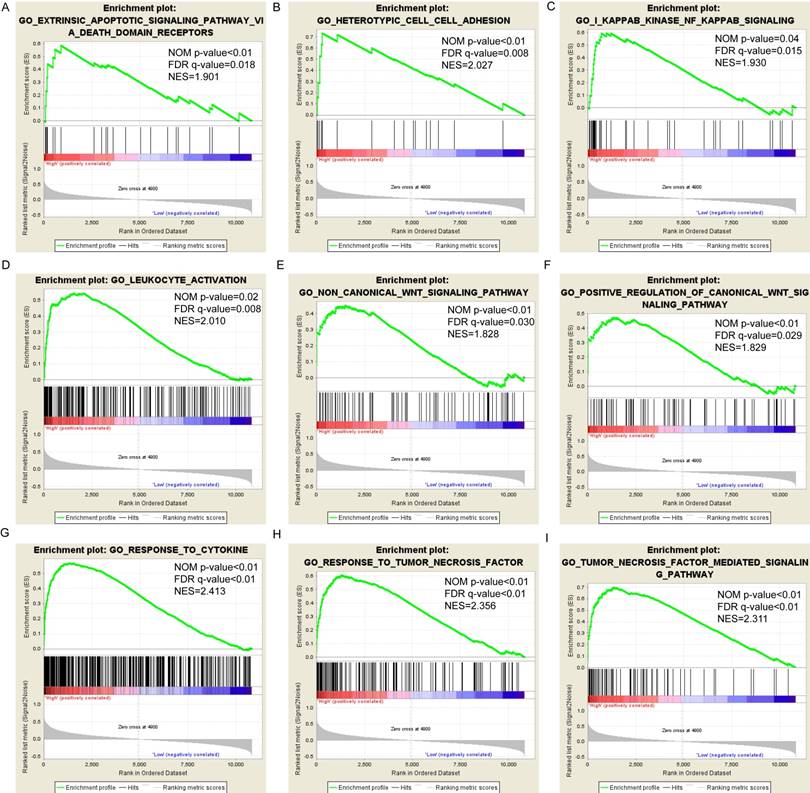
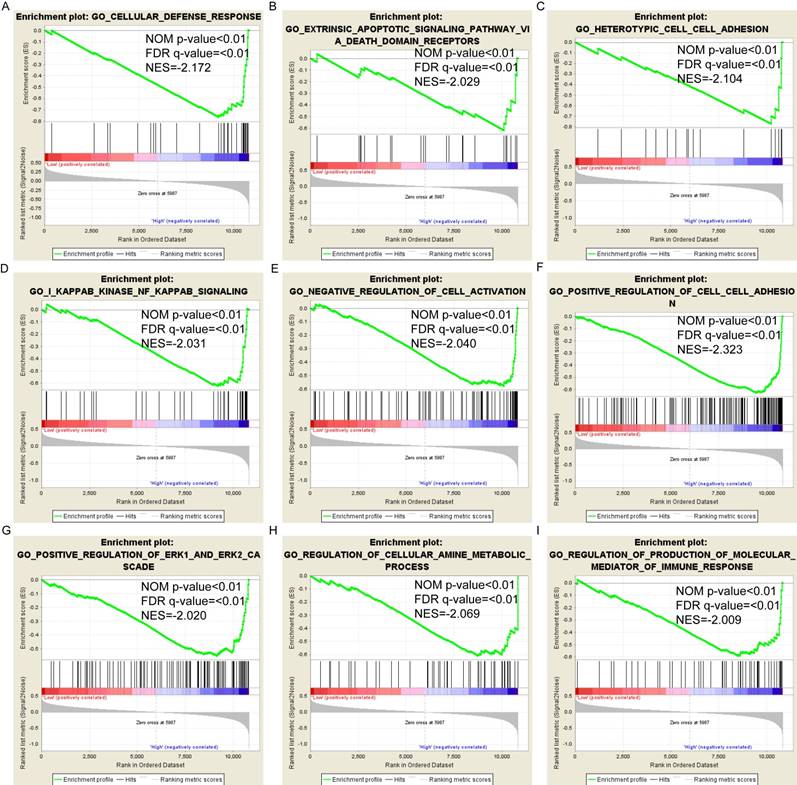
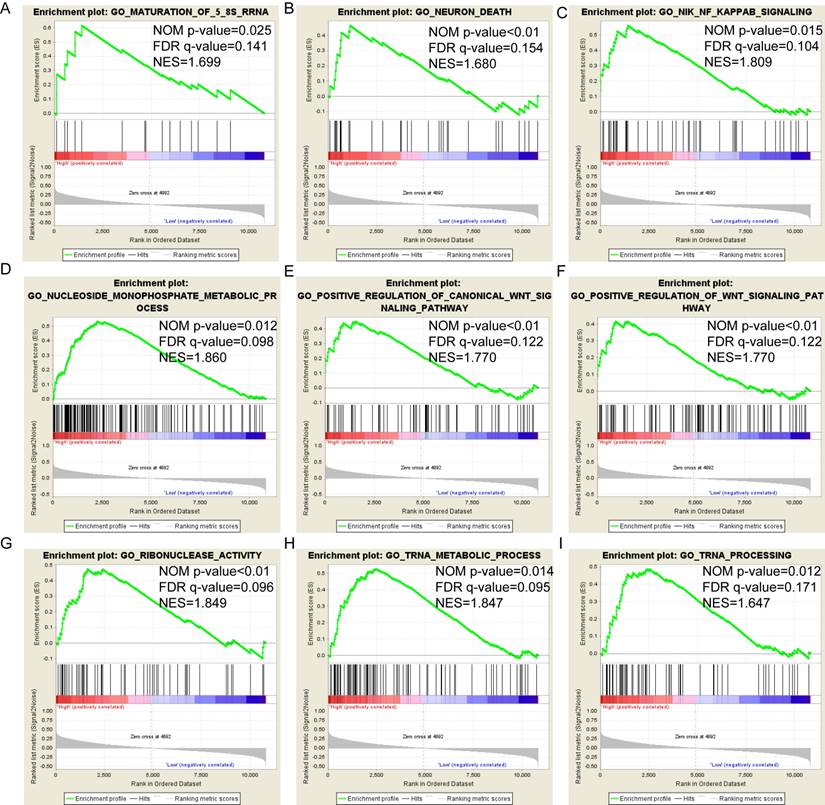
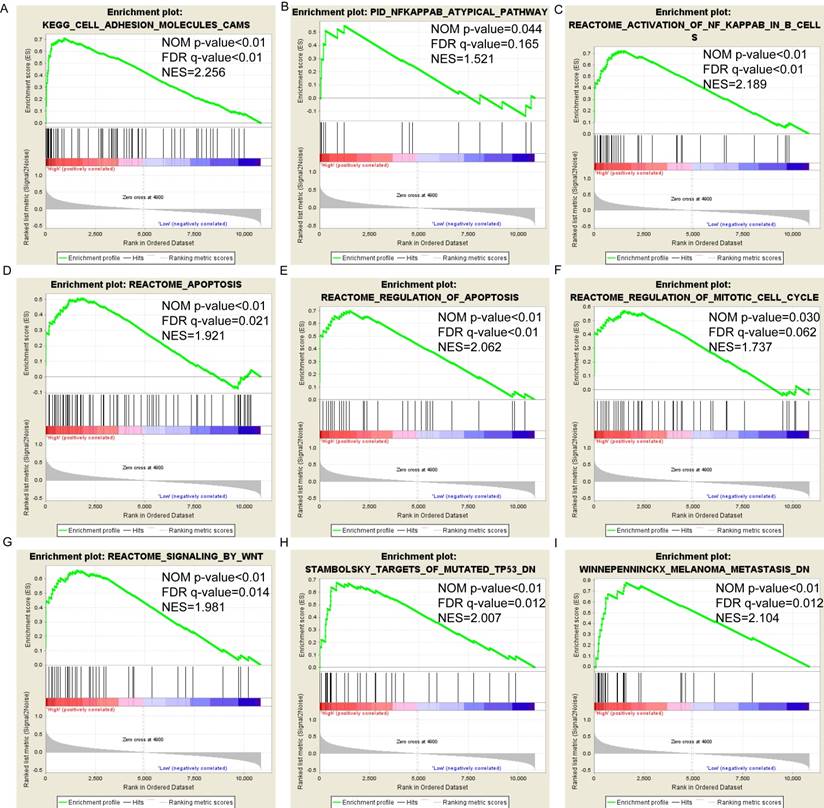
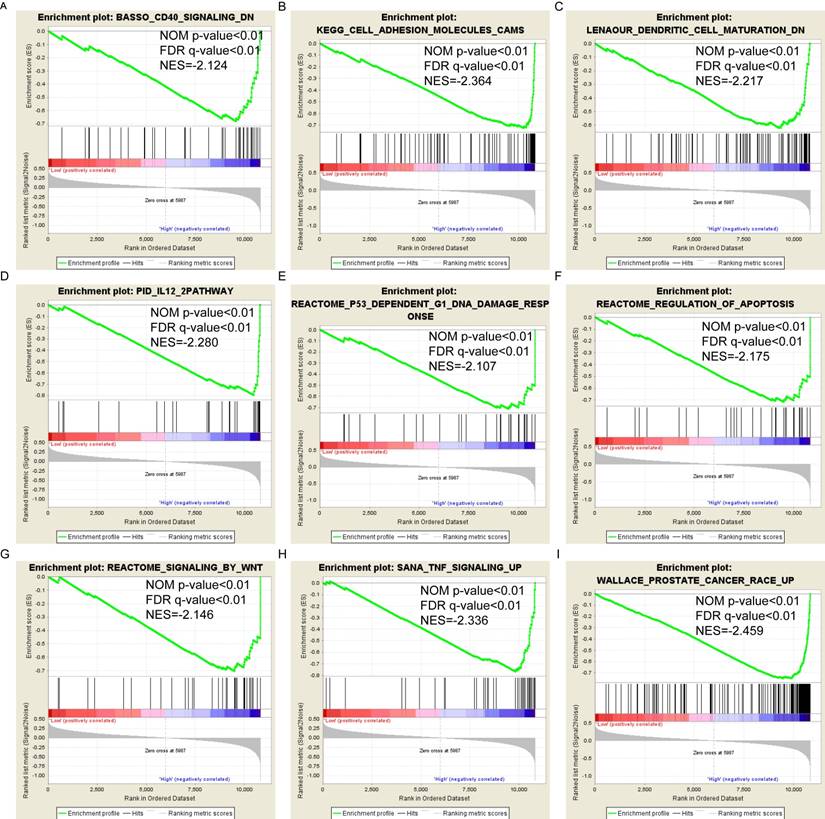
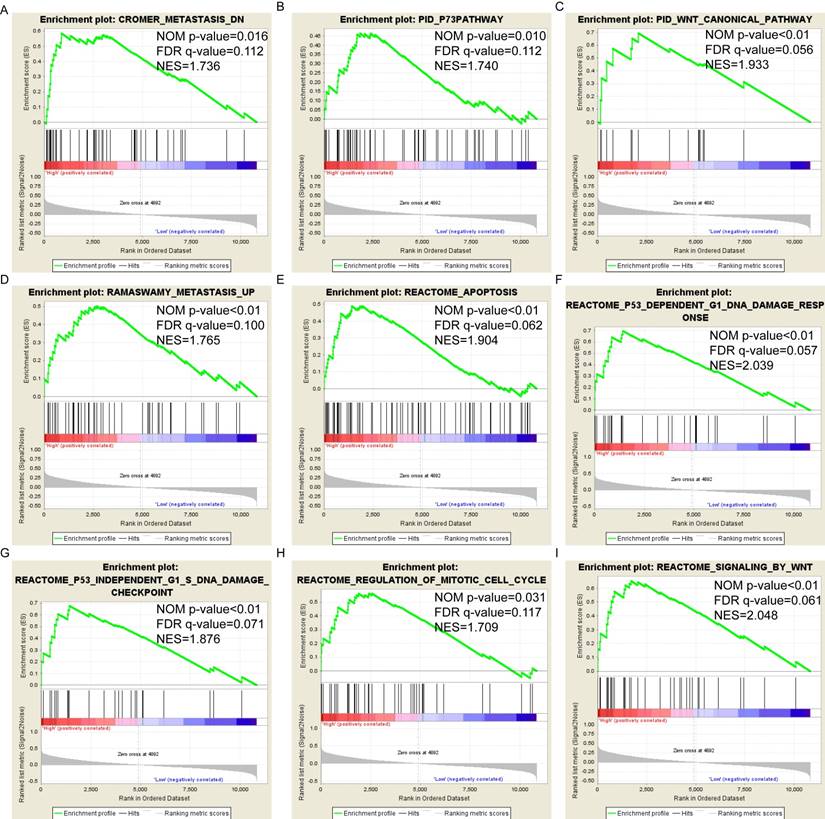
Pathway-based analysis in SKCM with high and low expression levels of each PSME gene is shown in Figure 5 (A-I), Figure 6 (A-I), Figure 7 (A-I), Figure 8 (A-I), Figure 9 (A-I) and Figure 10 (A-I). In the GO enrichment analysis, a high expression of PSME1 was positively correlated with the apoptotic process (Figure 5A), cell adhesion (Figure 5B), and the NF-κB (Figure 5C) and Wnt signaling pathways (Figure 5E, F). High expression of PSME2 was negatively correlated with the apoptotic process (Figure 6B), cell adhesion (Figure 6C, F), and the NF-κB signaling pathway (Figure 6D). High expression of PSME3 was positively correlated with the NF-κB (Figure 7C) and Wnt signaling pathways (Figure 7E, F). In the KEGG pathway, high expression of PSME1 was positively correlated with cell adhesion (Figure 8A), apoptosis (Figure 8 D, E), the cell cycle (Figure 8F), metastasis (Figure 8I) and the Wnt and NF-κB signaling pathways (Figure 8 B, C and G). High expression of PSME2 was negatively correlated with cell adhesion (Figure 9B), the cell cycle (Figure 9E), apoptosis (Figure 9F) and the Wnt signaling pathway (Figure 9G). High expression of PSME3 was positively correlated with metastasis (Figure 10A, D), the P53-induced cell cycle (Figure 10F, G), the cell cycle (Figure 10H), and the Wnt signaling pathway (Figure 10C, I). The remaining results were presented in Supplementary Table 1 and 2.
(A-I) GO enrichment analysis by low and high PSME1 expression levels. Abbreviations: NES, Normalized enrichment score; FDR, false discovery rate; GSEA, gene set enrichment analysis; GO, gene ontology.
(A-I) GO enrichment analysis by low and high PSME2 expression levels. Abbreviations: NES, normalized enrichment score; FDR, false discovery rate; GSEA, gene set enrichment analysis; GO, gene ontology.
(A-I) GO enrichment analysis by low and high PSME3 expression levels. Abbreviations: NES, normalized enrichment score; FDR, false discovery rate; GSEA, gene set enrichment analysis; GO, gene ontology.
(A-I) KEGG pathway analysis by low and high PSME1 expression levels. Abbreviations: NES, normalized enrichment score; FDR, false discovery rate; GSEA, gene set enrichment analysis; KEGG, Kyoto encyclopedia of genes and genomes.
(A-I) KEGG pathway analysis by low and high PSME2 expression levels. Abbreviations: NES, normalized enrichment score; FDR, false discovery rate; GSEA, gene set enrichment analysis; KEGG, Kyoto encyclopedia of genes and genomes.
(A-I) KEGG pathway analysis by low and high PSME3 expression levels. Abbreviations: NES, normalized enrichment score; FDR, false discovery rate; GSEA, gene set enrichment analysis; KEGG, Kyoto encyclopedia of genes and genomes.
Joint-effects survival analysis
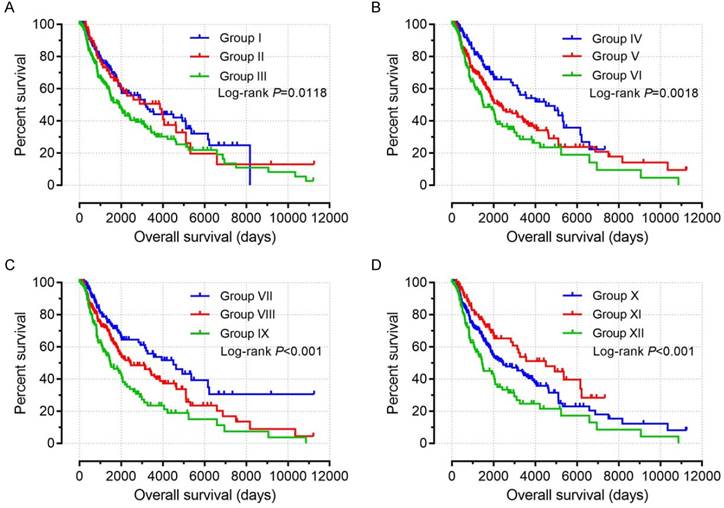
Based on the findings on multivariate survival analysis, a joint-effects survival analysis was performed to determine the combined effects of PSME1, PSME2 and PSME3 in SKCM on OS in patients grouped as summarized in Table 3. Results are summarized in Table 4 and shown in Figure 11. High expression levels of PSME1 and PSME2 combined with low expression level of PSME3 in SKCM in Groups I, IV, VII, and X was associated with better OS (all P<0.05). In contrast, low expression levels of PSME1 and PSME2 combined with a high expression level of PSME3 in SKCM in Groups III, VI, IX and XII was associated with poor OS (all P<0.05).
Stratifications based on the expression levels of the PSME1, PSME2 and PSME3 genes.
| Group | Composition | Group | Composition |
|---|---|---|---|
| I | high PSME1+high PSME2 | X | high PSME1+high PSME2+low PSME3 |
| II | low PSME1+high PSME2 | XI | |
| high PSME1+low PSME2 | |||
| III | Low PSME1+low PSME2 | high PSME1+low PSME2+high PSME3 | |
| IV | high PSME1+ low PSME3 | low PSME1+high PSME2+high PSME3 | |
| V | low PSME1+low PSME3 | low PSME1+low PSME2+low PSME3 | |
| high PSME1+high PSME3 | high PSME1+high PSME2+high PSME3 | ||
| VI | low PSME1+high PSME3 | high PSME1+low PSME2+low PSME3 | |
| VII | high PSME2+low PSME3 | low PSME1+high PSME2+low PSME3 | |
| VIII | low PSME2+low PSME3 | ||
| high PSME2+high PSME3 | |||
| IX | low PSME2+high PSME5 | XII | Low PSME1+low PSME2+high PSME3 |
Abbreviation: PSME, proteasome activator subunit.
Joint-effects survival analysis.
| Group | Patients (n=458) | MST (days) | Crude P | Crude HR (95% CI) | Adjusted P* | Adjusted HR* (95% CI) |
|---|---|---|---|---|---|---|
| I | 196 | 3195 | 0.005 | 0.655 (0.487-0.881) | 0.004 | 0.645 (0.479-0.867) |
| II | 66 | 3869 | 0.075 | 0.702 (0.476-1.036) | 0.071 | 0.697 (0.470-1.032) |
| III | 196 | 1910 | 0.012 | Ref. | 0.009 | Ref. |
| IV | 111 | 4507 | <0001 | 0.494 (0.334-0.730) | <0.001 | 0.486 (0.329-0.719) |
| V | 236 | 2273 | 0.070 | 0.751 (0.552-1.023) | 0.036 | 0.718 (0.527-0.979) |
| VI | 111 | 1487 | 0.002 | Ref. | 0.001 | Ref. |
| VII | 120 | 4570 | <0.001 | 0.430 (0.296-0.624) | <0.001 | 0.428 (0.295-0.622) |
| VIII | 218 | 2454 | 0.007 | 0.660 (0.488-0.893) | 0.004 | 0.643 (0.475-0.871) |
| IX | 120 | 1478 | <0.001 | Ref. | <0.001 | Ref. |
| X | 98 | 4570 | <0.001 | 0.048 (0.296-0.678) | <0.001 | 0.440 (0.290-0.667) |
| XI | 260 | 2454 | 0.011 | 0.671 (0.492-0.914) | 0.006 | 0.645 (0.472-0.881) |
| XII | 100 | 1446 | 0.001 | Ref. | <0.001 | Ref. |
Notes: *, adjustment for age and tumor stage. Bold type highlights statistically significant values (P≤0.05).
Abbreviations: PSME, proteasome activator subunit; MST, median survival time; HR, hazard ratio; CI, confidence interval.
Joint-effects survival analysis of the influence of combined PSME gene expression on OS stratified for PSME1, PSME2 and PSME3 expression levels. (A) PSME1 and PSME2; (B) PSME1 and PSME3; (C) PSME2 and PSME3; (D) PSME1, PSME2 and PSME3. I, high PSME1+high PSME2; III, Low PSME1+low PSME2; IV, high PSME1+ low PSME3; VI, low PSME1+high PSME3; VII, high PSME2+low PSME3; IX, low PSME2+high PSME5; X, high PSME1+high PSME2+low PSME3; XII, Low PSME1+low PSME2+high PSME3. The combinations of genes and unlisted combinations are shown in Table 1. Abbreviation: PSME, proteasome activator subunit.
Discussion
In this study, we used data from TGCA to investigate the associations between PSME gene expression levels in SKCM and developed a risk score that includes clinical factors and the expression patterns of PSME genes to predict prognosis in patients with SKCM. PSME genes, including PSME1, PSME2 and PSME3, encode the PA28α, PA28β and PA28γ subunits, respectively, of PA28, which regulates function of the proteasomei.[19] In the present study, PSME1, PSME2 and PSME3 expression levels were significantly increased in SKCM compared to healthy skin. GO enrichment analysis showed that PSME1 is a negative regulator of cell adhesion, PSME2 is important for cell-cell adhesion and junction organization, and PSME3 is associated with NF-κB signaling. Importantly, the activation of NF-κB can impart invasiveness and properties of cancer initiation on cells, and may act as a target for anti-cancer therapy.[20] GO term analysis also showed that PSME was associated with MAPK cascade, which the pathway was found to be correlated with melanoma.[21, 22] High expression levels of PSME1 and PSME2 combined with a low expression level of PSME3 in SKCM were associated with favorable prognosis. Pathway-based analysis revealed that PSME1 is associated with KEGG and apoptosis pathways and that PSME2 and PSME3 are significantly enriched in the canonical and planar cell polarity Wnt signaling pathways, which have been associated with cancer.[23, 24] Taken together, the findings from the present study suggest that expression levels of the PSME1, PSME2 and PSME3 genes in SKCM, individually and in combination, may be used as potential biomarkers to predict prognosis.
For PSME1, the findings from the present study are in contrast to those from previous reports, which demonstrated that PSME1 expression was increased in primary and metastatic human prostate cancer, PSME1 was a marker in mouse xenograft tumors,[4] and PA28α protein was downregulated in HBV-infected well-differentiated hepatocellular carcinoma.[25] The disparate findings between the present and some previous studies suggest that PSME1 may play different roles in different types of cancer.
Previous reports on PSME2 are in accordance with the results from the present study. Evidence suggests that PA28β protein regulates invasiveness and metastasis in gastric cancer, whereby the invasive abilities of gastric cancer cells were enhanced by the down-regulation of PA28β and inhibited when PA28β was overexpressed,[5] and that PA28β is physically associated with N-α-acetyltransferase 10 protein, which regulates various pathways associated with cancer cell proliferation, metastasis, apoptosis, and autophagy.[26]
The role of PSME3 in cancer has been well characterized. PSME3 knockout mice treated with dextran sodium sulfate to induce acute colitis showed decreased intestinal inflammation and colitis-associated cancer compared to wild-type mice.[27] In oral squamous cell carcinoma, high expression of PSME3 was correlated with worse OS, while PSME3 silencing inhibited the growth, proliferation and mobility of oral squamous cell carcinoma cells in vitro and reduced tumor growth and angiogenesis in mice in vivo .[12] Similarly, PSME3 silencing attenuated the cell proliferation, migration and invasive abilities of endometrial cancer cells. In a model of skin tumorigenesis, PSME3 functioned as an oncogene, whereby the TPA-induced overexpression of PSME3 was dependent on the activation of the MAPK-p38 signaling pathway.[28] In breast cancer, 5-year disease-free survival and OS in patients with undetectable or low PSME3 expression were significantly higher than in patients with high PSME3 expression.[6] In colorectal cancer, PSME3 expression was higher in colorectal cancer tissue than in healthy tissues.[10] Other studies indicate that mutations in the TP53 gene, which encodes the tumor suppressor protein p53, occur in various types of cancer, and that PSME3 negatively regulates p53, whereby the elimination of endogenous PSME3 in human cancer cells abrogates MDM2-mediated p53 degradation, increases the activity of p53, and enhances apoptosis.[29] Notably, p53 mutations show a positive correlation with PSME3 expression in various cancer cell lines.[30] In normal endometrium, expression of PSME3 was increased in p53-positive specimens compared to p53-negative specimens,[31] and in laryngeal carcinoma, the expression of PSME3 was correlated with p53 and p21.[11, 32-34]
Despite the wealth of literature on the role of PSME genes in cancer, to the authors' knowledge, the present study is the first to develop a risk score that includes clinical factors and the expression patterns of PSME genes to predict prognosis in patients with SKCM. The risk score can be used to stratify patients with SKCM into groups at high or low risk for poor prognosis. Univariate survival analysis showed that a high expression level of PSME2 and low expression level of PSME3 in SKCM were correlated with favorable OS. Multivariate survival analysis showed that high expression level of PSME1, adjusted by age and tumor stage, in SKCM was also correlated with favorable prognosis. Joint-effects survival analysis showed that high expression levels of PSME1 and PSME2 combined with a low expression level of PSME3 in SKCM was associated with favorable OS. In contrast, low expression levels of PSME1 and PSME2 combined with a high expression level of PSME3 was associated with poor OS.
This study had several limitations. First, the sample size was small. In particular, a more ethnically diverse study population is required. In the present study, the majority of subjects were White. Second, clinical information, including information on sun exposure and genetic factors, was lacking. Third, the patients in the current study were from a single cohort, which may introduce bias. Findings from the present study should be verified in a larger and more diverse set of patients. Forth, our current study is a bioinformatics research and most of the findings were generated from public database and bioinformatics analysis, which lack of verification through in vitro and in vivo experiments. Finally, SKCM is the melanoma of skin is a fairly rare disease and the related resources are also rare, so this study lake of validation methods to confirm the results including independent cohort. Therefore, results of current study still need further verified.
Despite these limitations, to the authors' knowledge, this is the first study to demonstrate that high expression levels of PSME1 and PSME2 combined with a low expression level of PSME3 is associated with favorable prognosis in SKCM. These findings may have prognostic significance in SKCM. The prognostic model constructed in this study may have value in clinical applications.
Conclusion
Findings from the present study indicate that a high expression of PSME1 and PSME2 and low expression of PSME3 are associated with favorable prognosis and may act as potential prognostic biomarkers in SKCM. The combined expression levels of these genes could provide a sensitive strategy for predicting prognosis in SKCM.
Supplementary Material
Supplementary table 1.
Supplementary table 2.
Acknowledgements
This work was supported in part by the National Nature Science Foundation of China (No: 81760344). The authors thank TCGA (https://cancergenome.nih.gov/) and UCSC Xena (http://xena.ucsc.edu/) for sharing the SKCM data.
Ethics approval and consent to participate
This article does not contain any studies with human participants or animals performed by any of the authors. Since all datasets included in the present study were downloaded from TCGA, additional approval by an Ethics Committee was not needed. The procedures were in accordance with the Helsinki declaration of 1964 and its later amendments.
Competing Interests
The authors have declared that no competing interest exists.
References
1. Ferlay J, Soerjomataram I, Dikshit R, Eser S, Mathers C, Rebelo M. et al. Cancer incidence and mortality worldwide: sources, methods and major patterns in GLOBOCAN 2012. Int J Cancer. 2015;136:E359-86
2. Siegel RL, Miller KD, Jemal A. Cancer statistics, 2018. CA Cancer J Clin. 2018;68:7-30
3. Gershenwald JE, Scolyer RA, Hess KR, Sondak VK, Long GV, Ross MI. et al. Melanoma staging: Evidence-based changes in the American Joint Committee on Cancer eighth edition cancer staging manual. CA Cancer J Clin. 2017;67:472-92
4. Sanchez-Martin D, Martinez-Torrecuadrada J, Teesalu T, Sugahara KN, Alvarez-Cienfuegos A, Ximenez-Embun P. et al. Proteasome activator complex PA28 identified as an accessible target in prostate cancer by in vivo selection of human antibodies. Proc Natl Acad Sci U S A. 2013;110:13791-6
5. Zheng DL, Huang QL, Zhou F, Huang QJ, Lin JY, Lin X. PA28beta regulates cell invasion of gastric cancer via modulating the expression of chloride intracellular channel 1. J Cell Biochem. 2012;113:1537-46
6. Chai F, Liang Y, Bi J, Chen L, Zhang F, Cui Y. et al. High expression of REGgamma is associated with metastasis and poor prognosis of patients with breast cancer. Int J Clin Exp Pathol. 2014;7:7834-43
7. Shi Y, Luo X, Li P, Tan J, Wang X, Xiang T. et al. miR-7-5p suppresses cell proliferation and induces apoptosis of breast cancer cells mainly by targeting REGgamma. Cancer Lett. 2015;358:27-36
8. Chai F, Liang Y, Bi J, Chen L, Zhang F, Cui Y. et al. REGgamma regulates ERalpha degradation via ubiquitin-proteasome pathway in breast cancer. Biochem Biophys Res Commun. 2015;456:534-40
9. Wang X, Tu S, Tan J, Tian T, Ran L, Rodier JF. et al. REG gamma: a potential marker in breast cancer and effect on cell cycle and proliferation of breast cancer cell. Med Oncol. 2011;28:31-41
10. Chen D, Yang X, Huang L, Chi P. The expression and clinical significance of PA28 gamma in colorectal cancer. J Investig Med. 2013;61:1192-6
11. Li LP, Cheng WB, Li H, Li W, Yang H, Wen DH. et al. Expression of proteasome activator REGgamma in human laryngeal carcinoma and associations with tumor suppressor proteins. Asian Pac J Cancer Prev. 2012;13:2699-703
12. Li J, Feng X, Sun C, Zeng X, Xie L, Xu H. et al. Associations between proteasomal activator PA28gamma and outcome of oral squamous cell carcinoma: Evidence from cohort studies and functional analyses. EBioMedicine. 2015;2:851-8
13. Tang Z, Li C, Kang B, Gao G, Li C, Zhang Z. GEPIA: a web server for cancer and normal gene expression profiling and interactive analyses. Nucleic Acids Res. 2017;45:W98-W102
14. Warde-Farley D, Donaldson SL, Comes O, Zuberi K, Badrawi R, Chao P. et al. The GeneMANIA prediction server: biological network integration for gene prioritization and predicting gene function. Nucleic Acids Res. 2010;38:W214-20
15. Huang DW, Sherman BT, Lempicki RA. Systematic and integrative analysis of large gene lists using DAVID bioinformatics resources. Nature Protocols. 2009;4:44
16. Huang da W, Sherman BT, Lempicki RA. Bioinformatics enrichment tools: paths toward the comprehensive functional analysis of large gene lists. Nucleic Acids Res. 2009;37:1-13
17. Balachandran VP, Gonen M, Smith JJ, Dematteo RP. Nomograms in Oncology - More than Meets the Eye. Lancet Oncology. 2015;16:e173
18. Subramanian A, Tamayo P, Mootha VK, Mukherjee S, Ebert BL, Gillette MA. et al. Gene set enrichment analysis: a knowledge-based approach for interpreting genome-wide expression profiles. Proc Natl Acad Sci U S A. 2005;102:15545-50
19. Nomura N, Nagase T, Miyajima N, Sazuka T, Tanaka A, Sato S. et al. Prediction of the coding sequences of unidentified human genes. II. The coding sequences of 40 new genes (KIAA0041-KIAA0080) deduced by analysis of cDNA clones from human cell line KG-1 (supplement). DNA Res. 1994;1:251-62
20. Vlahopoulos SA, Cen O, Hengen N, Agan J, Moschovi M, Critselis E. et al. Dynamic aberrant NF-kappaB spurs tumorigenesis: a new model encompassing the microenvironment. Cytokine Growth Factor Rev. 2015;26:389-403
21. Wellbrock C. MAPK pathway inhibition in melanoma: resistance three ways. Biochem Soc Trans. 2014;42:727-32
22. Konieczkowski DJ, Johannessen CM, Abudayyeh O, Kim JW, Cooper ZA, Piris A. et al. A melanoma cell state distinction influences sensitivity to MAPK pathway inhibitors. Cancer Discov. 2014;4:816-27
23. Goessling W, North TE, Loewer S, Lord AM, Lee S, Stoick-Cooper CL. et al. Genetic interaction of PGE2 and Wnt signaling regulates developmental specification of stem cells and regeneration. Cell. 2009;136:1136-47
24. Anastas JN, Moon RT. WNT signalling pathways as therapeutic targets in cancer. Nat Rev Cancer. 2013;13:11-26
25. Zhang D, Lim SG, Koay ES. Proteomic identification of down-regulation of oncoprotein DJ-1 and proteasome activator subunit 1 in hepatitis B virus-infected well-differentiated hepatocellular carcinoma. Int J Oncol. 2007;31:577-84
26. Min L, Xu H, Wang J, Qu L, Jiang B, Zeng Y. et al. N-alpha-acetyltransferase 10 protein is a negative regulator of 28S proteasome through interaction with PA28beta. FEBS Lett. 2013;587:1630-7
27. Xu J, Zhou L, Ji L, Chen F, Fortmann K, Zhang K. et al. The REGgamma-proteasome forms a regulatory circuit with IkappaBvarepsilon and NFkappaB in experimental colitis. Nat Commun. 2016;7:10761
28. Li L, Dang Y, Zhang J, Yan W, Zhai W, Chen H. et al. REGgamma is critical for skin carcinogenesis by modulating the Wnt/beta-catenin pathway. Nat Commun. 2015;6:6875
29. Zhang Z, Zhang R. Proteasome activator PA28 gamma regulates p53 by enhancing its MDM2-mediated degradation. EMBO J. 2008;27:852-64
30. Ali A, Wang Z, Fu J, Ji L, Liu J, Li L. et al. Differential regulation of the REGgamma-proteasome pathway by p53/TGF-beta signalling and mutant p53 in cancer cells. Nat Commun. 2013;4:2667
31. Wang H, Bao W, Jiang F, Che Q, Chen Z, Wang F. et al. Mutant p53 (p53-R248Q) functions as an oncogene in promoting endometrial cancer by up-regulating REGgamma. Cancer Lett. 2015;360:269-79
32. Liu J, Yu G, Zhao Y, Zhao D, Wang Y, Wang L. et al. REGgamma modulates p53 activity by regulating its cellular localization. J Cell Sci. 2010;123:4076-84
33. Gao G, Wong J, Zhang J, Mao I, Shravah J, Wu Y. et al. Proteasome activator REGgamma enhances coxsackieviral infection by facilitating p53 degradation. J Virol. 2010;84:11056-66
34. Tian M, Xiaoyi W, Xiaotao L, Guosheng R. Proteasomes reactivator REG gamma enchances oncogenicity of MDA-MB-231 cell line via promoting cell proliferation and inhibiting apoptosis. Cell Mol Biol (Noisy-le-grand). 2009;55(Suppl):OL1121-31
Author contact
![]() Corresponding author: Prof. Liming Zhang and Prof. Dong Li, Department of Medical Cosmetology, The Second Affiliated Hospital of Guangxi Medical University, NO.166 Daxue East Road, Nanning 530000, Guangxi Zhuang Autonomous Region, People's Republic of China. Tel: (+86) 0771-5822917; Prof. Liming Zhang: E-mail: zhangliming1967com; Prof. Dong Li: E-mail: ld_gxykdxcom
Corresponding author: Prof. Liming Zhang and Prof. Dong Li, Department of Medical Cosmetology, The Second Affiliated Hospital of Guangxi Medical University, NO.166 Daxue East Road, Nanning 530000, Guangxi Zhuang Autonomous Region, People's Republic of China. Tel: (+86) 0771-5822917; Prof. Liming Zhang: E-mail: zhangliming1967com; Prof. Dong Li: E-mail: ld_gxykdxcom