Impact Factor ISSN: 1837-9664

 Global reach, higher impact
J Cancer 2018; 9(23):4547-4555. doi:10.7150/jca.26780 This issue Cite
Research Paper
Prognosis Analysis of Histone Deacetylases mRNA Expression in Ovarian Cancer Patients
Lulu Zhou, Xiaohui Xu, Hailing Liu, Xiaoli Hu, Wenwen Zhang, Miaomiao Ye, Xueqiong Zhu ![]()
Department of Obstetrics and Gynecology, the Second Affiliated Hospital of Wenzhou Medical University, Wenzhou 325027, China.
Received 2018-4-20; Accepted 2018-9-9; Published 2018-11-11
Abstract
Histone deacetylases modulate the dynamic balance of histone acetylation and deacetylation in cells, which participate in epigenetic regulations. Accumulated evidence has demonstrated that histone deacetylases are associated with angiogenesis, cell proliferation and survival in a variety of human cancers. However, the expression and distinct prognostic value of histone deacetylases in ovarian cancer have not been well elucidated. In the present study, we collected the overall survival (OS), progress free survival (PFS), and histone deacetylases (HDAC1-11) mRNA expression in ovarian cancer from the Kaplan-Meier plotter online database. We investigated the relationship between histone deacetylases mRNA level and the clinicopathological parameters of the ovarian cancer patients, such as histology subtypes, clinical stages, grades and TP53 mutation. Our analysis data showed that over-expression of HDAC1, HDAC2, HDAC4, HDAC5 and HDAC11 were correlated to poor overall survival and unfavorable progress free survival in all ovarian cancer patients. Notably, the higher level of HDAC11 was associated with the worse OS and PFS for serous/ stage III+IV/ grade III/ TP53 mutation ovarian cancer patients. In conclusion, HDACs may play a crucial role in the prognosis of ovarian cancer, but it is worth noting that HDAC11 may be a biomarker for poor prognosis in ovarian cancer patients.
Keywords: ovarian cancer, prognosis, HDACs, Kaplan-Meier plotter
Introduction
Ovarian cancer is a lethal disease that accounts for 5% of cancer deaths in females in the United States and its mortality is second only to breast cancer. In 2017, there were approximately 22,440 new cases and 14,080 deaths from ovarian cancer in the United States[1]. At present, preferred management of ovarian cancer is comprehensive staging operation, cytoreductive surgery, and subsequent adjuvant chemotherapy[2]. With the development of surgery and targeted drugs, the prognosis of patients with ovarian cancer has been improved significantly, but the 5-year survival rate is still fluctuating at 30%[3]. Therefore, identifying favorable prognostic biomarkers for ovarian cancer is urgently needed to develop novel therapeutic strategies and to improve the clinical outcomes of ovarian cancer patients.
Histone deacetylases (HDACs) are a family of enzymes that participate in mediating the dynamic balance of histone acetylation and deacetylation in cells[4]. Up to now, 18 subtypes of HDACs have been found in mammalian cells and classified into four classes according to their similarity to the yeast HDAC sequence. Class I HDACs include HDAC1, HDAC2, HDAC3 and HDAC8, which are close to the yeast Rpd3 protein. Class II HDACs consists of HDAC4, HDAC5, HDAC6, HDAC7, HDAC9 and HDAC10, which are similar to the yeast Hda1 protein. Class III HDACs, also known as sirtuins, contains SIRT 1-7 because of homologous with yeast transcription factor Sir2 sequence. Interestingly, class IV only has HDAC11[5, 6]. Among them, Class I, II and IV are Zn2+-dependent type, but class III is a Nicotinamide adenine dinucleotide (NAD+)-dependent type[7].
In recent years, HDACs are considered to play an essential role in cell proliferation, differentiation and apoptosis of several cancers[8-10]. Mottet et al. found that HDAC4 was involved in inhibition of p21(WAF1/Cip1) by Sp1/Sp3- rather than p53 binding site. HDAC4 interacted with Sp1 to bind and reduced histone H3 acetylation, indicating that Sp1 plays a key role in HDAC4-mediated p21 inhibition (WAF1/Cip1) [8]. A study reported that knockdown of HDAC1 obviously decreased the proliferation of ovarian cancer cells via downregulation of cyclin A expression, and depletion of HDAC3 inhibited the migration of ovarian cancer cell through augmentation of E-cadherin expression[10]. Over-expression of HDACs is observed in a variety of human malignancies and is linked to clinicopathological parameters and prognosis[11-13]. For example, HDAC4 was obviously higher in late stages of epithelial ovarian cancer tissues compared with early stages[14]. Additionally, enhanced expression of HDAC1 was associated with a shorter disease-specific survival in ovarian cancer patients[15]. Up to now, the prognostic significance of each HDACs subtype in ovarian cancer remains unclear. Because the functions of most class III HDACs (SIRT1-7) remain to be elucidated, in the present study, we first entirely investigated the prognostic values of class I, II and IV HDACs members (HDAC1-11) in ovarian cancer patients by Kaplan-Meier plotter database.
Materials and Methods
The Kaplan-Meier plotter database (www.kmplot.com)[16] was used to analyze the correlation between each HDACs mRNA level and prognosis of ovarian cancer patients. In this database, gene expression and clinical data of lung cancer[17], ovarian cancer[18], gastric cancer[19], and breast cancer[20] were included. In addition, the clinical data of ovarian cancer patients contained grades, stages, histology and TP53 mutation status. Currently, it has been widely used to analyze the clinical effect of individual genes on overall survival (OS) and progress free survival (PFS) of cancers.
OS of 1656 patients and PFS of 1435 women with ovarian cancer were assessed in Kaplan-Meier plotter database, and the eleven HDACs genes (HDAC1-11) were loaded into the database. Then, patient samples were divided into two groups by median expression (high vs. low expression) and were investigated by a Kaplan-Meier survival plot. The hazard ratio (HR) with 95% confidence intervals (CI) and Log rank p-value were calculated automatically on the webpage. If HR and 95% CI were more than 1, the gene was considered as a poor prognostic indicator of ovarian cancer. If 95% CI was less than 1, the gene could be a better prognostic indicator. If 95% CI includes 1, the gene was identified that it had no correlation to the prognosis in ovarian cancer. The relationship between HDACs mRNA level and other clinicopathological parameters including histology subtypes, clinical stages, grades and TP53 mutation was accessed. P value of < 0.05 was considered to be statistically significant.
Result
HDACs mRNAs levels are associated with OS and PFS in ovarian cancer patients
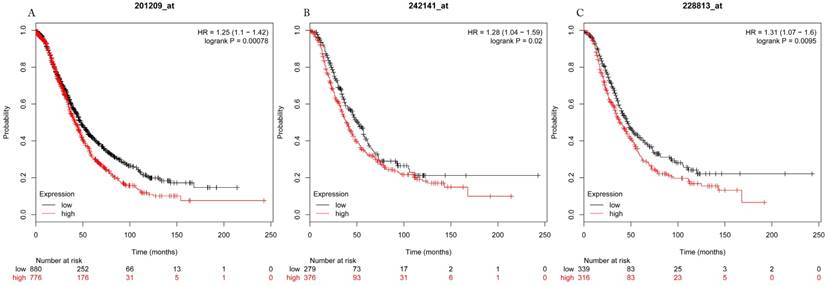
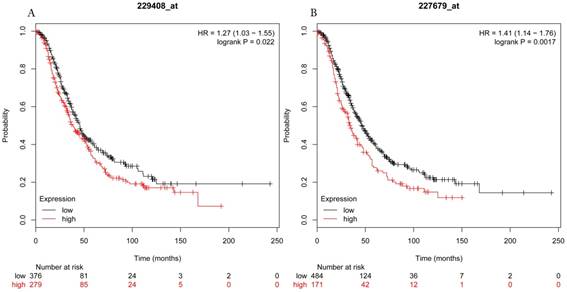
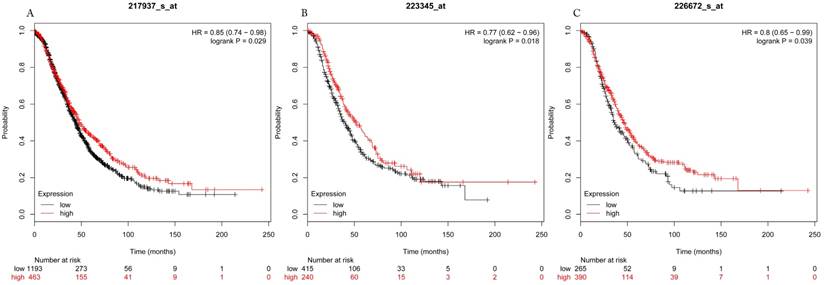
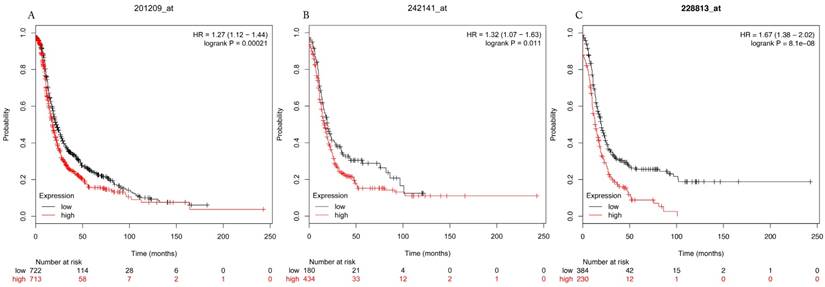
The prognostic values of each HDACs subtype (HDAC1-11) in ovarian cancer patients were examined in www.kmplot.com. respectively. We found that eight HDACs genes were significantly correlated with outcomes for all ovarian cancer patients. Specifically, high expression of HDAC1, HDAC2, HDAC4, HDAC5 and HDAC11 were correlated to poor OS, P<0.05. (Fig.1A, 1B, 1C, 2A and 2B, HR 95% CI =1.25 (1.1-1.42), 1.28 (1.04-1.59), 1.31 (1.07-1.6), 1.27 (1.03-1.55), and 1.41 (1.14-1.76), respectively). On the contrary, over-expression of HDAC7, HDAC8 and HDAC10 showed a favorable OS, P<0.05. (Fig.3A, 3B and 3C, HR 95% CI =0.85 (0.74-0.98), 0.77 (0.62-0.96) and 0.8 (0.65-0.99), respectively). For PFS, high expression of HDAC1, HDAC2, HDAC4, HDAC5, HDAC7, HDAC8, HDAC10 and HDAC11 were associated with an unfavorable outcome, P<0.05. (Fig.4A, 4B, 4C, 5A, 5B, 6A, 6B and 6C, HR 95% CI =1.27 (1.12-1.44), 1.32 (1.07-1.63), 1.67 (1.38-2.02), 1.37 (1.12-1.68), 1.47 (1.21-1.77), 1.21 (1.06-1.37), 1.27 (1.03-1.57), and 1.32 (1.07-1.63), respectively). From the Fig.7 and Fig. 8, increased HDAC3, HDAC6 and HDAC9 mRNA expression had no impact on OS and PFS for ovarian cancer patients. (Fig. 7A, 7B and 7C, HR 95% CI =0.89 (0.77-1.02), 0.89 (0.78-1.01) and 1.1 (0.95-1.27), Fig. 8A, 8B and 8C, HR 95% CI =0.93 (0.82-1.06), 0.93 (0.8-1.07) and 1.1 (0.96-1.26), respectively). Since HDAC1, 2, 4, 5 and 11 had the same OS and PFS prognostic value for ovarian cancer patients, we further studied their prognostic role in different clinicopathological parameters of ovarian cancer patients.
Overall survival curves of HDAC1 (A) (the Affymetrix IDs: 201209_at), HDAC2 (B) (Affymetrix IDs: 242141_at) and HDAC4 (C) (the Affymetrix IDs: 228813_at) are plotted for all patients (n=1656).
Overall survival curves of HDAC5 (A) (Affymetrix IDs: 229408_at) and HDAC11 (B) (Affymetrix IDs: 227679_at) are plotted for all patients (n=1656).
Overall survival curves of HDAC7 (A) (the Affymetrix IDs: 217937_s_at), HDAC8 (B) (Affymetrix IDs: 223345_at) and HDAC10 (C) (the Affymetrix IDs: 226672_s_at) are plotted for all patients (n=1656).
Progress free survival curves of HDAC1 (A) (the Affymetrix IDs: 201209_at), HDAC2 (B) (Affymetrix IDs: 242141_at) and HDAC4 (C) (the Affymetrix IDs: 228813_at) are plotted for all patients (n=1435).
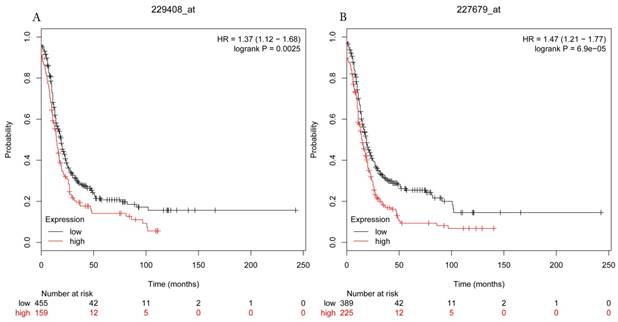
Progress free survival curves of HDAC5 (A) (Affymetrix IDs: 229408_at) and HDAC11 (B) (Affymetrix IDs: 227679_at) are plotted for all patients (n=1435).
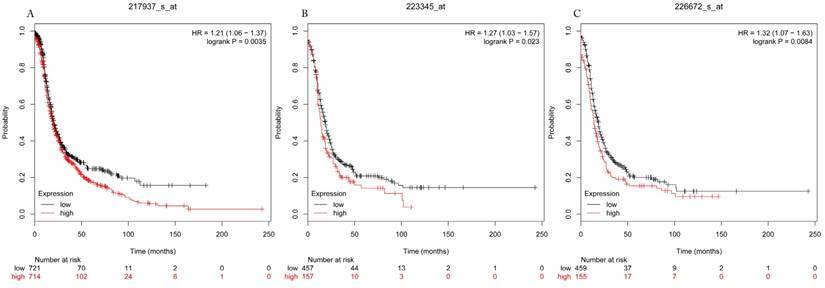
Progress free survival curves of HDAC7 (A) (the Affymetrix IDs: 217937_s_at), HDAC8 (B) (Affymetrix IDs: 223345_at) and HDAC10 (C) (the Affymetrix IDs: 226672_s_at) are plotted for all patients (n=1435).
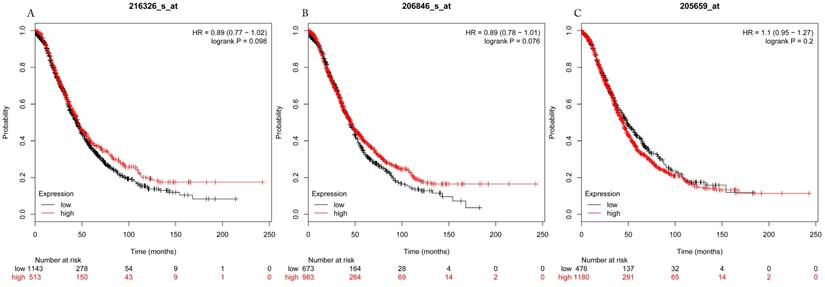
Overall survival curves of HDAC3 (A) (Affymetrix IDs: 216326_s_at), HDAC6 (B) (Affymetrix IDs: 206846_s_at) and HDAC9 (C) (Affymetrix IDs: 205659_at) are plotted for all patients (n=1656).
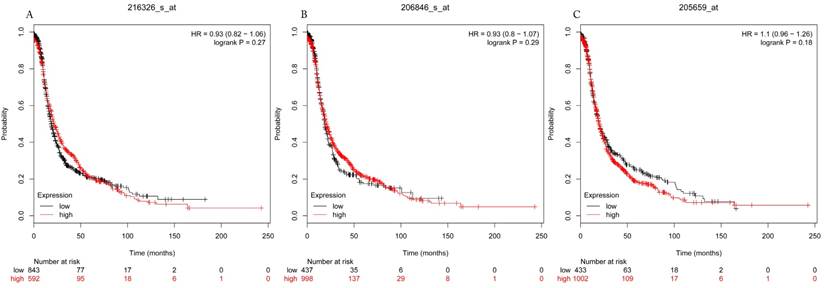
Progress free survival curves of HDAC3 (A) (Affymetrix IDs: 216326_s_at), HDAC6 (B) (Affymetrix IDs: 206846_s_at) and HDAC9 (C) (Affymetrix IDs: 205659_at) are plotted for all patients (n=1435).
OS and PFS values of HDACs in different ovarian cancer subtypes
The clinical characteristics of ovarian cancer patients in Kaplan-Meier plotter were presented in Table 1. Next, the OS and PFS values of HDACs in ovarian cancer with different histological subtypes including serous and endometrioid were examined (Table 2 and Table 3). For serous ovarian cancer patients, high expression of HDAC1, HDAC2, HDAC4, HDAC5 and HDAC11 was correlated with a poor OS (HR 95% CI =1.25 (1.05-1.5), 1.45 (1.16-1.81), 1.4 (1.11-1.75), 1.29 (1.03-1.61) and 1.46 (1.17-1.83), respectively), and high HDAC2, HDAC4, HDAC5 and HDAC11 expression showed an adverse PFS (1.27(1.04-1.56), 1.51(1.23-1.86), 1.37(1.09-1.71) and 1.53(1.24-1.89), respectively), P<0.05. Nevertheless, among all of them, there was no one gene that had effect on OS and PFS for endometrioid ovarian cancer patients.
Clinical characteristics of ovarian cancer patients in Kaplan-Meier plotter
| Variable | Overall Survival (N) | Progress Free Survival (N) |
|---|---|---|
| Histology | ||
| All cancer patients | 1656 | 1435 |
| Serous cancer patients | 1207 | 1104 |
| Endometrioid cancer patients | 37 | 51 |
| Pathological grades | ||
| I | 56 | 37 |
| II | 324 | 256 |
| III | 1015 | 837 |
| Clinical stages | ||
| I+II | 135 | 163 |
| III+IV | 1220 | 1081 |
| TP53 mutation | ||
| Yes | 506 | 483 |
| No | 94 | 84 |
| Death event | 930 | 978 |
| Median survival | 45.23 (m) | 20 (m) |
N, number of ovarian cancer patients with available clinical data; m, months
Correlation of HDAC mRNA expression with overall survival in different histology subtypes of ovarian cancer patients.
| HDAC | Histology | cases | HR (95% CI) | P value |
|---|---|---|---|---|
| HDAC1 | Endometrioid | 37 | 3.91(0.65-23.55) | 0.1085 |
| Serous | 1207 | 1.25(1.05-1.5) | 0.0134* | |
| HDAC2 | Endometrioid | 30 | 2.2(0.31-15.6) | 0.4202 |
| Serous | 523 | 1.45(1.16-1.81) | 0.0011* | |
| HDAC4 | Endometrioid | 30 | 5.24(0.54-50.47) | 0.1091 |
| Serous | 523 | 1.4(1.11-1.75) | 0.0037* | |
| HDAC5 | Endometrioid | 30 | 0.27(0.03-2.59) | 0.2229 |
| Serous | 523 | 1.29(1.03-1.61) | 0.0238* | |
| HDAC11 | Endometrioid | 30 | 0.23(0.03-1.64) | 0.1089 |
| Serous | 523 | 1.46(1.17-1.83) | 0.0008* |
*: P<0.05
Correlation of HDAC mRNA expression with progress free survival in different histology subtypes of ovarian cancer patients.
| HDAC | Histology | cases | HR (95% CI) | P value |
|---|---|---|---|---|
| HDAC1 | Endometrioid | 51 | 0.66(0.25-1.77) | 0.4068 |
| Serous | 1104 | 0.92(0.79-1.07) | 0.2908 | |
| HDAC2 | Endometrioid | 44 | 1.84(0.64-5.32) | 0.2518 |
| Serous | 483 | 1.27(1.04-1.56) | 0.0215* | |
| HDAC4 | Endometrioid | 44 | 2.25(0.78-6.5) | 0.1247 |
| Serous | 483 | 1.51(1.23-1.86) | 9.4e-05* | |
| HDAC5 | Endometrioid | 44 | 0.49(0.16-1.47) | 0.1946 |
| Serous | 483 | 1.37(1.09-1.71) | 0.0063* | |
| HDAC11 | Endometrioid | 44 | 0.55(0.15-1.97) | 0.3496 |
| Serous | 483 | 1.53(1.24-1.89) | 7.1e-5* |
*: P<0.05
Association between the OS and PFS values of HDACs in ovarian cancer and its clinicopathological parameters
The relationship between individual HDACs prognostic values and clinical stages (Table 4 and Table 5), pathological grade (Table 6 and Table 7) and TP53 mutation (Table 8 and Table 9) of ovarian cancer patients was further investigated.
Correlation of HDAC mRNA expression with overall survival in different clinical stage ovarian cancer patients.
| HDAC | Clinical stage | cases | HR (95% CI) | P value |
|---|---|---|---|---|
| HDAC1 | I+II | 135 | 2.71(1.02-7.19) | 0.0376* |
| III+IV | 1220 | 1.34(1.12-1.59) | 0.001* | |
| HDAC2 | I+II | 83 | 0.3(0.11-0.83) | 0.0142* |
| III+IV | 487 | 1.36(1.08-1.7) | 0.0084* | |
| HDAC4 | I+II | 83 | 0.69(0.25-1.92) | 0.479 |
| III+IV | 487 | 1.17(0.93-1.47) | 0.1789 | |
| HDAC5 | I+II | 83 | 0.36(0.13-0.99) | 0.0395* |
| III+IV | 487 | 1.12(0.9-1.41) | 0.3114 | |
| HDAC11 | I+II | 83 | 3.8(0.86-16.83) | 0.059 |
| III+IV | 487 | 1.27(1.01-1.59) | 0.0406* |
*: P<0.05
Correlation of HDAC mRNA expression with progress free survival in different clinical stage ovarian cancer patients.
| HDAC | Clinical stage | cases | HR (95% CI) | P value |
|---|---|---|---|---|
| HDAC1 | I+II | 163 | 2.15(1.22-3.8) | 0.0068* |
| III+IV | 1081 | 0.91(0.78-1.05) | 0.1959 | |
| HDAC2 | I+II | 115 | 0.41(0.16-1.07) | 0.0603 |
| III+IV | 494 | 1.24(1.01-1.51) | 0.0374* | |
| HDAC4 | I+II | 115 | 2.31(0.88-6.06) | 0.0803 |
| III+IV | 494 | 1.45(1.19-1.76) | 0.0002* | |
| HDAC5 | I+II | 115 | 0.43(0.21-0.91) | 0.0233* |
| III+IV | 494 | 1.27(1.03-1.56) | 0.0238* | |
| HDAC11 | I+II | 115 | 2.66(0.93-7.63) | 0.0585 |
| III+IV | 494 | 1.36(1.11-1.66) | 0.0029* |
*: P<0.05
Correlation of HDAC mRNA expression with overall survival in different pathological grade ovarian cancer patients.
| HDAC | Pathological grade | cases | HR (95% CI) | P value |
|---|---|---|---|---|
| HDAC1 | I | 56 | 2.24(0.83-6.1) | 0.1039 |
| II | 324 | 0.9(0.65-1.26) | 0.5537 | |
| III | 1015 | 1.25(1.05-1.48) | 0.011* | |
| HDAC2 | I | 41 | 0.36(0.11-1.15) | 0.0725 |
| II | 162 | 1.87(1.14-3.07) | 0.0122* | |
| III | 392 | 1.49(1.14-1.96) | 0.0038* | |
| HDAC4 | I | 41 | 1.6(0.54-4.7) | 0.3916 |
| II | 162 | 1.52(0.88-2.62) | 0.1324 | |
| III | 392 | 1.39(1.08-1.79) | 0.0092* | |
| HDAC5 | I | 41 | 3.31(0.92-11.92) | 0.0527 |
| II | 162 | 0.65(0.41-1.02) | 0.0571 | |
| III | 392 | 1.49(1.16-1.91) | 0.0017* | |
| HDAC11 | I | 41 | 2.71(0.82-8.96) | 0.0901 |
| II | 162 | 0.78(0.49-1.25) | 0.2961 | |
| III | 392 | 1.48(1.15-1.91) | 0.0019* |
*: P<0.05
Correlation of HDAC mRNA expression with progress free survival in different pathological grade ovarian cancer patients.
| HDAC | Pathological grade | cases | HR (95% CI) | P value |
|---|---|---|---|---|
| HDAC1 | I | 37 | 0.27(0.09-0.83) | 0.014* |
| II | 256 | 1.18(0.88-1.58) | 0.2658 | |
| III | 837 | 1.11(0.93-1.34) | 0.2546 | |
| HDAC2 | I | 28 | 0.33(0.09-1.24) | 0.0858 |
| II | 161 | 1.31(0.86-1.98) | 0.2061 | |
| III | 315 | 1.32(1.02-1.71) | 0.0363* | |
| HDAC4 | I | 28 | 2.44(0.65-9.2) | 0.173 |
| II | 161 | 1.63(1.13-2.36) | 0.0086* | |
| III | 315 | 1.37(1.05-1.77) | 0.0189* | |
| HDAC5 | I | 28 | 0.53(0.14-1.96) | 0.3301 |
| II | 161 | 1.24(0.85-1.8) | 0.2639 | |
| III | 315 | 1.5(1.14-1.98) | 0.0035* | |
| HDAC11 | I | 28 | 2.26(0.6-8.46) | 0.214 |
| II | 161 | 1.25(0.85-1.83) | 0.2572 | |
| III | 315 | 1.46(1.14-1.89) | 0.0032* |
*: P<0.05
Correlation of HDAC mRNA expression with overall survival in different TP53 mutation status ovarian cancer patients.
| HDAC | TP53 mutation | cases | HR (95% CI) | P value |
|---|---|---|---|---|
| HDAC1 | yes | 506 | 0.78(0.61-0.99) | 0.0402* |
| no | 94 | 0.76(0.43-1.35) | 0.3472 | |
| HDAC2 | yes | 124 | 1.66(1.09-2.52) | 0.0172* |
| no | 19 | Not available | Not available | |
| HDAC4 | yes | 124 | 0.76(0.51-1.14) | 0.1866 |
| no | 19 | Not available | Not available | |
| HDAC5 | yes | 124 | 1.21(0.8-1.81) | 0.3664 |
| no | 19 | Not available | Not available | |
| HDAC11 | yes | 124 | 1.71(1.14-2.58) | 0.0095* |
| no | 19 | Not available | Not available |
*: P<0.05
Correlation of HDAC mRNA expression with progress free survival in different TP53 mutation status ovarian cancer patients.
| HDAC | TP53 mutation | cases | HR (95% CI) | P value |
|---|---|---|---|---|
| HDAC1 | yes | 483 | 0.86(0.68-1.08) | 0.1905 |
| no | 84 | 0.65(0.36-1.15) | 0.1316 | |
| HDAC2 | yes | 124 | 1.7(1.14-2.54) | 0.0087* |
| no | 19 | Not available | Not available | |
| HDAC4 | yes | 124 | 1.6(1.09-2.36) | 0.016* |
| no | 19 | Not available | Not available | |
| HDAC5 | yes | 124 | 1.59(1.07-2.37) | 0.0216* |
| no | 19 | Not available | Not available | |
| HDAC11 | yes | 124 | 2.16(1.44-3.26) | 0.0002* |
| no | 19 | Not available | Not available |
*: P<0.05
Table 4 and Table 5 presented the correlation of HDAC mRNA expression with OS and PFS in different clinical stages of ovarian cancer patients respectively. Increased expression of HDAC2 and HDAC5 was correlated with better OS in stage I+II ovarian cancer patients (HR 95% CI=0.3 (0.11-0.83) and 0.36 (0.13-0.99), respectively), meanwhile, just one gene HDAC1 (HR 95% CI=2.71 (1.02-7.19), P=0.0376) was related to poor OS in stage I+II ovarian cancer patients. Moreover, in stage III+IV ovarian cancer patients, we found that HDAC1 (HR 95% CI=1.34 (1.12-1.59), P=0.001), HDAC2 (HR 95% CI=1.36 (1.08-1.7), P=0.0084) and HDAC11 (HR 95% CI=1.27 (1.01-1.59), P=0.0406) mRNA expressions were associated with poor prognosis. For PFS, enhanced HDAC2, HDAC4, HDAC5 and HDAC11 expressions showed an unfavorable PFS (1.24(1.01-1.51), 1.45(1.19-1.76), 1.27(1.03-1.56) and 1.36(1.11-1.66), respectively) for stage III+IV ovarian cancer patients.
With regard to pathological grade, over-expression of HDAC1 (HR 95% CI=1.25 (1.05-1.48), P=0.011), HDAC2 (HR 95% CI=1.49 (1.14-1.96), P=0.0038), HDAC4 (HR 95% CI=1.39 (1.08-1.79), P=0.0092), HDAC5 (HR 95 %CI=1.49 (1.16-1.91), P =0.0017) and HDAC11 (HR 95% CI=1.48 (1.15-1.91), P =0.0019) showed a poor OS in grade III ovarian cancer patients. In addition, in grade II ovarian cancer patients, HDAC2 (HR 95% CI=1.87 (1.14-3.07), P=0.0122) mRNA expression was also correlated to poor OS. About the PFS, HDAC2 (HR 95% CI=1.32 (1.02-1.71)), HDAC4 (HR 95% CI=1.37(1.05-1.77)), HDAC5 (HR 95% CI=1.5(1.14-1.98)) and HDAC11 (HR 95% CI=1.46(1.14-1.89)) mRNA expression were associated with an adverse PFS.
Furthermore, we saw from the Table 8 that the mRNA expression of HDAC2 and HDAC11 (HR 95% CI=1.66 (1.09-2.52) and 1.71 (1.14-2.58), respectively) were correlated to worse OS in mutant-TP53-type ovarian cancer (P<0.05). Among all of them, only HDAC1 (HR 95% CI=0.78 (0.61-0.99), P=0.0402) mRNA expression indicated an improved OS in mutant-TP53-type ovarian cancer patients. However, all of HDAC2, HDAC4, HDAC5 and HDAC11 mRNA expressions had a negative PFS value of mutant-TP53-type ovarian cancer patients.
Discussion
In the current study, we comprehensively investigated the prognostic values of eleven HDACs subtypes mRNA expressions in ovarian cancer patients using the Kaplan-Meier plotter. We found that mRNAs expressions of HDAC3, HDAC6 and HDAC9 were not associated with the OS and PFS in ovarian cancer patients. Additionally, high mRNAs expressions of HDAC7, HDAC8 and HDAC10 were significantly related to a favorable OS but an unfavorable PFS in ovarian cancer patients. But HDAC1, HDAC2, HDAC4, HDAC5 and HDAC11 mRNA expressions are correlated to poor OS and PFS in ovarian cancer patients. Notably, among of them, HDAC11 also showed an adverse OS and PFS in serous/ stage III+IV/ grade III/ TP53 mutation ovarian cancer patients.
HDAC1 mediated transcription of nucleosome structure changes and participated in cell cycle progression and differentiation, but also promoted cancer gene synthesis, inhibited cell apoptosis and impaired differentiation through mitochondrial translocation[21, 22]. Numerous studies have reported that HDAC1 is over-expressed in multiple kinds of cancer tissues such as gastric cancer[23], breast cancer[24], lung cancer[25] and ovarian cancer[10]. For example, Jin et al.[26] found that increased expressions of HDCA1 mRNA was detected in 83% of ovarian cancer tissue samples compared to normal tissue samples. Over-expression of HDAC1 protein was detected in 94% of ovarian cancer samples. Moreover, a lot of studies have investigated the correlation between HDAC1 and different cancer patient outcomes. However, the results remain controversial. Giaginis et al.[13] found that HDAC1 expression was positively correlated to longer survival time and was a favorable prognostic factor in pancreatic adenocarcinoma. Mithraprabhu et al.[12] showed that the multiple myeloma patients with higher expression level of HDAC1 were associated with both shorter progression-free survival and shorter overall survival. Cao et al. carried out the meta-analysis to respectively identify that HDAC1 expression was negatively correlated with the overall survival rate of lung cancer patients[25] and gastric cancer patients[23]. So far, the prognostic values of HDAC1 in ovarian cancer have been still unclear. Weichert et al.[15] reported that enhanced expression of HDAC1 was associated with a shorter disease-specific survival in ovarian endometrioid carcinomas but not in serous, mucinous, and clear cell carcinomas of the ovary. Besides, Yano et al. revealed that overexpression of HDAC1 was detected in the nucleus of ovarian cancer, especially endometrioid ovarian cancer. Moreover, they found that an increased nuclear expression of HDAC1 was showed by comparison between prior to and following chemotherapy. Their data reported that HDAC1 nuclear expression adversely affected overall survival in Serous and endometrioid ovarian cancer[27]. Similarly, Hayashi et al. demonstrated that HDAC1 over-expression had an unfavorable prognosis value in ovarian cancer[10]. Not unexpectedly, our results also observed that increased expression of HDAC1 mRNA was related to poor OS and PFS in ovarian cancer patients. Furthermore, we found that higher expression of HDAC1 was correlated to shorted OS in all of stages, grade III and serous ovarian cancer patients. However, enhanced HDAC1 mRNA expression presented an unfavorable PFS in early stages ovarian cancer patients but a favorable PFS in grade I ovarian cancer patients. Taken together, HDAC1 is a poor OS biomarker for ovarian cancer patients, particularly in poor differentiation and serous ovarian cancer patients.
Most ovarian carcinomas expressed high levels of HDAC2 in the nuclei of tumor cells but not in cytoplasm. HDAC2 protein in serous and mucinous ovarian cancer tissues was significantly higher than those in normal ovarian tissue[26]. Weichert et al. reported that HDAC2 over-expression was associated with cell proliferation as determined by Ki-67 staining, but has no effect on prognosis of ovarian cancer patients[15]. Our results showed that enhanced HDAC2 mRNA expression was linked to unfavorable OS and PFS in ovarian cancer patients, including patients with stages III+IV, TP53-mutanted type, serous and grade III ovarian cancer. But meantime, we also found that increased HDAC2 expression showed better prognosis in stages I+II ovarian cancer patients. Since the number of patients with stages I+II was small, the study need to do in large cases in order to determine the prognostic values of HDAC2 in early stages of ovarian cancer patients.
In many human cancer cells, such as ovarian cancer, pancreatic adenocarcinoma and osteosarcoma, HDAC4 specifically dysregulated cell cycle and led to the development and progression of tumors[13, 14, 28]. In the human glioblastoma model, tumor growth was inhibited in vitro by downregulating expression of HDAC4-mediated p21(WAF1/Cip1)[10]. The accumulation of HDAC4 induced by fibrillar collagen matrices in the nucleus through co-localization of PP1α, resulted in reduction the expression of p21 and promoted the proliferation and migration of epithelial ovarian cancer cells in turn[14]. Besides, HDAC4 expression in epithelial ovarian cancer tissues was obviously higher in late stages of carcinoma than early stages[14]. Ahn et al.[29] found that histone deacetylase inhibitor, apicidin suppressed the growth of transplanted ovarian cancer cells by down-regulating HDAC4 and MMP-2. All these evidences pointed out that HDAC4 was involved in ovarian cancer progression. However, the prognostic role of HDAC4 in ovarian cancer is unknown. According to our results, augmented HDAC4 mRNA expression was correlated to unfavorable outcome in all ovarian cancer patients. Notably, poor PFS was related to late stages, poor differentiation and serous ovarian cancer, while adverse OS was only associated with poor differentiation and serous ovarian cancer.
HDAC5 was reported to lead to the dysregulation of cell proliferation and apoptosis in different cancers[30]. Watamoto et al. put forward that control of the HDAC5 nucleocytoplasmic distribution might be related to murine erythroleukemia cell differentiation possibly via regulation of GATA-1 transactivation[31]. Some data showed that high HDAC5 expression was associated with an poor prognosis for various types of cancer patients including hepatocellular cancer[32], breast cancer[30] and medulloblastoma[33]. Currently, there are no available studies about the prognosis of HDAC5 in ovarian cancer. Our results supported that enhanced HDAC5 expression might indicate worse prognosis of ovarian cancer patients, particularly for poor differentiation and serous patients but better outcome of early stages patients. Besides, HDAC5 mRNA expression was associated with poor PFS for TP53 mutation ovarian cancer patients.
HDAC11, the only member of class IV histone deacetylase, is not only involved in cell division regulation, nervous system development, but also plays an important role in physiological and pathological process of tumor[34-36]. HDAC11 silencing in MYCN-driven neuroblastoma cell lines dramatically induced cell death possibly mediated by apoptotic programs[36]. Wang et al. reported that a negative correlation between the expression of HDAC11 and p53 in pituitary tumors and HDAC11 interfered with p53 expression in pituitary tumor cells to regulated its apoptosis[37]. Feng et al. found that HDAC11 might be involved in breast cancer progression[38]. But Lucio-Eterovic et al. showed that HDAC11 inhibited the development of nervous system tumors[39]. Other study revealed that HDAC11 was expressed at a higher level in Hodgkin Reed-Sternberg cells and had a borderline relationship with the OS in classical Hodgkin lymphoma patients[40]. To date, no data is related to the prognostic role of HDAC11 in gynecological malignancies. Our result first reported that HDAC11 was a poor prognostic biomarker for ovarian cancer patients, particularly in late stages, poor differentiation, TP53 mutation and serous ovarian cancer patients.
Conclusion
In summary, we revealed that HDAC1, HDAC2, HDAC4 and HDAC5 mRNA expression were related to poor OS and unfavorable PFS in all ovarian cancer patients. Importantly, over-expression HDAC11 mRNA was associated with poor OS and PFS not only in all ovarian cancer patients, but also in serous/ stage III+IV/ grade III/ TP53 mutant ovarian cancer patients. Therefore, HDAC11 may be a potential prognostic biomarker for ovarian cancer patients. However, it is worth noting that we only demonstrated the relationship between the prognosis of ovarian cancer and the expression of HDACs mRNA, but not HDACs protein expression. Therefore, the prognosis values of HDACs protein in ovarian cancer need further exploration.
Abbreviations
HDACs: Histone deacetylases; OS: overall survival; PFS: progress free survival; HR: hazard ratio; CI: confidence intervals.
Acknowledgements
This work was sponsored by Key Lab of Wenzhou city-Gynecological Oncology.
Competing Interests
The authors have declared that no competing interest exists.
References
1. Siegel RL, Miller KD, Jemal A. Cancer Statistics, 2017. CA Cancer J Clin. 2017;67(1):7-30
2. Liu J, Matulonis UA. New strategies in ovarian cancer: translating the molecular complexity of ovarian cancer into treatment advances. Clin Cancer Res. 2014;20(20):5150-6
3. Kipps E, Tan DS, Kaye SB. Meeting the challenge of ascites in ovarian cancer: new avenues for therapy and research. Nat Rev Cancer. 2013;13(4):273-82
4. Minucci S, Pelicci PG. Histone deacetylase inhibitors and the promise of epigenetic (and more) treatments for cancer. Nat Rev Cancer. 2006;6(1):38-51
5. Barneda-Zahonero B, Parra M. Histone deacetylases and cancer. Mol Oncol. 2012;6(6):579-89
6. Fan C, Huang Y. Identification of novel potential scaffold for class I HDACs inhibition: An in-silico protocol based on virtual screening, molecular dynamics, mathematical analysis and machine learning. Biochem Biophys Res Commun. 2017;491(3):800-6
7. de Ruijter AJ, van Gennip AH, Caron HN. et al. Histone deacetylases (HDACs): characterization of the classical HDAC family. Biochem J. 2003;370(Pt 3):737-49
8. Mottet D, Pirotte S, Lamour V. et al. HDAC4 represses p21(WAF1/Cip1) expression in human cancer cells through a Sp1-dependent, p53-independent mechanism. Oncogene. 2009;28(2):243-56
9. Segre CV, Chiocca S. Regulating the regulators: the post-translational code of class I HDAC1 and HDAC2. J Biomed Biotechnol. 2011;2011:690848
10. Hayashi A, Horiuchi A, Kikuchi N. et al. Type-specific roles of histone deacetylase (HDAC) overexpression in ovarian carcinoma: HDAC1 enhances cell proliferation and HDAC3 stimulates cell migration with downregulation of E-cadherin. Int J Cancer. 2010;127(6):1332-46
11. Jin Z, Jiang W, Jiao F, Guo Z, Hu H, Wang L. et al. Decreased expression of histone deacetylase 10 predicts poor prognosis of gastric cancer patients. Int J Clin Exp Pathol. 2014;7(9):5872-9
12. Mithraprabhu S, Kalff A, Chow A. et al. Dysregulated Class I histone deacetylases are indicators of poor prognosis in multiple myeloma. Epigenetics. 2014;9(11):1511-20
13. Giaginis C, Damaskos C, Koutsounas I. et al. Histone deacetylase (HDAC)-1, -2, -4 and -6 expression in human pancreatic adenocarcinoma: associations with clinicopathological parameters, tumor proliferative capacity and patients' survival. BMC Gastroenterol. 2015;15:148
14. Shen YF, Wei AM, Kou Q. et al. Histone deacetylase 4 increases progressive epithelial ovarian cancer cells via repression of p21 on fibrillar collagen matrices. Oncol Rep. 2016;35(2):948-54
15. Weichert W, Denkert C, Noske A. et al. Expression of Class I Histone Deacetylases Indicates Poor Prognosis in Endometrioid Subtypes of Ovarian and Endometrial Carcinomas. Neoplasia. 2008;10(9):1021-7
16. Gyorffy B, Lanczky A, Eklund AC. et al. An online survival analysis tool to rapidly assess the effect of 22,277 genes on breast cancer prognosis using microarray data of 1,809 patients. Breast Cancer Res Treat. 2010;123(3):725-31
17. Hou GX, Liu P, Yang J. et al. Mining expression and prognosis of topoisomerase isoforms in non-small-cell lung cancer by using Oncomine and Kaplan-Meier plotter. PloS one. 2017;12(3):e0174515
18. Li S, Sheng B, Zhao M. et al. The prognostic values of signal transducers activators of transcription family in ovarian cancer. Biosci Rep. 2017:37 (4)
19. Cai XP, Chen LD, Song HB. et al. PLK1 promotes epithelial-mesenchymal transition and metastasis of gastric carcinoma cells. Am J Transl Res. 2016;8(10):4172-83
20. Zhang S, Wang Z, Liu W. et al. Distinct prognostic values of S100 mRNA expression in breast cancer. Sci Rep. 2017;7:39786
21. Wang LT, Liou JP, Li YH. et al. A novel class I HDAC inhibitor, MPT0G030, induces cell apoptosis and differentiation in human colorectal cancer cells via HDAC1/PKCdelta and E-cadherin. Oncotarget. 2014;5(14):5651-62
22. Adamik J, Jin S, Sun Q. et al. EZH2 or HDAC1 Inhibition Reverses Multiple Myeloma-Induced Epigenetic Suppression of Osteoblast Differentiation. Mol Cancer Res. 2017;15(4):405-417
23. Cao LL, Yue Z, Liu L. et al. The expression of histone deacetylase HDAC1 correlates with the progression and prognosis of gastrointestinal malignancy. Oncotarget. 2017;8(24):39241-53
24. Tang Z, Ding S, Huang H. et al. HDAC1 triggers the proliferation and migration of breast cancer cells via upregulation of interleukin-8. Biol Chem. 2017
25. Cao LL, Song X, Pei L. et al. Histone deacetylase HDAC1 expression correlates with the progression and prognosis of lung cancer: A meta-analysis. Medicine (Baltimore). 2017;96(31):e7663
26. Jin KL, Pak JH, Park J. et al. Expression profile of histone deacetylases 1, 2 and 3 in ovarian cancer tissues. J Gynecol Oncol. 2008;19(3):185-90
27. Yano M, Yasuda M, Sakaki M. et al. Association of histone deacetylase expression with histology and prognosis of ovarian cancer. Oncol lett. 2018;15(3):3524-31
28. Xiao Q, Huang L, Zhang Z. et al. Overexpression of miR-140 Inhibits Proliferation of Osteosarcoma Cells via Suppression of Histone Deacetylase 4. Oncol Res. 2017;25(2):267-75
29. Ahn MY, Kang DO, Na YJ. et al. Histone deacetylase inhibitor, apicidin, inhibits human ovarian cancer cell migration via class II histone deacetylase 4 silencing. Cancer Lett. 2012;325(2):189-99
30. Li A, Liu Z, Li M. et al. Correction: HDAC5, a potential therapeutic target and prognostic biomarker, promotes proliferation, invasion and migration in human breast cancer. Oncotarget. 2017;8(18):30619-20
31. Watamoto K, Towatari M, Ozawa Y. et al. Altered interaction of HDAC5 with GATA-1 during MEL cell differentiation. Oncogene. 2003;22(57):9176-84
32. Ye M, Fang Z, Gu H. et al. Histone deacetylase 5 promotes the migration and invasion of hepatocellular carcinoma via increasing the transcription of hypoxia-inducible factor-1alpha under hypoxia condition. Tumour Biol. 2017;39(6):1010428317705034
33. Milde T, Oehme I, Korshunov A. et al. HDAC5 and HDAC9 in medulloblastoma: novel markers for risk stratification and role in tumor cell growth. Clin Cancer Res. 2010;16(12):3240-3252
34. Liu H, Hu Q, Kaufman A. et al. Developmental expression of histone deacetylase 11 in the murine brain. J Neurosci Res. 2008;86(3):537-43
35. Sahakian E, Chen J, Powers JJ. et al. Essential role for histone deacetylase 11 (HDAC11) in neutrophil biology. J Leukoc Biol. 2017;102(2):475-86
36. Thole TM, Lodrini M, Fabian J. et al. Neuroblastoma cells depend on HDAC11 for mitotic cell cycle progression and survival. Cell Death Dis. 2017;8(3):e2635
37. Wang W, Fu L, Li S. et al. Histone deacetylase 11 suppresses p53 expression in pituitary tumor cells. Cell Biol Int. 2017;41(12):1290-1295
38. Feng W, Lu Z, Luo RZ. et al. Multiple histone deacetylases repress tumor suppressor gene ARHI in breast cancer. Int J Cancer. 2007;120(8):1664-8
39. Lucio-Eterovic AK, Cortez MA, Valera ET. et al. Differential expression of 12 histone deacetylase (HDAC) genes in astrocytomas and normal brain tissue: class II and IV are hypoexpressed in glioblastomas. BMC cancer. 2008;8:243
40. Huang R, Zhang X, Sophia S. et al. Clinicopathological features and prediction values of HDAC1, HDAC2, HDAC3, and HDAC11 in classical Hodgkin lymphoma. Anticancer Drugs. 2018;29(4):364-370
Author contact
![]() Corresponding author: Xueqiong Zhu MD, PhD. No. 109 Xueyuan Xi Road, Department of Obstetrics and Gynecology, the Second Affiliated Hospitalof Wenzhou Medical University, Wenzhou, Zhejiang, 325027, China. Tel: +86 577 88002796 [office]; +86 13906640759 [mobile]; Fax: +86 577 88002560; E-mail: zjwzzxqcom
Corresponding author: Xueqiong Zhu MD, PhD. No. 109 Xueyuan Xi Road, Department of Obstetrics and Gynecology, the Second Affiliated Hospitalof Wenzhou Medical University, Wenzhou, Zhejiang, 325027, China. Tel: +86 577 88002796 [office]; +86 13906640759 [mobile]; Fax: +86 577 88002560; E-mail: zjwzzxqcom