Impact Factor ISSN: 1837-9664

 Global reach, higher impact
J Cancer 2018; 9(23):4430-4439. doi:10.7150/jca.24361 This issue Cite
Research Paper
TFF3 Contributes to Epithelial-Mesenchymal Transition (EMT) in Papillary Thyroid Carcinoma Cells via the MAPK/ERK Signaling Pathway
Xu Lin1, Huiqin Zhang2, Jin Dai1, Wenjing Zhang1, Jing Zhang1, Gang Xue3, Jingfang Wu1 ![]()
1. Department of Histology and Embryology, Hebei North University, Zhangjiakou, 075000, China ,
2. Department of Ophthalmology, Cangzhou Central Hospital, Cangzhou, 061000, China,
3. Department of Otorhinolaryngology Head and Neck Surgery, Hebei North University, Zhangjiakou, 075000, China
Received 2017-12-14; Accepted 2018-8-24; Published 2018-10-31
Abstract
Abstract: Trefoil factor 3 (TFF3) was found to be overexpressed in many types of tumours. Evidence has shown that TFF3 plays an important role in tumour proliferation, migration and invasion metastasis. However, the impact of TFF3 on patients' clinicopathological characteristics and underlying mechanisms remain unknown in papillary thyroid carcinoma (PTC). In this study, the expression of TFF3 and the epithelial-mesenchymal transition (EMT) transcriptional factor Snail in PTC and para-carcinoma specimens was evaluated by immunohistochemistry (IHC) and Western blot, and the possible associations with lymph node (LN) metastasis and other clinicopathological parameters were analysed. In vitro, the effect of TFF3 on the malignant behaviour of TPC-1 cells was evaluated by cell proliferation assays, cell adhesion assays, colony formation assays, wound-healing assays and transwell chamber invasion assays. EMT markers and regulatory molecules were detected by quantitative RT-PCR (qRT-PCR) and Western blot analysis in the TFF3-knockdown groups and shRNA control group. The results showed that TFF3 was upregulated in PTC tissue and was associated with lymph node metastasis (P=0.0001), pathological grade (P=0.0002) and Snail expression (P=0.0001). The knockdown of TFF3 markedly inhibited the abilities of TPC-1 cell proliferation, adhesion, colony formation, migration and invasion. Mechanically, the results demonstrated that TFF3 might activate the MAPK/ERK signalling pathways, affect the expression of the transcription factors snail and slug in addition to affecting EMT associated markers E-cadherin and N-cadherin, and accelerate the progression of EMT in TPC-1 cells. These findings indicate that TFF3 might promote the metastatic potential of PTC by promoting the EMT process through cascades of MAPK/ERK pathways.
Keywords: trefoil factor 3 (TFF3), epithelial-mesenchymal transition (EMT), papillary thyroid carcinoma, MAPK signalling pathway
Introduction
Thyroid cancer has become the most common endocrine malignancy, and its incidence is increasing worldwide[1]. PTC accounts for 80% of all thyroid cancers. Approximately 15 to 80% of patients with PTC had metastasis to the regional lymph nodes, leading to a higher mortality. Therefore, patients with PTC have approximately a 1 in 2 chance of metastasis to the regional lymph nodes, leading to a higher mortality[2, 3].Thus, it is extremely important to clarify the mechanism of metastatic lymph nodes, proliferation, migration and invasion in PTC, which would give an insight into blocking these steps. Metastasis is what ultimately kills the patients[4]. The epithelial-mesenchymal transition (EMT) has been regarded as a vital step in the process of carcinoma metastasis from the primary site to distant tissues or lymph nodes, by which epithelial cells gradually acquire mesenchymal features and enhance migratory and invasive properties[5, 6]. The molecular characteristics of EMT include switching polarized epithelial phenotype markers (e.g., E-cadherin) to mesenchymal markers (e.g., N-cadherin, fibronectin, etc.)[7].The activation of transcription factors (e.g., Snail, Twist, ZEB1 and ZEB2) triggers EMT. The induction of EMT was a highly regulated cellular programme, which required a balance of multiple signals. One of the signalling pathways regulating EMT is MAPK, some of which has been involved in PTC progression[7].
Trefoil factor 3 (TFF3), which belongs to the trefoil factor family, has been identified to be upregulated in a variety of types of cancer (e.g., breast, gastric and colorectal cancer) and behaves as an oncogene[8-11]. Our group previously demonstrated that with knocking down TFF3, cell viability, migration and invasion potential of TPC-1 cells were inhibited by the downregulation of p-AKT, MMP-9 and BCL-2. However, whether TFF3 is involved in PTC progression remains largely unknown. In this study, we investigated the relationship of TFF3 with lymph node metastasis and EMT-related indexes in clinical specimens and then explored the association of the TFF3 expression level with malignant potential and the EMT phenotype in TPC-1 cells. We further investigated the molecular mechanism of how the knockdown of TFF3 affects the invasive potential and EMT phenotype in TPC-1 cells.
Materials and Methods
Patient information and tissue samples
This study was approved by the Institutional Review Board (IRB) of the First Affiliated Hospital of Hebei North University. The required written informed consent was obtained from all patients. We obtained permission to obtain and use the surgical samples for research purposes. The PTC tissue microarrays were purchased from Shanghai Outdo Biotech CO., LTD. (Shanghai, China).
For Western blot, 20 PTC samples and matched non-tumourous fresh tissues were frozen in liquid nitrogen immediately after surgical removal for primary PTC at the First Affiliated Hospital of Hebei North University from 2014 to 2016.
Immunohistochemistry (IHC) and Immunocytochemistry (ICC)
For IHC, PTC tissue microarrays were deparaffinized with xylene and rehydrated with a gradient of ethanol to distilled water. Then, antigen retrieval was performed by heating the slides in 10 mM sodium citrate buffer for 30 min. After blocking of endogenous peroxidase by 3% H2O2 for 15 min, the microarrays were treated with 10% normal goat serum for 30 min to reduce nonspecific binding and incubated with rabbit anti-Snail (RLT4351, Rui Ying Biological Technology) and mouse anti-ITF (sc-81467, Santa Cruz Biotechnology) at dilutions of 1:100, respectively, at 4°C overnight. After another three washes with PBS, the secondary antibody, biotin-labelled goat anti-mouse (rabbit) IgG, was applied with a 30 min incubation at 37℃. Following further washes with PBS, the slides were incubated with peroxidase-conjugated streptavidin for 30 minutes at 37℃. The microarrays were counterstained with haematoxylin before dehydration and mounting. As a negative control, the antibody was replaced by normal goat serum. The main clinical and pathologic variables are summarized in Table 1.
TFF3 expression and clinicopathological characteristics of 89 specimens
Characteristics | Total | TFF3 expression | P value | χ2 value | Correlation | |
|---|---|---|---|---|---|---|
| Low (Staining score <2) | High (Staining score≥2) | r value | ||||
| Age (years) | 0.938 | 0.006 | ||||
| <45 | 36 | 16 | 20 | |||
| ≥45 | 53 | 24 | 29 | |||
| Gender | 0.865 | 0.029 | ||||
| Female | 57 | 26 | 31 | |||
| Male | 32 | 14 | 18 | |||
| Pathological grade | 0.0002 | 26.326 | 0.73 | |||
| Low (I + II) | 49 | 34 | 15 | |||
| High (III +IV) | 40 | 6 | 34 | |||
| Lymph node metastasis | 0.0001 | 23.909 | 0.719 | |||
| Negative | 58 | 37 | 21 | |||
| Positive | 31 | 3 | 28 | |||
| Snail | 0.0001 | 36.5 | 0.8 | |||
| Low | 32 | 28 | 4 | |||
| High | 57 | 12 | 45 | |||
Statistical analyses were performed by the Pearson χ2 test
For ICC, the indicated cells were grown on coverslips in 6-well plates until they 80% confluence. The cells were then fixed with 4% formaldehyde, the endogenous peroxidase was blocked by 3% H2O2, and the nonspecific binding was reduced with 10% normal goat serum. Next, the coverslips were incubated with primary antibodies at dilutions of 1:100, respectively, at 4°C overnight (mouse anti-ITF, rabbit anti-Snail, rabbit anti-Slug (RLM3371, Rui Ying Biological Technology), rabbit anti-E-cadherin (bs-10009R, Bioss), rabbit anti-N-cadherin (RLT2988, Rui Ying Biological Technology), rabbit anti-ERK (1/2) (bs-2637R, Bioss), rabbit anti-Phospho-ERK (1/2) (bs-1522R, Bioss). The other steps were similar to those in the protocol of IHC.
The intensity of the immunohistochemical reactions was assessed using the semi-quantitative immunoreactive score (IRS) scale of Remmele and Stegner[12]. Tumour cell proportion was scored as follows: 0 (0-5% positive cells); 1 (6-25% positive cells); 2 (26-50% positive cells); 3 (51-75% positive cells); and 4 (76-100% positive cells). Staining intensity was scored as follows: 0 (no staining); 1 (weak staining); 2 (moderate staining); and ≥3 (strong staining). Scoring of both parameters was calculated after counting at least 5 fields at 400×magnification. The points scored for the percentage of positive cells and the staining intensity were added.
Cell line and Cell culture
TPC-1, normal thyroid follicular epithelial cells Nthy-ori 3-1 and human embryonic kidney 293T were purchased from the BeNa Culture Collection (BNCC, Beijing, China). The cells were cultured in RPMI 1640, F12K and Dulbecco's modified Eagle's medium (DMEM) with 10% foetal bovine serum (FBS) (Gibco, Grand Island, NY, USA) and antibiotics (100 U/ml penicillin and 100 μg/ml streptomycin). The cells were cultured in a humidified atmosphere containing 5% CO2 at 37˚C. All culture reagents were purchased from Life Technologies.
Generation of target-specific knockdown cells
TFF3 small hairpin RNA (shTFF3), targeting sites 258 and 537 of human TFF3 (NM_003226), was designed to knockdown TFF3 expression and scramble shRNA, which showed no homology as a control (shCon). The target sequences were as follows: shTFF3KD#1: 5'- CCTGGCCTTGCTGTCCTCC -3'; shTFF3KD#2: 5'- GGCACTGTTCATCTCAGCT -3'; shCon: 5'- AATACGGCGATGTGTCAGG -3' (Biowit Technologies, China). Retrovirus particles were produced in 293T cells by transient transfection plasmids harbouring shTFF3KD#1, shTFF3KD#2 and shCon. Then, the titre was measured and infection of target cell line obtain stable cell line of shTFF3KD#1, shTFF3KD#2 and shCon TPC-1 using puromycin; selection was performed according to our previous works[13]. Silencing efficiency of TFF3 was confirmed by qRT-PCR and Western blot. Three groups were generated for experiments as follows: two shRNA-TFF3 groups (TFF3KD#1 & TFF3KD#2) and an shRNA control group (shCon).
Western blotting
PTC and para-carcinoma tissues were homogenized in liquid nitrogen and then treated with cell lysis (Invitrogen, Burlington, ON, Canada) buffer for 30 min. Protein concentrations were detected by a Bicinchoninic Acid (BCA) assay kit (Thermo Scientific®, Rockford, IL). Proteins were boiled with 5 × SDS loading buffer and subjected to 10% SDS-PAGE and then transferred to PVDF membranes (Roche Diagnostics, Mannheim, Germany). After being blocked in Tris-buffered saline (TBS) containing 0.1% Tween-20, the membranes were incubated with primary antibodies (mouse anti-ITF, 1:300; rabbit anti-Snail, 1:300; rabbit anti-Slug, 1:200; rabbit anti-E-cadherin, 1:100; rabbit anti-N-cadherin, 1:100; rabbit anti-ERK (1/2), 1:150; and rabbit anti-Phospho-ERK (1/2), 1:150) at 4°C overnight and then with HRP-conjugated secondary antibodies for 1 h at room temperature. Protein bands were visualized by the enhanced chemiluminescence (ECL) method.
RNA extraction and quantitative RT-PCR (qRT-PCR)
Total RNA from cells was extracted using TRIzol (Invitrogen) according to the manufacturer's instructions, and the cDNA was prepared using a FastQuan RT Kit (TIANGEN BIOTECH., Beijing, China). qRT-PCR was carried out on an ABI 7300 Real-Time PCR System (Applied Biosystems Life Technologies, Grand Island, NY, USA) using PowerUpTM SYBR Green Master Mix (Thermo Scientific) following the manufacturer's instruction. The quantified data were normalized to β-actin, and the relative quantity was calculated using the 2-ΔΔCT method. The results were analysed with GraphPad Prism 5 software. The primer sequences used for PCR are given in Table 2.
PCR primers
| Gene symbol | Primer sequence | Product size(bp) |
|---|---|---|
| TFF3 | F:5′-AATGCACCTTCTGAGGCACCT-3′ | 171 |
| R:5′-CGTTAAGACATCAGGCTCCAGAT-3′ | ||
| β-actin | F:5'-CACTCTTCCAGCCTTCCTTCC-3' | 190 |
| R:5'-AGGTCTTTGCGGATGTCCAC-3' | ||
| E-cadherin | F:5'-GAAGCACAGAATCCCCAAGTG-3' | 156 |
| R:5'-GGCGTGTTTGTCTTCCATTTC-3′ | ||
| N-cadherin | F:5'-TGCGGTACAGTGTAACTGGG-3' | 123 |
| R:5'-GAAACCGGGCTATCTGCTCG-3′ | ||
| Snail | F:5'-GAGGCGGTGGCAGACTAG-3′ | 178 |
| R:5'-GACACATCGGTCAGACCAG-3′ | ||
| Slug | F:5'-AACAGAGCATTTGCAGACAGGTC-3′ | 146 |
| R:5'-GCTACACAGCAGCCAGATTCC-3′ |
F,forward primer; R,reverse primer; bp,base pair.
Cell proliferation assay
Cell proliferation was measured by the IncuCyte ZOOM™ (Essen Instruments, Ann Arbor, MI). Briefly, 5000 cells/well were seeded and cultured in 96-well plates. Then, the program was set according to the instructions. Once the fresh medium was added, the plate was placed into the IncuCyte ZOOM™ apparatus, and images of the collective cell spreading were recorded every 2 hours for a total duration of 6 days. The medium was refreshed every 3 days. Then, the images were analysed automatically by the apparatus according to the instructions.
Cell cycle analysis
For flow cytometry, the TFF3KD#1, TFF3KD#2 and shCon TPC-1 cells were fixed with 70% ethanol for 12 h at 4℃ and labelled with propidium iodide (PI) stain solution (PI; Sigma) according to the manufacturer's protocol. Cells were run on a NovoCyte Flow Cytometer (ACEA Biosciences Inc., USA). The fractions of the cells in the G1, S and G2 phases were analysed using Flow Jo software (NovoExpress 1.0.2).
Colony formation assay
Cells were seeded at a density of 500 cells/well in triplicate in 6-well culture plates. The medium was refreshed every 3 days. After 5 days of culture, the resulting colonies (≥50 cells per colony) were fixed with methanol and stained with 0.5% crystal violet. Colonies containing more than 100 cells were counted.
Invasion assay
Invasion assays were performed in transwell chambers (8.0 μm pore size; Millipore, MA). After serum-starvation for 24 hours, 2×10⁴ cells were plated into the upper chambers (Corning Costar Corp., Cambridge, MA, USA) of transwell plates with a Matrigel coating (BD Biosciences, Bedford, MA, USA). Each of the lower chambers was filled with 500 μl 1640 RPMI supplemented with 10% foetal bovine serum. After incubation at 37°C for 24 h, the cells that moved to the reverse sides of the inserts were fixed in 100% methanol for 10 min and stained with 0.1% crystal violet (Sigma-Aldrich). Crystals were dissolved in DMSO, and the OD value at 570 nm was detected using a microplate reader.
Cell adhesion assay
Ninety-six-well plates were pre-coated with fibronectin (Sigma-Aldrich; Louis, MO, USA) and blocked with 1% bovine serum albumin (BSA; Sigma-Aldrich) at 37°C for 2 hours. A total of 1× 10⁴ cells in serum-free medium were seeded into the 96-well plates. Following incubation for 2 hours, nonadherent cells were removed by gentle washing, and the adhesive cells were fixed in 4% paraformaldehyde and then stained with 0.5% crystal violet. DMSO was used to dissolve the crystals. The absorbance at 570 nm was measured using a microplate reader.
Wound-healing assay
Cells were seeded at a density of 5×10⁵ in 6-well plates and grown to 95% confluence overnight. After the cells were serum-starved for 24 hours, a wound was created by scraping confluence cells with a 10-μl pipette tip. Images were photographed at 0 hours, 8 hours and 16 hours after scratching. The average distance of the wound was calculated by using Image-Pro plus 6.0 software. The migration rate was calculated by the following formula: (width0 hours - width 8 or 16 hours)/width 0 hours×100%.
Statistical analysis
All statistical analyses were performed using SPSS statistical package 17.0 (SPSS Inc., Chicago, IL, USA). All data were representative of three independent experiments and were expressed as the mean ± standard deviation (SD). The χ2 test and Fisher's exact probability test were used to evaluate correlations between the immunohistochemical and clinical features of the tissue microarray. All reported P values were two-tailed, and P <0.05 was established as the level of significance.
Results
TFF3 and Snail expression in papillary thyroid carcinoma and its clinical significance
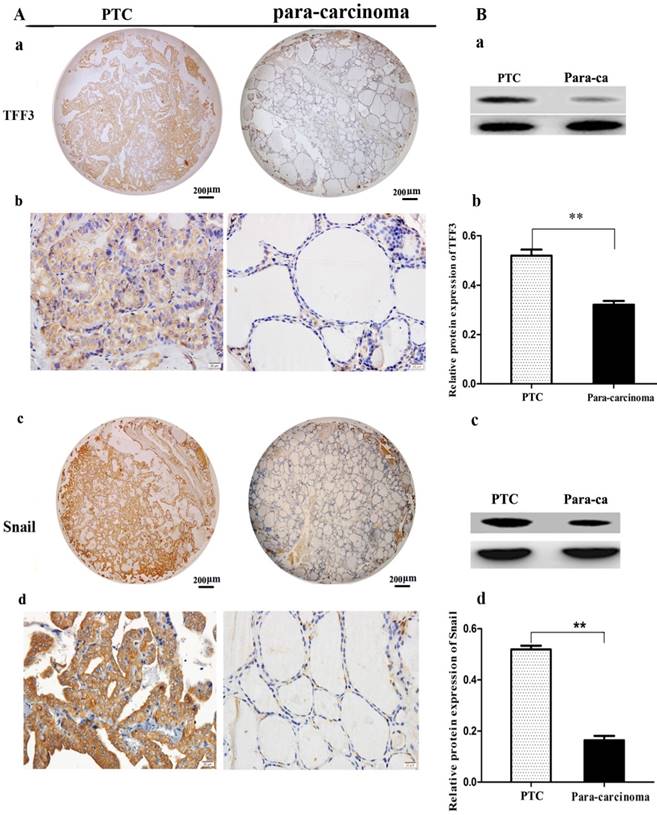
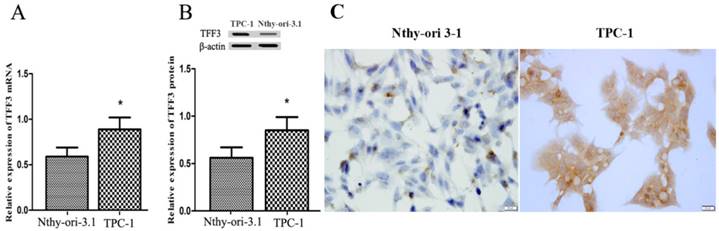
TFF3 and Snail expression levels were evaluated by IHC and Western blot. As shown in Figure 1A, TFF3 was significantly increased in PTC tissues as compared to para-carcinoma subjects (Staining score: PTC = 2.127 ± 0.2114; para-carcinoma = 0.927 ± 0.1126). Moreover, we further evaluated TFF3 expression by Western blotting. As expected, we found that the expression of TFF3 protein was markedly upregulated in PTC tissues as compared to para-carcinoma thyroid tissues (Figure 1B). Correlation analysis suggested there was a significant correlation between the TFF3 expression level and lymph node metastasis (P= 0.0001) and pathological grade (P=0.0002) (Table 1). In addition, the expression of TFF3 were markedly upregulated in PTC compared with para-carcinoma tissues (P=0.0003), and a positive correlation between the expression of TFF3 and the EMT marker Snail was found (r=0.8, P=0.0001) (Figure 1B, Table 1). A similar expression pattern also existed in cell lines of normal thyroid cells and the PTC cell line, and TFF3 mRNA and protein levels were lower in Nthy-ori 3-1 cells than in TPC-1 by qRT-PCR, Western blot and ICC stain (Figure 2 A, B, C). These results suggested that upregulated TFF3 might be important for PTC tumourigenesis and cancer progression.
The expression of TFF3 and Snail in carcinoma (PTC) and para-carcinoma (para-ca) by IHC and Western blot. A) a, c Representative IHC images of TFF3 and Snail are shown in tissue microarrays of PTC and para-ca. bar=200 μm. b, d TFF3 and Snail show higher expression in PTC than para-ca under high magnification, bar=20 μm. B) a, c Image of TFF3 and Snail protein bands in PTC and para-ca tissues using Gel-Pro Analyzer version 4.0 software. b, d Relative protein levels of TFF3 and Snail in PTC and para-ca specimens, as measured by Image-Pro Plus 6.0. Experiments were performed in triplicate. Error bars represent the S.D., and significance determined by two-tailed t-test (**P < 0.01 vs. para-carcinoma).
Expression of TFF3 in thyroid follicular epithelial Nthy-ori 3-1 cells and TPC-1 cells. (A) Relative expression of TFF3 mRNA by qRT-PCR. TFF3 mRNA levels were lower than in TPC-1 cells (B) Relative expression of TFF3 protein by Western blot. Quantitative analysis of Western blot is shown in the lower panel. (C) The ICC results showed a higher level of TFF3 expression in TPC-1 cells than in Nthy-ori 3-1 cells, bar=20 μm
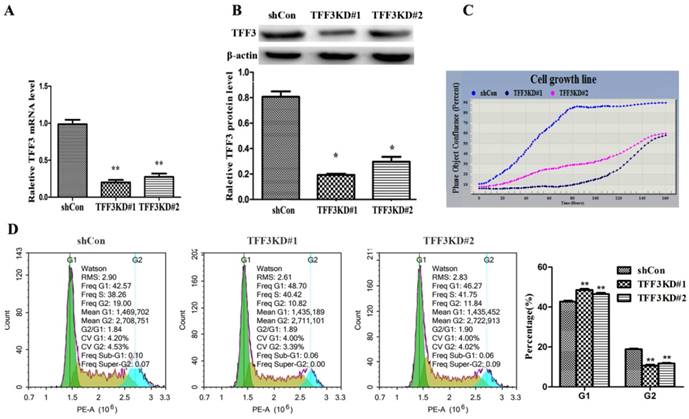
Silencing TFF3 inhibits TPC-1 cell proliferation and G1 phase arrest
These data showed that overexpression of TFF3 was correlated with the pathological grade and lymph node metastasis, which provided insight into the TFF3 functional role on PTC cell lines (TPC-1 cells). As shown in Figure 3A, 3B, two series of shRNA targeting TFF3 efficiently reduced the expression of TFF3 in TFF3KD#1 and TFF3KD#2 TPC-1 cells compared with shCon by qRT-PCR and Western blot (P<0.05 or P<0.01). Furthermore, the IncuCyte ZOOM™ proliferation data indicated that cell proliferation was significantly inhibited in the TFF3KD#1 and TFF3KD#2 groups compared with the shCon group (P<0.05) (Figure 3C). Subsequently, we examined the effect of TFF3 on cell cycle. As shown in Figure 3D, the percentage of TPC-1 cells in the G1 phase in the TFF3-knockdown group was significantly higher than in the shCon group (42.70 ± 0.892% vs. 48.55 ± 0.874% & 46.49 ± 1.08%, respectively; P <0.001), and the opposite results were obtained in the G2 phase (18.80 ± 0.59% vs. 10.62 ± 0.83% & 11.71 ± 0.67%, respectively; P < 0.001).
Silencing of TFF3 inhibits TPC-1 cell proliferation and arrests G1 phase. TFF3 expression was successfully knocked down in TFF3KD#1 and TFF3KD#2 detected by qRT-PCR (A) and Western blot (B). **P<0.01 vs. shCon. (C) Knockdown of TFF3 inhibited cell proliferation in the TFF3KD#1 and TFF3KD#2 groups compared with the shCon group measured by the IncuCyte ZOOM™. (D) Cell cycle was assessed by a flow cytometer. The distribution of cell cycle in TFF3KD#1 and TFF3KD#2 changed and the proportion of cells in G1 phase increased, whereas the proportion in G2 decreased. The results are shown as the mean ± SD. **P<0.01 represents a significant difference from the shCon group.
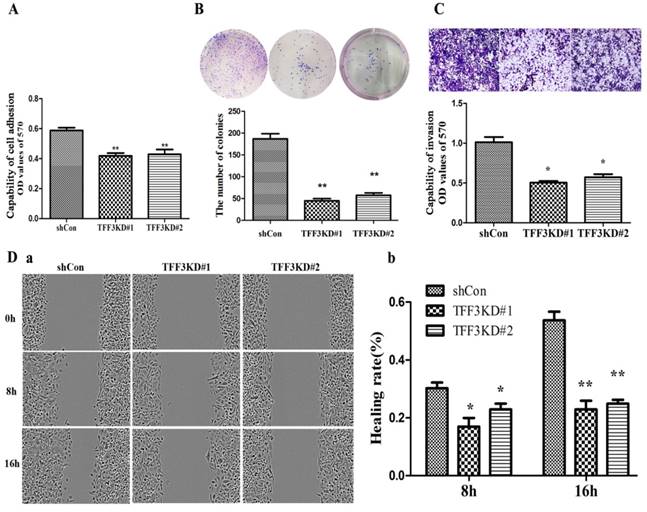
Silencing TFF3 suppresses cell adhesion, migration and invasion
As shown in Figure 4A & 4B, TFF3 knockdown inhibited TPC-1 adhesion and colony formation compared with the shCon group. The adhesion capability was reduced by nearly 30% in the TFF3KD#1 and TFF3KD#2 groups compared with the shCon group (P<0.05). The colony results showed that the TFF3KD#1 and TFF3KD#2 cells formed three times fewer colonies than the shCon cells (P<0.01).The wound-healing assay results revealed TFF3KD#1 and TFF3KD#2 significantly reduced the velocity of TPC-1 cell migration at 8 h and 16 h after the wounds were created (Figure 4 Da, b). In the invasion assays, the cells transfected with shTFF3KD#1 & shTFF3KD#2 showed weakened invasive ability. The invasiveness was reduced by 50% in TFF3KD#1 and TFF3KD#2 compared with shCon (Figure 4C, P< 0.05). These results revealed that TFF3 contributes to the adhesion, colony formation, migration and invasion abilities of TPC-1 cells.
Depletion of TFF3 inhibits adhesion, colony formation, migration and invasion in TPC-1 cells. (A) Knockdown of TFF3 represses cell adhesion in the TFF3#1 and TFF3#2 groups compared with the shCon group. (B) Colony formation analysis of TPC-1 cells. Significantly fewer colonies were observed in the TFF3 knockdown groups compared with control cells. (C) Transwell invasion assays revealed that stably suppressed TFF3 expression inhibited invasiveness of TPC-1 cells in vitro. (D) Wound healing assay showed that the migration ability significantly decreased at 8 h and 16 h after wounding. The bar chart shows the relative migration ability at 0, 8 h, and 16 h, respectively. The results are shown as the mean ± SD. *P<0.05, **P<0.01 represents a significant difference from the shCon group.
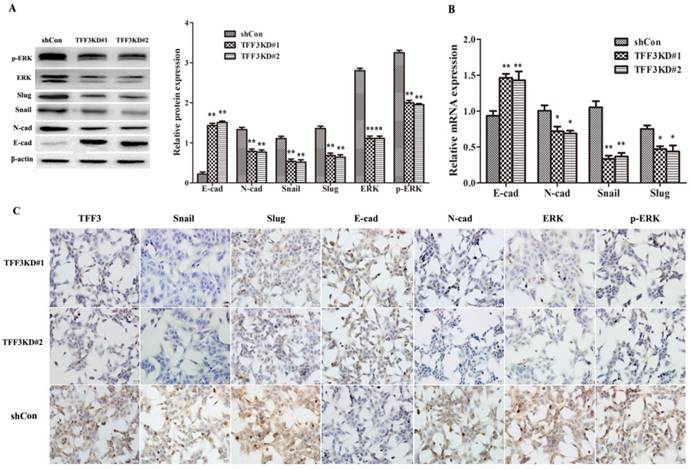
Knockdown of TFF3 Inhibits the EMT process Via the MAPK/ERK Pathway
As shown in Figure 5A, B, the protein and mRNA levels of E-cadherin were significantly upregulated, whereas N-cadherin, Snail and Slug levels were downregulated in both TFF3 knockdown groups compared with the shCon group by Western blot, qRT-PCR and ICC (Figure 5A-C, P< 0.01). One of the critical pathways in tumour initiation, progression, and metastasis is the MAPK/ERK pathway. As shown in Figure 5A, knockdown of TFF3 significantly suppressed the protein levels of ERK and p-ERK in shTFF3KD#1 and shTFF3KD#2 TPC-1 cells compared with the shCon cells by Western blot. The results remained the same on ICC in the three groups when silencing the expression of TFF3; the expression levels of Snail, Slug, N-cadherin, ERK (1/2) and p-ERK (1/2) were decreased and E-cadherin was increased (Figure 5C). Therefore, we demonstrated the effects of TFF3 knockdown, which inhibited TPC-1 invasive potential and might decrease EMT through MAPK/ERK signalling.
Knockdown of TFF3 inhibits EMT progress via the MAPK/ERK signalling pathway in TPC-1 cells. (A) Protein expression levels of Snail, Slug, E-cadherin, N-cadherin, ERK and p-ERK were analysed using Western blot. (B) The mRNA expression of the EMT-associated factors Snail, Slug, E-cadherin and N-cadherin were analysed using qRT-PCR. (C) ICC analysis of TPC-1 cells. TFF3, Snail, Slug, N-cadherin, ERK and p-ERK positive staining were observed in the cytoplasm and membrane in TPC-1 and were suppressed in the TFF3KD#1 and TFF3KD#2 groups. E-cadherin was located in the membrane and cytoplasm and expressed more clearly in the TFF3KD#1 and TFF3KD#2 groups. All quantitative data are shown as the means±SD of a minimum of three independent experiments. *P<0.05, ** P<0.01 versus the shCon group, bar=20 μm
Discussion
Multifocal lesions of PTC can provide compelling evidence of lymph node metastasis[14, 15]. LN metastasis of PTC leads to a poor prognosis and fatal outcomes. Therefore, it is very important to investigate the molecular characteristics underlying the progression of PTC.
Recent studies have shown that TFF3, a novel prognostic marker and a therapeutic target, is overexpressed in various tumours and that TFF3 expression is linked to tumour proliferation, migration and invasion [8, 16]. Babyatsky et al demonstrated that TFF3 is highly expressed in colon carcinomas and that silencing of TFF3 expression can effectively inhibit the invasive potential of colon cancer cells[17]. Similarly, upregulation of TFF3 contributed to the malignant progression of cervical cancer cells[18]. You et al confirmed that TFF3 was associated with tumour size, advanced tumour stage and proliferation index [19]. In addition, TFF3 expression has been found to be closely related to a higher tumour grade and lymph node metastasis in cancer[20-22]. The results of this study showed that the expression of TFF3 in 89 PTC tissue microarrays was higher than in paraneoplastic microarrays and that the expression of TFF3 was higher in the pathology grade III ~IV than in the grade I ~ II and also higher in the lymph node metastasis group than the group without lymph node metastasis, suggesting that the expression of TFF3 was associated with lymphatic metastasis and a poor prognosis. Furthermore, TFF3 was involved in cancer invasion and metastasis in breast cancer through the downregulation of E-cadherin mediated by STAT3[22]. It is well known that EMT is characterized by switching E-cadherin to N-cadherin and Snail, which plays a vital role in the process of EMT. However, the mechanism of TFF3 on the process of TPC-1 cell EMT was poorly elucidated. In this study, we found that TFF3 and Snail were overexpressed in PTC tissues in contrast to adjacent non-cancer tissues; we also found that the expression of Snail and EMT-related transcription factors had a strong positive correlation with the expression of TFF3. Our in vitro study also showed that decreased expression of TFF3 attenuated the malignant capability of TPC-1 cells, such as the proliferative, adhesive, migratory and invasive capabilities.
It has been reported that TFF3 is involved in metastasis to lymph nodes in breast cancer[23]. In this study, we found that TFF3 knockdown inhibited proliferation by arresting G1 phase, adhesion, colony formation, migration and invasion. However, the particular molecular mechanisms of how malignant progression in TPC-1 cells is suppressed by knockdown of TFF3 remains largely unknown. EMT leads to a loss of cell-cell adhesion, cell polarity, and acquiring migratory and invasive properties[7]. It is clear that EMT is involved in physiological and pathological activities[24]. Therefore, to clarify the mechanisms involved in TFF3-induced cell migration and invasion, the effects of TFF3 on EMT-related proteins and mRNA were examined. Herein, Western blot and qRT-PCR analysis showed that silencing TFF3 expression restored the expression of an epithelial cell marker (E-cadherin), decreased the expression of EMT transcription factor Snail and Slug and suppressed the expression of a mesenchymal cell marker (N-cadherin) in TPC-1 cells. Batlle E et al reported that TFF3 could repress E-cadherin transcription by binding to the promoter of CDH1[25, 26]. Forced expression of TFF3 could decrease the expression of CDH1 and increase the expression of mesenchymal markers. We deduced the knockdown of TFF3 in TPC-1 cells would get a result similar to the result of Batlle E in which binding to the promoter of CDH1 increases the E-cadherin level and decreases EMT markers.
To gain a better understanding of the function of TFF3 on TPC-1 cells, we tested the effect of TFF3 on aberrant signalling of the MAPK/ERK pathway by Western blot. This pathway has been widely demonstrated to play a pivotal role in tumour progression and metastasis, which could be regarded as a clinically therapeutic target for thyroid cancer[27, 28]. Moreover, activation of MAPK/ERK is reported to increase the levels of Snail, Slug, and N-cadherin and to decrease the levels of E-cadherin expression, thereby leading to EMT[29-31].Therefore, we tested the MAPK/ERK pathway proteins to reveal the possible molecular mechanisms of TFF3 in TPC-1 cells. These data showed that TFF3 knockdown remarkably inhibited the level of ERK (1/2) and p-ERK (1/2) in TPC-1 cells, suggesting that the MAPK/ERK pathway might be responsible for the shTFF3-mediated inhibition of TPC-1 cell proliferation, adhesion, colony formation, migration and invasion, which is consistent with the previous reports that TFF3 contributes to the proliferative and metastatic ability of tumour in vitro by activating this pathway[32-35].
This is, to the best of our knowledge, the first report to show that TFF3 promotes lymphatic metastasis in patients with PTC. Furthermore, in vitro, TPC-1 cell proliferation and invasion were inhibited, and the EMT level was decreased with knockdown of TFF3 via downregulation of the MAPK/ERK signalling pathway. Therefore, the results of our study indicate the potential of TFF3 as a new clinical target for the treatment of PTC.
Acknowledgements
We thank our colleagues in the department of histology and embryology for their excellent work. We thank the helpful comments on the present paper received from our reviewers.
Funding
The research was supported by Major Projects of Hebei North University, China [grant number zd2013015] and Zhangjiakou Science and Technology project [grant number 1611055H].
Author contribution
Jingfang Wu and Gang Xue participated in designing the experiments, Xu Lin, Wenjing Zhang, Jin Dai and Jing Zhang performed most of the experiments. Xu Lin and Huiqin Zhang contributed to writing the manuscript. Xu Lin and Huiqin Zhang contributed as first authors. All authors have read and approved the final submitted manuscript.
Competing Interests
The authors have declared that no competing interest exists.
References
1. Siegel RL, Miller KD, Jemal A. Cancer statistics, 2015. CA Cancer J Clin. 2015;65:5-29
2. Zhang J, Gill A, Atmore B. et al. Upregulation of the signal transducers and activators of transcription 3 (STAT3) pathway in lymphatic metastases of papillary thyroid cancer. Int J Clin Exp Pathol. 2011;4:356-362
3. Sugino K, Kure Y, Iwasaki H. et al. Metastases to the regional lymph nodes, lymph node recurrence, and distant metastases in nonadvanced papillary thyroid carcinoma. Surg Today. 1995;25:324-328
4. Lin JD, Hsueh C, Chao TC. Soft tissue invasion of papillary thyroid carcinoma. Clin Exp Metastasis. 2016;33:601-608
5. Wang Y, Shang Y. Epigenetic control of epithelial-to-mesenchymal transition and cancer metastasis. Exp Cell Res. 2013;319:160-169
6. Yang J, Weinberg RA. Epithelial-mesenchymal transition: at the crossroads of development and tumor metastasis. Dev Cell. 2008;14:818-829
7. Lamouille S, Xu J, Derynck R. Molecular mechanisms of epithelial-mesenchymal transition. Nat Rev Mol Cell Biol. 2014;15:178-196
8. May FE, Westley BR. TFF3 is a valuable predictive biomarker of endocrine response in metastatic breast cancer. Endocr Relat Cancer. 2015;22:465-479
9. Li Y, Sun Z, Liu K. et al. Prognostic significance of the co-expression of nucleophosmin and trefoil factor 3 in postoperative gastric cancer patients. Mol Clin Oncol. 2014;2:1055-1061
10. Morito K, Nakamura J, Kitajima Y. et al. The value of trefoil factor 3 expression in predicting the longterm outcome and early recurrence of colorectal cancer. Int J Oncol. 2015;46:563-568
11. Xiao L, Liu YP, Xiao CX. et al. Serum TFF3 may be a pharamcodynamic marker of responses to chemotherapy in gastrointestinal cancers. BMC Clin Pathol. 2014;14:26
12. Remmele W, Stegner HE. Recommendation for uniform definition of an immunoreactive score (IRS) for immunohistochemical estrogen receptor detection (ER-ICA) in breast cancer tissue. Pathologe. 1987;8:138-140
13. Wu JF, Wang DM, Xue G, Chen YM, Zhang WJ, Zhang J, Li SY. Construction and screening effective sequence of shRNA targeting human trefoil factor 3. Lin Chung Er Bi Yan Hou Tou Jing Wai Ke Za Zhi. 2016;02:130-134
14. Katsuya Y, Yoshida A, Watanabe S. et al. Tumour-to-tumour metastasis from papillary thyroid carcinoma with BRAF mutation to lung adenocarcinoma with EGFR mutation: the utility of mutation-specific antibodies. Histopathology. 2015;67:262-266
15. Lu J, Gao J, Zhang J. et al. Association between BRAF V600E mutation and regional lymph node metastasis in papillary thyroid carcinoma. Int J Clin Exp Pathol. 2015;8:793-799
16. Xiao P, Ling H, Lan G. et al. Trefoil factors: Gastrointestinal-specific proteins associated with gastric cancer. Clin Chim Acta. 2015;450:127-134
17. Babyatsky M, Lin J, Yio X. et al. Trefoil factor-3 expression in human colon cancer liver metastasis. Clin Exp Metastasis. 2009;26:143-151
18. Yuan Z, Chen D, Chen X. et al. Overexpression of trefoil factor 3 (TFF3) contributes to the malignant progression in cervical cancer cells. Cancer Cell Int. 2017;17:7
19. You ML, Chen YJ, Chong QY. et al. Trefoil factor 3 mediation of oncogenicity and chemoresistance in hepatocellular carcinoma is AKT-BCL-2 dependent. Oncotarget. 2017;8:39323-39344
20. Khoury T, Chadha K, Javle M. et al. Expression of intestinal trefoil factor (TFF-3) in hepatocellular carcinoma. Int J Gastrointest Cancer. 2005;35:171-177
21. Okada H, Kimura MT, Tan D. et al. Frequent trefoil factor 3 (TFF3) overexpression and promoter hypomethylation in mouse and human hepatocellular carcinomas. Int J Oncol. 2005;26:369-377
22. Pandey V, Wu ZS, Zhang M. et al. Trefoil factor 3 promotes metastatic seeding and predicts poor survival outcome of patients with mammary carcinoma. Breast Cancer Res. 2014;16:429
23. Ahmed AR, Griffiths AB, Tilby MT. et al. TFF3 is a normal breast epithelial protein and is associated with differentiated phenotype in early breast cancer but predisposes to invasion and metastasis in advanced disease. Am J Pathol. 2012;180:904-916
24. Jung CW, Han KH, Seol H. et al. Expression of cancer stem cell markers and epithelial-mesenchymal transition-related factors in anaplastic thyroid carcinoma. Int J Clin Exp Pathol. 2015;8:560-568
25. Batlle E, Sancho E, Franci C. et al. The transcription factor snail is a repressor of E-cadherin gene expression in epithelial tumour cells. Nat Cell Biol. 2000;2:84-89
26. Cano A, Perez-Moreno MA, Rodrigo I. et al. The transcription factor snail controls epithelial-mesenchymal transitions by repressing E-cadherin expression. Nat Cell Biol. 2000;2:76-83
27. Xing M. Molecular pathogenesis and mechanisms of thyroid cancer. Nat Rev Cancer. 2013;13:184-199
28. Nikiforov YE, Nikiforova MN. Molecular genetics and diagnosis of thyroid cancer. Nat Rev Endocrinol. 2011;7:569-580
29. Li S, Lu J, Chen Y. et al. MCP-1-induced ERK/GSK-3beta/Snail signaling facilitates the epithelial-mesenchymal transition and promotes the migration of MCF-7 human breast carcinoma cells. Cell Mol Immunol. 2017;14:621-630
30. Zhou Q, Chen J, Feng J. et al. SOSTDC1 inhibits follicular thyroid cancer cell proliferation, migration, and EMT via suppressing PI3K/Akt and MAPK/Erk signaling pathways. Mol Cell Biochem. 2017;435:87-95
31. Xu X, Zhao Z, Guo S. et al. Increased semaphorin 3c expression promotes tumor growth and metastasis in pancreatic ductal adenocarcinoma by activating the ERK1/2 signaling pathway. Cancer Lett. 2017;397:12-22
32. Taupin D, Wu DC, Jeon WK. et al. The trefoil gene family are coordinately expressed immediate-early genes: EGF receptor- and MAP kinase-dependent interregulation. J Clin Invest. 1999;103:R31-38
33. Fitsialos G, Chassot AA, Turchi L. et al. Transcriptional signature of epidermal keratinocytes subjected to in vitro scratch wounding reveals selective roles for ERK1/2, p38, and phosphatidylinositol 3-kinase signaling pathways. J Biol Chem. 2007;282:15090-15102
34. Kinoshita K, Taupin DR, Itoh H. et al. Distinct pathways of cell migration and antiapoptotic response to epithelial injury: structure-function analysis of human intestinal trefoil factor. Mol Cell Biol. 2000;20:4680-4690
35. Lin J, Sun Z, Zhang W. et al. Protective effects of intestinal trefoil factor (ITF) on gastric mucosal epithelium through activation of extracellular signal-regulated kinase 1/2 (ERK1/2). Mol Cell Biochem. 2015;404:263-270
Author contact
![]() Corresponding author: Jingfang Wu, Department of histology and embryology, Hebei North University, Zhangjiakou 075000, China. Telephone: +86-313- 4029346; Mobile: 086-18931316376; Fax: +86-313-4029289; Email: wjfxgcom
Corresponding author: Jingfang Wu, Department of histology and embryology, Hebei North University, Zhangjiakou 075000, China. Telephone: +86-313- 4029346; Mobile: 086-18931316376; Fax: +86-313-4029289; Email: wjfxgcom