Impact Factor ISSN: 1837-9664

 Global reach, higher impact
J Cancer 2018; 9(19):3577-3582. doi:10.7150/jca.26356 This issue Cite
Research Paper
Adrenal incidentaloma: machine learning-based quantitative texture analysis of unenhanced CT can effectively differentiate sPHEO from lipid-poor adrenal adenoma
Xiaoping Yi1,2#, Xiao Guan3#, Chen Chen4#, Youming Zhang1, Zhe Zhang1, Minghao Li3, Peihua Liu3, Anze Yu3, Xueying Long1 ![]() , Longfei Liu3
, Longfei Liu3 ![]() , Bihong T Chen5, Chishing Zee6
, Bihong T Chen5, Chishing Zee6
1. Department of Radiology, Xiangya Hospital, Central South University, Changsha, Hunan province, P.R.China;
2. Postdoctoral Research Workstation of Pathology and Pathophysiology, Basic Medical Sciences, Xiangya Hospital, Central South University, P. R, China;
3. Department of Urology, Xiangya Hospital, Central South University, Changsha, Hunan province, P.R.China;
4. Department of Radiology, ZhuZhou 331 Hospital, Changsha Medical University, Changsha, Hunan province, P.R.China;
5. Department of Diagnostic Radiology, City of Hope National Medical Center, Duarte, California, U. S. A;
6. Department of Radiology, Keck Medical Center of USC, Los Angeles, CA.
# Xiaoping Yi, Xiao Guan, and Chen Chen contributed equally to this work.
Received 2018-3-28; Accepted 2018-7-25; Published 2018-9-8
Abstract
Objective: To evaluate the feasibility and accuracy of machine learning based texture analysis of unenhanced CT images in differentiating subclinical pheochromocytoma (sPHEO) from lipid-poor adenoma (LPA) in adrenal incidentaloma (AI).
Methods: Seventy-nine patients with 80 LPA and 29 patients with 30 sPHEO were included in the study. Texture parameters were derived using imaging software (MaZda). Thirty texture features were selected and LPA was performed for the features selected. The number of positive features was used to predict results. Logistic multiple regression analysis was performed on the 30 texture features, and a predictive equation was created based on the coefficients obtained.
Results: LPA yielded a misclassification rate of 19.39% in differentiating sPHEO from LPA. Our predictive model had an accuracy rate of 94.4% (102/108), with a sensitivity of 86.2% (25/29) and a specificity of 97.5% (77/79) for differentiation. When the number of positive features was greater than 8, the accuracy of prediction was 85.2% (92/108), with a sensitivity of 96.6% (28/29) and a specificity of 81% (64/79).
Conclusions: Machine learning-based quantitative texture analysis of unenhanced CT may be a reliable quantitative method in differentiating sPHEO from LPA when AI is present.
Keywords: Texture analysis, adrenal incidentaloma, sPHEO, lipid-poor adrenal adenoma, differentiation.
Introduction
The increased incidence of adrenal incidentaloma (AI) is mostly due to advancements in imaging techniques and increases in the volume of cross-sectional imaging carried out. The term AI refers to an incidentally identified adrenal mass greater than 1 cm in diameter during an imaging examination performed for reasons other than the evaluation of adrenal glands. Histologically, the most common AIs are adrenal adenoma (41%-52%), followed by metastatic diseases (19%), adrenocortical carcinoma (5-10%), myelolipoma (9%) and pheochromocytoma (8%) [1, 2]. When selecting optimal adrenal imaging modalities, computed tomography (CT) is one of the most widely chosen tools [3].
An AI is easily identified if it has certain diagnostic features. A cyst presents as a well-defined homogenous round mass without enhancement, and a myelolipoma has macroscopic fat deposits that are detectable on a CT scan. If an adenoma exhibits low density on a plain CT scan with CT attenuation values lower than 10 Hounsfield units (HU), it can be diagnosed with confidence (sensitivity of 71% and specificity of 98%) and is referred to as a fat-rich adenoma [4]. However, it remains difficult for radiologists and surgeons to differentiate some pheochromocytomas from lipid-poor adenomas (LPAs, those with CT attenuation values over 10 HU) because the imaging features for both conditions largely overlap [5-9]. Pheochromocytomas have a variable appearance on imaging, and some atypical pheochromocytomas that lack typical imaging characteristics can be easily misdiagnosed as adenomas, especially as LPA.
Generally, an incidentally detected pheochromocytoma is asymptomatic and termed “subclinical pheochromocytoma (sPHEO)”. Although a sPHEO is usually clinically silent, it maintains secretory function. Failing to differentiate such pheochromocytomas from other tumors before surgery or biopsy may lead to a life-threatening crisis because these interventions may stimulate the tumor and result in an adrenergic storm [5, 9]. Therefore, identifying the possibility of this disease is of vital importance for avoiding potential catastrophic consequences and guiding further treatments. Thus, the ability to distinguish sPHEO from LPA is a worthwhile goal. However, making this distinction in conventional imaging analysis has been impossible thus far.
Quantitative texture analysis (QTA) refers to the process of converting digital medical images into high-dimensional, mineable data via high-throughput extraction of quantitative descriptors, followed by subsequent data analysis and model building for improved decision-making support [10-12]. The recent results of QTA are promising in oncological practice, including tumor discrimination and subtype classification, as well as treatment response assessments [11, 13-16]. To the best of our knowledge, no previously published study has determined whether QTA can be applied to differentiate sPHEO from LPA in AI. Therefore, we wondered whether QTA could play an important role in making this distinction on unenhanced CT scans. The goal of our study was to determine the feasibility and accuracy of using machine learning-based QTA in differentiating sPHEO from LPA in AI on unenhanced CT images.
Materials and methods
Patients
Ethical approval was obtained from Institutional Review Board of our Hospital, and written informed consents were waived for this retrospective study.
Our study was carried in accordance with relevant guidelines and regulations. Between January 2013 to June 2016, all patients with surgically and pathologically confirmed sPHEO or adrenal adenoma were retrieved from the medical database of our hospital. Inclusion criterion was AI identified during an imaging examination performed for reasons other than the evaluation of adrenal glands. The exclusion criteria were (1) no preoperational CT images available; (2) existing unenhanced CT scan displaying a fat-rich adenoma for patients with adrenal adenoma, (3) adrenal lesion showing enhancement of greater than 100 HU on a CT scan for patients with pheochromocytoma; (4) no enhancement found in the lesion for patients with adrenal adenoma; and (5) CT performed on other machines other than 320-MDCT scanner (Aquilion ONE, Toshiba, Otawara, Japan). According to the inclusion/exclusion criteria (shown in Supplementary files), 80 LPAs (79 patients) and 30 sPHEOs (29 patients) were ultimately enrolled in the present study.
Imaging technique
All patients underwent a uniform CT scanning protocol on a 320-multiple detector computed tomography (MDCT) scanner (Aquilion ONE, Toshiba, Otawara, Japan). After routine nonenhanced CT, arterial and portal venous-phase contrast-enhanced CT scans were performed, with fixed delay times of 28 s and 60 s, respectively, followed by intravenous administration of 90 - 100 ml of iodinated contrast material Ultravist 370 (Bayer Schering Pharma, Berlin, Germany) at a rate of 3.0 - 3.5 ml/s for adults and 1.0 - 1.5 ml/s for children using a power injector (Ulrich CT plus 150, Ulrich Medical, Ulm, Germany). The precontrast and contrast-enhanced CT images were reconstructed with a thickness of 1 mm. The scanning parameters are listed in Supplementary table 1.
Imaging analysis
Images for each patient were reviewed by three abdominal radiologists with 8, 7 and 13 years of experience, who were blinded to patient information, including the pathological diagnosis. The radiologists independently evaluated tumor shape, size, margin and heterogeneity, the presence of calcification and the CT attenuation value of the tumor. The findings were recorded by consensus.
QTA features exaction, selection and texture analysis
Details about QTA features exaction, selection and texture analysis were shown in supplementary files. Briefly, QTA features exaction was performed by using texture analysis software (MaZda Version 4.6, Institute of Electronics, Technical University of Lodz, Poland) [17]. Feature analysis was carried out using the B11 (version 3.3) application of MaZda. CT images processing [18], QTA features exaction, selection and texture analysis [19], as well as intra-observer (reader 1 twice) and interobserver (reader 1 v reader 2) reproducibility evaluations, can be found in the Supplementary files.
Development of an equation for differentiating sPHEO from LPA
Logistic multiple regression analysis was performed using the 30 texture features selected in the above steps. We ultimately identified 4 texture features with good diagnostic accuracy when combined. Regression coefficients obtained for each texture feature were used to create an equation.
Statistical analysis
Statistical analyses were performed using SPSS (version 19, IBM), and a P value < 0.05 was considered significant. Quantitative data with a normal distribution are presented as the means ± SD, and the groups were compared using independent Student's t test. Quantitative data with a non-normal distribution are presented as medians (interquartile ranges), and the groups were compared using a Wilcoxon rank-sum test. Patient sex ratios and lesion location ratios between the two groups were compared using a chi-square test. Receiver operating characteristic (ROC) curves were used to analyze the predictive value of every feature and compare the predictive value of the number of positive features and the equation.
Results
Clinical characteristics
Demographic information and CT scan characteristics of the analyzed tumors are presented in Table 1.
Characteristics of patients with LPA or sPHEO
| Characteristics | LPA | sPHEO | P value |
|---|---|---|---|
| Sex | P=0.141 | ||
| Men | 37 | 9 | |
| Women | 42 | 20 | |
| Age (y) | 48±12 | 42±15 | P=0.047 |
| Lesion size (mm) | 26.5±18.2 | 53.6±22 | P<0.001 |
| Location | |||
| Left | 46 | 8 | P=0.009 |
| Right Both | 32 1 | 20 1 | |
| Unenhanced CT value (HU) | 24.5±9.9 | 37.2±7.4 | P<0.001 |
Age was significantly different between patients with LPAs (48 ± 12 years) and those with sPHEOs (42 ± 15 years) (P = 0.047). SPHEOs were significantly larger than LPAs (5.4 ± 2.2 cm vs 2.7 ± 1.8 cm) (P < 0.001). The mean unenhanced CT attenuation value of sPHEOs was significantly higher than that of LPAs (37.2 ± 7.4 HU and 24.5 ± 9.9 HU respectively, P < 0.001), and there was a significant difference in the location ratio among them (P = 0.002). There was no significant difference between the sex ratios of patients with either type of lesion (P = 0.141).
Feature selection and texture analysis
Satisfactory inter- and intra-observer reproducibility of QTA features extraction was achieved. The interobserver intraclass correlation coefficients (ICCs) between reader 1 (first time) and reader 2 ranged from 0.754 to 0.855. The intra-observer ICC between reader 1's twice feature extraction ranged from 0.792 to 0.893. Therefore, the features extracted by reader 1 were selected for subsequent analysis.
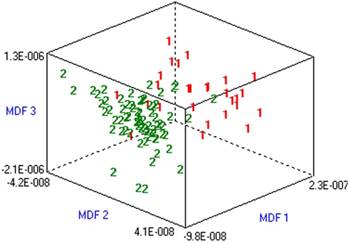
A total of 30 texture features were selected from 377 original parameters produced from all patient scans. This resulted in a misclassification rate of 19.39% for differentiating sPHEOs from LPA on unenhanced CT images using LPA (Figure 1).
Differentiating sPHEO from lipid-poor adenoma based on a dataset including all patients. Misclassification rate was 19.39% from a LPA of unenhanced CT scans. Classification results are represented graphically as the relationship between the most discriminating factors (MDFs). MDF 1, MDF 2 and MDF 3 are the most discriminating feature axes used in the LPA to represent the classification.
Wilcoxon rank sum tests revealed that all 30 texture features were significantly different between sPHEO and LPA (P < 0.05) (Supplementary table 2). ROC curve analyses of the 30 texture features showed that all features had a good accuracy for making a differential diagnosis of sPHEO and LPA with a concordance rate greater than 80%, except for S(5,5)SumAverg, S(0,5)SumAverg and S(5,-5)Correlat (Supplementary table 3).
Geo W6, GeoW13, S(5,5)SumAverg, WavEnHL_s-3 and S(0,5)SumAverg were considered positive if their values were less than their cutoff points. For the remaining features, values greater than the cutoff point were considered positive. We used the number of positive features as a predictor. When the number of positive features exceeded 8, the accuracy of prediction was 85.2% (92/108), with a sensitivity of 96.6% (28/29) and a specificity of 81% (64/79) (Supplementary table 4).
Development of a prediction equation
To screen for the most reliable independent features, we performed a logistic multiple regression analysis of the 30 features. The inclusion criterion was a P < 0.010, and the exclusion criterion was a P>0.05. Finally, GeoFmin, GeoS, 135dr_GLevNonU and GeoEr had a good diagnostic accuracy when combined (Table 2). The regression coefficients obtained for each feature were used for the construction of an equation to calculate a value, denoted P, to assess the nature of a lesion based on the given texture feature values:
Logistic multiple regression analysis results
| Features | Regression coefficient (B) | Standard error | Chi-square value | P value | Exp (B) |
|---|---|---|---|---|---|
| GeoFmin | 0.624 | 0.239 | 6.850 | 0.009 | 1.867 |
| GeoS | -0.636 | 0.205 | 9.668 | 0.002 | 0.529 |
| 135dr_GLevNonU | -0.051 | 0.019 | 6.927 | 0.008 | 0.950 |
| GeoEr | 0.731 | 0.298 | 6.023 | 0.014 | 2.077 |
| Constant | -8.728 | 1.947 | 20.088 | 0.000 | 0.000 |

P values greater than or equal to 0.5 and less than 1 suggest sPHEO, and P values greater than 0 and less than 0.5 indicate LPA.
Next, a back-substitution check was performed. This equation had a predictive accuracy of 94.4% (102/108), with a sensitivity of 86.2% (25/29) and a specificity of 97.5% (77/79) in differentiating sPHEO from LPA (Table 3).
Predictive effect of the equation
| Observed value | Predictive value | Total | |
|---|---|---|---|
| Fat-poor adenoma | Subclinical pheochromocytoma | ||
| Fat-poor adenoma | 77 | 2 | 79 |
| Subclinical pheochromocytoma | 4 | 25 | 29 |
| Total | 81 | 27 | 108 |
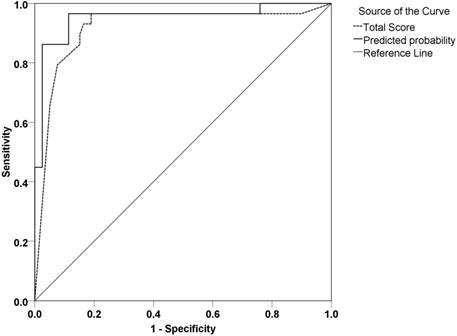
The predictive values of two methods, using the number of positive features or the equation, were compared using ROC curves. The area under the ROC curve for the equation-based method was 0.952 (0.897-1.000), which was slightly greater than that of the method using the number of positive features (0.917, 0.8946-0.988). However, there was no significant difference between these areas (P >0.05) (Figure 2).
ROC curves of the two predictive methods. Total score represents the number of positive features. Predicted probability represents the equation.
Discussion
Although AI is a common clinical entity [1, 2, 20, 21], it remains challenging to classify AIs if the tumors do not have typical imaging features. Among AIs, sPHEOs have been termed imaging “chameleons” due to their various imaging features that may mimic other lesions, such as LPA [6-8, 22, 23]. CT washout protocols are not reliable for differentiating sPHEO from LPA [6-8, 22]. Moreover, recognizing a sPHEO preoperatively is of vital importance because the presence of a sPHEO does not exclude the possibility of a hypertensive crisis [24, 25]. However, the problem of distinguishing sPHEOs from LPAs remains unsolved. In the present study, we introduce a new method termed machine learning-based QTA, which converts images into higher dimensional data and mines these data, to address this problem. As expected, both our equation and the number of positive features derived from our analysis represent the first demonstration of an effective method to differentiate sPHEO from LPA, revealing the clinical significance of this type of analysis.
In our study, the unenhanced CT attenuation values of sPHEOs were significantly greater than those of LPAs. The minimum unenhanced CT attenuation value of a sPHEO is 23 HU; therefore, none of the sPHEOs imaged in our study could be confused for a lipid-rich adenoma. This result is in accordance with the findings of Patel et al and Motta-Ramirez et al [8, 26]
Our results show that the new method can differentiate sPHEO from LPA based on unenhanced CT images. According to our data, the classification accuracy was approximately 80% using LPA. Yan et al divided the classification results into several levels according to the misclassification rates in differentiating angiomyolipoma with minimal fat from renal cell carcinoma: excellent (misclassification rates ≤ 10%), good (10% < misclassification rate ≤ 20%), moderate (20% < misclassification rates ≤ 30%), fair (30% < misclassification rates ≤ 40%), and poor (misclassification rates ≥ 40%) [16]. According to these criteria, our method resulted in good classification rates for sPHEO versus LPA.
Our study provides reliable solutions for differentiating sPHEO from LPA on unenhanced CT scans. Both methods applied in this study yielded good results. When the number of positive features exceeded 8, the accuracy of prediction was 85.2% (92/108), with a sensitivity of 96.6% (28/29) and a specificity of 81% (64/79). The equation had a predictive accuracy rate of 94.4% (102/108), with a sensitivity of 86.2% (25/29) and a specificity of 97.5% (77/79) in differentiating sPHEO from LPA. The score of an adrenal lesion is easily obtained using the equation presented here, which includes the following QTA features: GeoFmin, GeoS, 135dr_GLevNonU and GeoEr. Furthermore, the calculation can be performed with a computer, making it easy for radiologists and surgeons to obtain results that are more accurate than their subjective judgments.
Although contrast-enhanced CT images were also available, we restricted our analysis to unenhanced CT images because we wanted to know if such analysis based on unenhanced CT images only is adequate for making a satisfactory distinction. If this analysis truly works, then it will help prevent unnecessary enhanced CT scans. In addition, the reliability of such analysis is closely related to the source of original data. Data extracted from unenhanced CT scans are much simpler than those extracted from enhanced CT scans as unenhanced CT images depend only on the inherent density of the tumor, while enhanced CT images are affected by many other factors, including differences in contrast materials and injection rate, as wells as the scan delay time. Unenhanced CT is easier to control, and the scans are easier to obtain. Additionally, in our study, we extracted all QTA features from the same CT scanner at our institution to reduce bias and variance. In a study by Ganeshan et al [27], significant textural differences in both nonenhanced and contrast-enhanced lung cancer CT images were identified. However, whether iodine contrast affects CT-based QTA remains unclear. Studies regarding the influence of enhancement on QTA are lacking, and further research may be needed to address this problem.
This study had several limitations that may have influenced the results. There was a large discrepancy between the sample sizes for the two groups due to the difference in the relative incidence of the two types of lesions, as well as the strict exclusion criteria used in our study. The retrospective nature of the study may have also resulted in a number of limitations, including subject selection bias. In the future, a well-designed prospective study with enough cases should be carried out to test the reliability of our equation. In addition, due to the relatively small size of our study population, we did not divide our data into training and test datasets.
Conclusion
Based on unenhanced CT images, our results suggest that machine learning-based QTA is a feasible method for differentiating sPHEO from LPA when AI is present.
Supplementary Material
Supplementary figure, tables and methods.
Acknowledgements
This work was partially supported by the National Natural Science Foundation of China (grant number 81400773), China Postdoctoral Science Foundation funded project (2018M632997), The Postdoctoral Science Foundation of Central South University (No.185705), XiangYa-Peking University WeiMing Clinical and Rehabilitation Research Fund (grant number xywm2015I35) and the Natural Science Foundation of Hunan Province (2018JJ2641). We thank Taihao Jin (Ph.D.) and Carol Wuenschell (M.D, Ph.D) from City of Hope National Medical Center for helpful discussion and language editing in preparing the manuscript. The authors thank for all the members in the department of radiology, Xiangya Hospital, Central South University, for their helpful discussion.
Abbreviations
AI: adrenal incidentaloma; LPA: lipid-poor adenomas; sPHEO: subclinical pheochromocytoma; QTA: Quantitative texture analysis; ROC curve: Receiver operating characteristic curve; ICC: Intraclass correlation coefficients.
Competing Interests
The authors have declared that no competing interest exists.
References
1. Mantero F, Terzolo M, Arnaldi G. et al. A survey on adrenal incidentaloma in Italy. Study Group on Adrenal Tumors of the Italian Society of Endocrinology. J Clin Endocrinol Metab. 2000;85(2):637-44
2. Mansmann G, Lau J, Balk E, Rothberg M, Miyachi Y, Bornstein SR. The clinically inapparent adrenal mass: update in diagnosis and management. Endocr Rev. 2004;25(2):309-40
3. Song JH, Mayo-Smith WW. Current status of imaging for adrenal gland tumors. Surg Oncol Clin N Am. 2014;23(4):847-61
4. Boland GW, Lee MJ, Gazelle GS, Halpern EF, McNicholas MM, Mueller PR. Characterization of adrenal masses using unenhanced CT: an analysis of the CT literature. AJR Am J Roentgenol. 1998;171(1):201-4
5. Zhou Y, Tang Y, Tang J. et al. Primary adrenal leiomyosarcoma: a case report and review of literature. Int J Clin Exp Pathol. 2015;8:4258-4263
6. Luo J, Chen L, Wen Q. et al. Lipoadenoma of the adrenal gland: report of a rare entity and review of literature. Int J Clin Exp Pathol. 2015Aug1;8(8):9693-7
7. Park BK, Kim CK, Kwon GY, Kim JH. Re-evaluation of pheochromocytomas on delayed contrast-enhanced CT: washout enhancement and other imaging features. Eur Radiol. 2007;17(11):2804-9
8. Patel J, Davenport MS, Cohan RH, Caoili EM. Can established CT attenuation and washout criteria for adrenal adenoma accurately exclude pheochromocytoma. AJR Am J Roentgenol. 2013;201(1):122-7
9. Umanodan T, Fukukura Y, Kumagae Y. et al. ADC histogram analysis for adrenal tumor histogram analysis of apparent diffusion coefficient in differentiating adrenal adenoma from pheochromocytoma. J Magn Reson Imaging. 2017;45(4):1195-1203
10. Aerts HJ, Velazquez ER, Leijenaar RT. et al. Decoding tumour phenotype by noninvasive imaging using a quantitative radiomics approach. Nat Commun. 2014;5:4006
11. Feng Z, Rong P, Cao P. et al. Machine learning-based quantitative texture analysis of CT images of small renal masses: Differentiation of angiomyolipoma without visible fat from renal cell carcinoma. Eur Radiol. 2018 Apr;28(4):1625-1633
12. Gillies RJ, Kinahan PE, Hricak H. Radiomics: Images Are More than Pictures, They Are Data. Radiology. 2016;278(2):563-77
13. Goh V, Ganeshan B, Nathan P, Juttla JK, Vinayan A, Miles KA. Assessment of response to tyrosine kinase inhibitors in metastatic renal cell cancer: CT texture as a predictive biomarker. Radiology. 2011;261(1):165-71
14. Hodgdon T, McInnes MD, Schieda N, Flood TA, Lamb L, Thornhill RE. Can Quantitative CT Texture Analysis be Used to Differentiate Fat-poor Renal Angiomyolipoma from Renal Cell Carcinoma on Unenhanced CT Images. Radiology. 2015;276(3):787-96
15. Schieda N, Thornhill RE, Al-Subhi M. et al. Diagnosis of Sarcomatoid Renal Cell Carcinoma With CT: Evaluation by Qualitative Imaging Features and Texture Analysis. AJR Am J Roentgenol. 2015;204(5):1013-23
16. Yan L, Liu Z, Wang G. et al. Angiomyolipoma with minimal fat: differentiation from clear cell renal cell carcinoma and papillary renal cell carcinoma by texture analysis on CT images. Acad Radiol. 2015;22(9):1115-21
17. Szczypiński PM, Strzelecki M, Materka A, Klepaczko A. MaZda-a software package for image texture analysis. Comput Methods Programs Biomed. 2009;94(1):66-76
18. Collewet G, Strzelecki M, Mariette F. Influence of MRI acquisition protocols and image intensity normalization methods on texture classification. Magn Reson Imaging. 2004;22(1):81-91
19. Wu Z, Matsui O, Kitao A. et al. Hepatitis C related chronic liver cirrhosis: feasibility of texture analysis of MR images for classification of fibrosis stage and necroinflammatory activity grade. PLoS One. 2015;10(3):e0118297
20. Yi X, Long X, Xiao D, Zai H, Li Y. Rhabdomyosarcoma in adrenal region of a child with hypertension and fever: a case report and literature review. J Pediatr Surg. 2013;48(3):e5-8
21. Zhang Y, Cai P, Chen M. et al. Imaging findings of adrenal primitive neuroectodermal tumors: a series of seven cases. Clin Transl Oncol. 2017;19(5):641-649
22. Schieda N, Alrashed A, Flood TA, Samji K, Shabana W, McInnes MD. Comparison of Quantitative MRI and CT Washout Analysis for Differentiation of Adrenal Pheochromocytoma From Adrenal Adenoma. AJR Am J Roentgenol. 2016;206(6):1141-8
23. Schieda N, Siegelman ES. Update on CT and MRI of Adrenal Nodules. AJR Am J Roentgenol. 2017;208(6):1206-1217
24. Song G, Joe BN, Yeh BM, Meng MV, Westphalen AC, Coakley FV. Risk of catecholamine crisis in patients undergoing resection of unsuspected pheochromocytoma. Int Braz J Urol. 2011;37(1):35-40 discussion 40-1
25. Aggarwal S, Talwar V, Virmani P, Kale S. Anesthetic Management of Clinically Silent Familial Pheochromocytoma with MEN 2A: A Report of Four Cases. Indian J Surg. 2016;78(5):414-417
26. Motta-Ramirez GA, Remer EM, Herts BR, Gill IS, Hamrahian AH. Comparison of CT findings in symptomatic and incidentally discovered pheochromocytomas. AJR Am J Roentgenol. 2005;185(3):684-8
27. Ganeshan B, Goh V, Mandeville HC, Ng QS, Hoskin PJ, Miles KA. Non-small cell lung cancer: histopathologic correlates for texture parameters at CT. Radiology. 2013;266(1):326-36
Author contact
![]() Corresponding authors: Xueying Long, Department of Radiology, Xiangya Hospital, Central South University, No.87 Xiangya Road, Changsha, Hunan province, P.R.China. Tel: +86-731-84327448; Fax: +86-731-84327448; Email: longxueyingedu.cn and Longfei Liu, Department of Urology, Xiangya Hospital, Central South University, No.87 Xiangya Road, Changsha, Hunan province, P.R. China; Tel: +86-15874869636; Fax: +86-731-89753011; Email: longfei_liucom
Corresponding authors: Xueying Long, Department of Radiology, Xiangya Hospital, Central South University, No.87 Xiangya Road, Changsha, Hunan province, P.R.China. Tel: +86-731-84327448; Fax: +86-731-84327448; Email: longxueyingedu.cn and Longfei Liu, Department of Urology, Xiangya Hospital, Central South University, No.87 Xiangya Road, Changsha, Hunan province, P.R. China; Tel: +86-15874869636; Fax: +86-731-89753011; Email: longfei_liucom