Impact Factor ISSN: 1837-9664

 Global reach, higher impact
J Cancer 2018; 9(19):3548-3556. doi:10.7150/jca.26300 This issue Cite
Research Paper
Improved survival in ovarian cancer, with widening survival gaps of races and socioeconomic status: a period analysis, 1983-2012
Jinna Wu*, Huanhuan Sun*, Lewei Yang, Yun Deng, Yan Yan, Shuncong Wang, Guangwei Yang ![]() , Haiqing Ma
, Haiqing Ma ![]()
Department of Oncology, The Fifth Affiliated Hospital of Sun Yat-sen University, Zhuhai, Guangdong 519000, China
*These authors have contributed equally to this work.
Received 2018-3-26; Accepted 2018-7-27; Published 2018-9-8
Abstract
Introduction: Ovarian cancer is the first leading cause of cancer-related deaths among gynecologic malignancies, and the 7th most common female cancer worldwide. However, previous studies on changes in the long-term survival of ovarian cancer were limited.
Methods: Our data were extracted from Surveillance, Epidemiology, and End Results (SEER) registries to assess the incidence and relative survival changes of patients with ovarian cancer during 1983-2012. Patients with ovarian cancer were stratified by age, race, and socioeconomic status (SES). Cox regression analysis and Spearman rank correlation analysis were performed by STATA 12 software.
Results: The overall incidence of ovarian cancer per 100,000 decreased from 13.7 to 12.4 to 10.8 over three decades with peak incidence occurring in the 70+ age group at 47.6, 45.7 and 40.2 in each respective decade. Median survival improved from 34 months to 46 months to 52 months over three decades, with the 5-year relative survival rate (RSR) increasing from 39.3% to 43.4% to 45.4% (p < 0.0001). However, Whites showed higher median survival (34 months) than Blacks (27 months) in the first decade, and the survival difference significantly increased to 16 months in the third decade. Additionally, the median survival difference between the low-poverty group and high poverty group increased from 4 months to 12 months in the three decades.
Discussion: This study demonstrated the decreasing incidence of ovarian cancer with an observed improvement in relative survival over three decades in a large sample. However, the survival gaps among races and SESs significantly widened over the three decades.
Keywords: Ovarian cancer, Incidence, Relative survival, Period analysis, Race, Socioeconomic status
Introduction
Ovarian cancer is the first leading cause of cancer-related deaths among gynecologic malignancies and the 7th most common female cancer worldwide [1]. Most patients with ovarian cancer lack disease-specific symptoms until they are in an advanced stage of disease, which substantially increases the risk of metastasis and early death; therefore ovarian cancer is sometimes referred to as a “silent killer” [2, 3]. Consequently, there is a pressing need to understand the pathogenesis and analyze data from clinical ovarian cancer, which could help design better clinical management to improve treatment outcomes for patients with ovarian cancer.
According to the American Cancer Society, there will be an estimated 22,440 new cases of ovarian cancer and 14,080 death cases in 2017, although ovarian cancer accounts for only 1.3% of all new cancer cases in the US[4]. The prognosis for ovarian cancer is very poor, with the 5-year relative survival rate (RSR) of less than 50%, despite advances in ovarian cancer treatments, such as the improved cytoreductive surgery, more effective chemotherapeutic drugs, radiotherapy and targeted therapy. Recently increasing evidence suggested that there are growing significant racial and SES disparities in various aspects in the US health care system, which has been emphasized by politicians [5-7].
However, previous studies on ovarian cancer prognosis were not comprehensive, as some mainly focus on subgroups of patients who come from certain areas or who have received surgical resection or other treatments [8, 9], while others focused on the effect of age, race, socioeconomic status (SES), stage or marital status on survival [10-14]. The aim of this study was to estimate population-level changes over time in incidence and long-term relative survival for patients diagnosed with primary invasive ovarian cancer, contemporaneously to account for age-, race- and SES-related prognostic factors. Additionally, we sought to determine whether population-level disparities have continued to increase over time across the past decades. This analysis used three decades of data from the National Cancer Institute's Surveillance, Epidemiology, and End Results (SEER) database, spanning from 1983 until 2012.
Methods
Ovarian cancer cases from the SEER database
All data of patients identified with primary invasive ovarian cancer between 1983 and 2012 were extracted from the SEER database of National Cancer Institute. We obtained ovarian cancer incidence across the three decades studied only for patients registered at the original nine SEER sites: the states of Connecticut, Iowa, New Mexico, Utah, and Hawaii and the metropolitan areas of Atlanta, Detroit, San Francisco-Oakland, and Seattle-Puget Sound. However, to obtain more reliable results about ovarian cancer survival analysis, we collected data for patients registered at the following 18 SEER sites: the original 9 sites plus Los Angeles, San Jose-Monterey, Rural Georgia, the Alaska Native Tumor Registry, Greater California, Kentucky, Louisiana, New Jersey, and Greater Georgia, which account for approximately 28% of the U.S. population (https://seer.cancer.gov/registries/terms.html)[15].
Stratified ovarian cancer cases over the past three decades
SEER*Stat version 8.3.2 was used to collect the data and analyze incidence and relative survival. Patients who were identified with primary invasive ovarian cancer as their only tumor or first primary tumor were included in this study. Patient inclusion criteria was based on the World Health Organization International Classification of Diseases for Oncology (ICD-O-3)/WHO 2008 site code C.569[16] and year of diagnosis between 1983 and 2012. Incidence and relative survival data from 1983-2012 were analyzed after being divided into three decades. Ovarian cancer cases diagnosed by autopsy or reported only on a death certificate were excluded. Patients with ovarian cancer were stratified by age, race and SES. Area SES was defined by the county poverty rate, which was divided into three levels using the same cut points used in the National Cancer Institute monograph: < 10% (low-poverty areas), 10%-19.99% (medium-poverty areas), and ≥20% (high-poverty areas)[17-20]. Age groups were divided into (0-19, 20-39, 40-54, 55-69, 70+ years), and race was stratified into White, Black, and Other (American Indian/Alaska Native, Asian/Pacific islander). Patients whose race or county level poverty rate was defined as ''unknown'' or ''blank'' were excluded during the stratification analysis.
Statistical analysis
Incidence was expressed per 100,000 population and age-adjusted to the 2000 U.S. standard population. Cancer patient survival was typically measured from the date of diagnosis to the date of death. Period analysis methodology was applied to calculate the relative survival rate, which measures mortality attributable, either directly or indirectly to ovarian cancer. The survival difference was analyzed by Kaplan-Meier survival analysis with a two-tailed log-rank test. It was considered to be statistically significant with p value < 0.01.
Cox regression and correlation analysis
The association of survival with age, race, and SES was assessed via Cox regression analysis and Spearman rank correlation analysis. STATA software (version 12.0; Stata Corp, College Station, TX, USA) was used for statistical analysis. A two-tailed p value < 0.01 was considered as statistically significant. Due to the heterogeneity of racial composition in Others, only white and black patients were included for Cox regression and correlation analysis. The medium- and high-poverty groups were combined into a med-high-poverty group.
Results
Changes of incidence in ovarian cancer during 1983-2012
Data for 49,481 patients with ovarian cancer diagnosed between 1983 and 2012 were extracted from the original 9 SEER registry sites. The incidence of ovarian cancer decreased over time through the past three decades, from 13.8 to 12.4 to 10.8 per 100,000 in each respective decade. A similar decreased tendency was also shown in most age groups except for the 0-19 age group, in which the incidence of ovarian cancer remained stable at 0.6 per 100,000 over three decades. Although the 55-69 and 70+ age groups showed significantly higher ovarian cancer incidence, incidence in these groups decreased over three decades from 37.7 to 33.2 to 28.0, and from 47.6 to 45.7 to 40.2 per 100,000, respectively. However, the absolute number of ovarian cancer cases increased in most age groups, with the exception of the 20-39 age group over three decades, as the general population grew (Figure 1a, 1b, Supplementary Table S1).
Summary incidences of patients diagnosed with ovarian cancer between 1983 and 2012 at the original nine SEER sites. Incidence (a), and number (b) of ovarian cancer cases are shown by age group (total and ages 0-19, 20-39, 40-54, 55-69, and 70+ years) and calendar period. Incidence (c,e) and number (d,f) of ovarian cancer cases are grouped by SES and race, respectively.
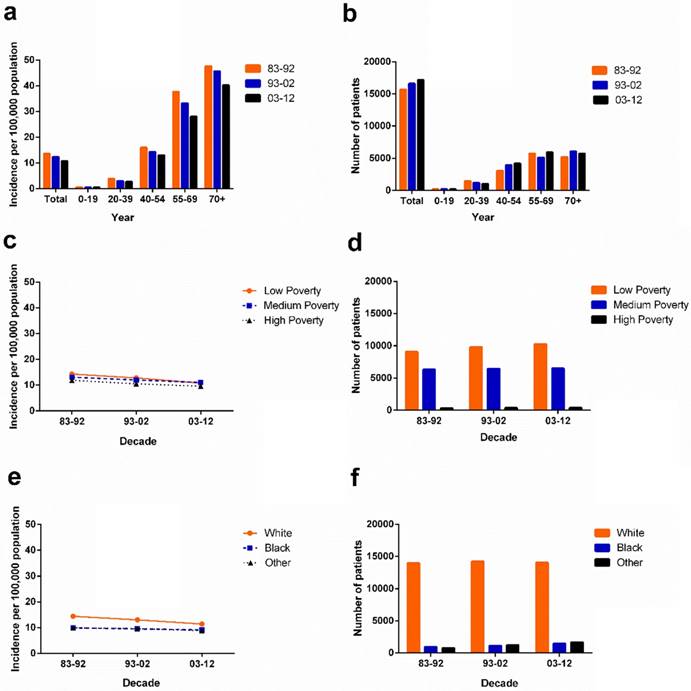
Incidence of ovarian cancer in various SES and race groups
The ovarian cancer incidence per 100,000 in SES subgroups decreased over three decades with the lowest incidence in the high-poverty group (from 11.9 in 1983-1992 to 10.5 in 1993-2002 to 9.6 in 2003-2012). In the first two decades, the highest incidence was found in the low-poverty group with 14.3 per 100,000 and 12.8 per 100,000 respectively. However, in the third decade, the highest incidence was shown in the medium-poverty group with 11.0 per 100,000 which was slightly higher than the incidence in the low-poverty group (10.8 per 100,000; Figure 1c). Whites had a higher ovarian cancer incidence than Blacks and Others over three decades. Blacks and Others showed similar incidence per 100,000 over the three decades, from 9.9 to 9.5 to 9.1 and from 9.9 to 9.6 to 8.8, respectively. However, due to the more rapidly declining ovarian cancer incidence of Whites, the incidence gap between Whites and Blacks continually narrowed over the three decades (Figure 1e).
Trend in ovarian cancer relative survival at the 18 SEER sites during 1983-2012
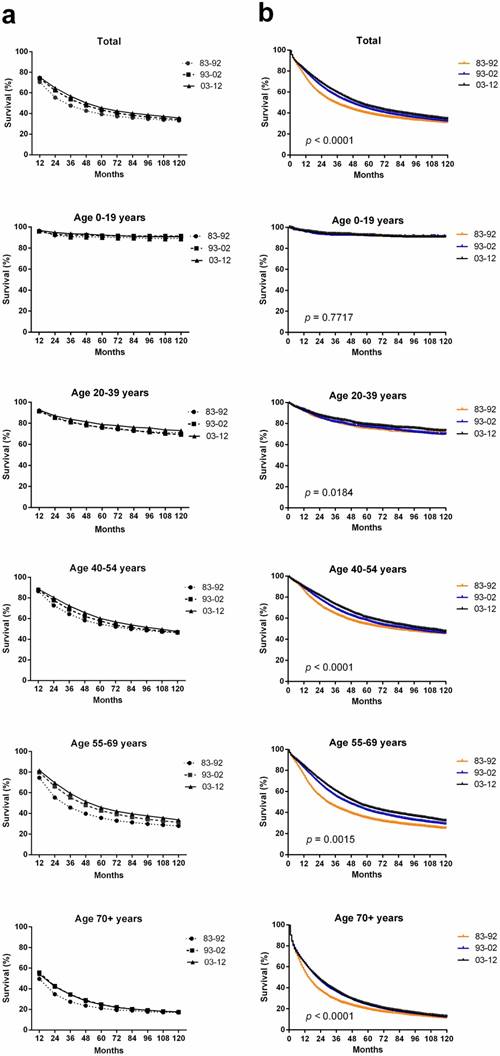
In total, 94,771 ovarian cancer cases were identified over the past three decades from 18 SEER sites; these cases showed an improved median survival of 34 months, 46 months and 52 months in each respective decade. An improvement in the both relative survival rate (RSR) and survival time over three decades for patients with ovarian cancer was observed in each age group (Table 1, Figure 2a). The 5-year RSR during 1993-2002 with patients' number (n = 30299) was higher than that during 1983-1992 (n = 16210; 43.4% vs 39.3%, p < 0.0001), and the RSR during 2003-2012 (n = 48262) was even higher (45.4% vs 43.4%, p < 0.0001). The increasing survival trend was also observed after up to 10 years of follow-up. Furthermore, Kaplan-Meier survival analysis also demonstrated survival improvement in all 39+ age groups over three decades (Figure 2b).
Relative survival rates of ovarian cancer patients during the periods of 1983-1992, 1993-2002, and 2003-2012 at 18 SEER sites. Data are mean ± standard error of the mean, with number of patients in parentheses.
| Age | Decade | ||
|---|---|---|---|
| Group | 1983-1992 | 1993-2002 | 2003-2012 |
| 12-Mo RS | |||
| All | 70.6 ± 0.4 (16210) | 74.2 ± 0.3(30299)*** | 75.3 ± 0.2(48262)*** |
| 0-19 | 96.3 ± 1.3(216) | 95.9 ± 1.0(415) | 96.8 ± 0.7(720) |
| 20-39 | 91.9 ± 0.7(1510) | 91.4 ±0.6(2247) | 92.6 ± 0.5(3278) |
| 40-54 | 86.5 ± 0.6(3183) | 87.9 ± 0.4(7278) | 88.6 ± 0.3(11787)* |
| 55-69 | 74.5 ± 0.6(5915) | 79.8 ± 0.4(9482)*** | 81.6 ± 0.3(16448)*** |
| 70+ | 49.5± 0.7(5386) | 55.6 ± 0.5(10877)*** | 54.3 ± 0.4(16029)*** |
| 60-Mo RS | |||
| All | 39.3 ± 0.4 | 43.4± 0.3*** | 45.4 ± 0.3*** |
| 0-19 | 90.5 ± 2.0 | 91.9 ± 1.4 | 92.4 ± 1.1 |
| 20-39 | 75.6 ± 1.1 | 76.0 ± 0.9 | 78.8 ± 0.8 |
| 40-54 | 54.5 ± 0.9 | 57.8 ± 0.6* | 60.2 ± 0.5*** |
| 55-69 | 35.6 ± 0.7 | 42.6 ± 0.5*** | 45.7 ± 0.5*** |
| 70+ | 21.1 ± 0.7 | 24.8 ± 0.5*** | 24.7 ±0.4*** |
| 120-Mo RS | |||
| All | 33.1 ± 0.4 | 34.2 ± 0.3 | 35.7 ± 0.4** |
| 0-19 | 89.2 ± 2.1 | 91.5 ± 1.4 | 90.9 ± 1.3 |
| 20-39 | 71.0 ± 1.2 | 69.4 ± 1.0 | 73.0 ± 1.1 |
| 40-54 | 46.4 ± 0.9 | 46.7 ± 0.6 | 47.5± 0.7 |
| 55-69 | 27.9 ± 0.6 | 31.4 ± 0.5*** | 33.7 ± 0.7*** |
| 70+ | 17.0 ± 0.7 | 17.4 ± 0.5 | 17.7 ± 0.7 |
Abbreviations: Mo, month; RS, relative survival; SEM, standard error of the mean.
*p < 0.01, **p < 0.001, and ***p < 0.0001 for comparisons with the preceding decade.
Trends in 10-year relative survival rates (a) and Kaplan-Meier survival analysis (b) for patients with ovarian cancer at 18 SEER sites in 1983-1992 (orange), 1993-2002 (blue) and 2003-2012 (black) according to age group (total and ages 0-19, 20-39, 40-54, 55-69, and 70+ years) and calendar period.
Age, race and SES were significantly associated with the survival across three decades according to Cox regression analysis (p < 0.01). Hazard ratios (HRs) were higher in older patients of 1.045 (95% CI: 1.044-1.046), Blacks of 1.206 (95% CI: 1.170-1.243) and med-high-poverty group of 1.034 (95% CI: 1.017-1.051) over three decades, with younger patients, Whites, and the low-poverty group as references, respectively. When patients with ovarian cancer were stratified by three decades, age was significantly associated with survival over three decades. Race was related with the survival in the last two decades, and SES was significantly associated with the survival in the last decade (Table 2). After division of patients by age, age was still significantly associated with the survival. Race was related with survival time in all 39+ age groups, and SES became an independent predictor in the 40-54 and 55-69 age groups with p < 0.001 (Supplementary Table S2).
Summary data for Cox regression analysis of survival in patients with ovarian cancer from 1983 to 2012 at 18 SEER sites.
| Variable | Relative Risk (95% CI) | p-value |
|---|---|---|
| All 1983-2012 | ||
| Univariate | ||
| Age | 1.045 (1.044 - 1.046) | < 0.001 |
| Race | 1.206 (1.170 -1.243) | < 0.001 |
| SES | 1.034 (1.017 - 1.051) | < 0.001 |
| Multivariate | ||
| Age | 1.040 (1.039 - 1.041) | < 0.001 |
| Race | 1.401 (1.359 - 1.444) | < 0.001 |
| SES | 1.013 (0.996 - 1.030) | =0.121 |
| All 1983-1992 | ||
| Univariate | ||
| Age | 1.047 (1.046 - 1.049) | < 0.001 |
| Race | 1.078 (1.001 -1.160) | =0.045 |
| SES | 1.038 (1.001 - 1.076) | =0.041 |
| All 1993-2002 | ||
| Univariate | ||
| Age | 1.043 (1.042 -1.044) | < 0.001 |
| Race | 1.146 (1.088 - 1.207) | < 0.001 |
| SES | 1.037 (1.008 - 1.067) | =0.010 |
| Multivariate | ||
| Age | 1.038 (1.037 -1.039) | < 0.001 |
| Race | 1.377 (1.307 - 1.451) | < 0.001 |
| All 2003-2012 | ||
| Univariate | ||
| Age | 1.045 (1.044 - 1.046) | < 0.001 |
| Race | 1.323 (1.269 - 1.380) | < 0.001 |
| SES | 1.071 (1.043 - 1.100) | < 0.001 |
| Multivariate | ||
| Age | 1.039 (1.038 - 1.041) | < 0.001 |
| Race | 1.492 (1.430 - 1.557) | < 0.001 |
| SES | 1.058 (1.030 - 1.086) | < 0.001 |
Abbreviations: 95% CI, 95% confidence interval; SES, socioeconomic status.
Ovarian cancer survival in various races, and SESs
Whites (n = 14378) showed higher 5-year RSR compared with Blacks (n = 981) in 1983-1992 (38.9% vs 36.0%). The survival gap between Whites (n = 25883) and Blacks (n = 2171) widened in 1993-2002 (43% vs 37.6%) and kept widening in 2003-2012 (45.4% vs 36.6%). A similar tendency over time was also found in 10-year RSRs. Additionally, Others showed the highest RSR in 5 years and 10 years over three decades (Figure 3a, Supplementary Table S3).
1-year, 5-year and 10-year relative survival rates according to race (a) including White (orange), Black (blue) and Others (black), and SES/county-level poverty rates (b), including Low-poverty (orange), Medium-poverty (blue) and High-poverty (black) for patients with ovarian cancer at 18 SEER sites from 1983 to 2012.
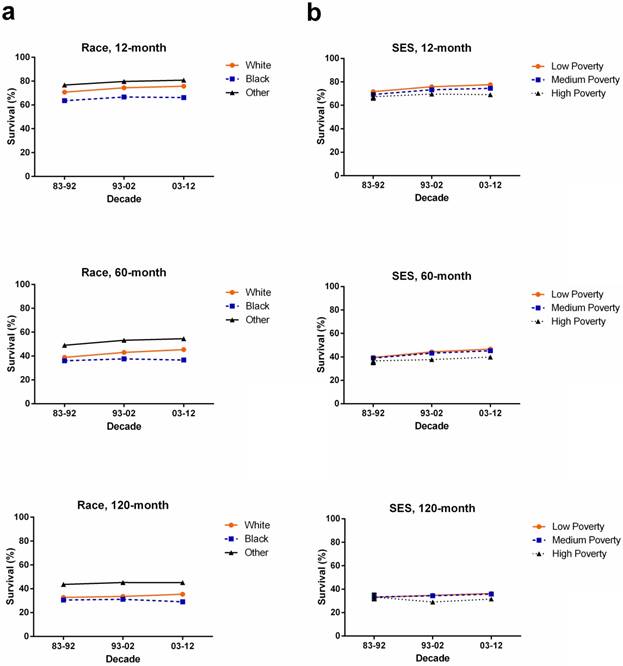
When 5-year and 10-year RSRs were analyzed, the low-poverty group (n = 40136) showed the highest RSR while the lowest RSR was shown in the high-poverty group (n = 5342). All SES subgroups showed survival improvement over three decades, but the RSR gaps among the three SES subgroups continued to widen each decade. For instance, the 5-year RSR for low-, medium-, and high-poverty groups in 1983-1992 was 39.5%, 39.0% and 36.6%, respectively, with a difference of 0.5% between low- and medium-poverty, and 2.4% between medium- and high-poverty, while these difference increased to 1.4% and 5.4%, respectively, in 2003-2012. A similar tendency was also shown in the 10-year RSRs (Figure 3b, Supplementary Table S4).
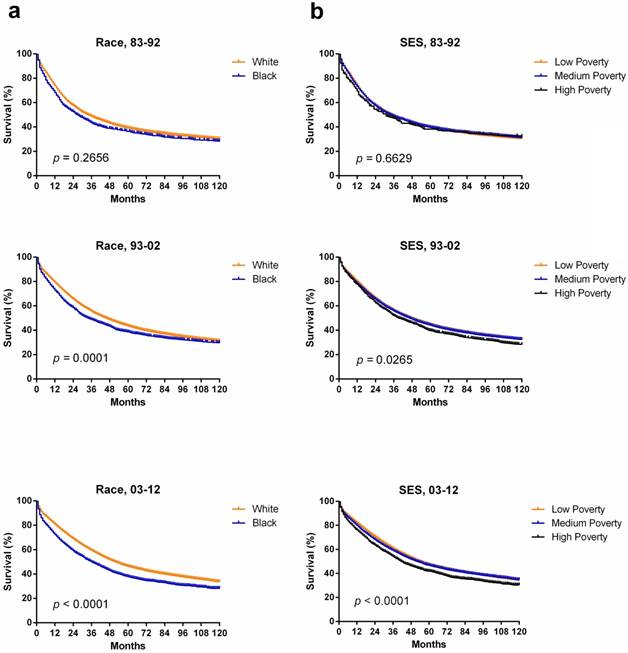
Interestingly, different races had different SES distribution with a majority of Whites being classified as low-poverty compared with Black (63.0% vs 26.1%) whereas majority of black patients were classified as medium-poverty (73.6% vs 34.9%; Supplementary Figure S1, Supplementary Table S5). The correlation between race and SES was illustrated by Spearman's rank correlation coefficient of 0.147, with p < 0.001. Indeed, the survival disparity between Whites and Blacks partially reflected the survival difference among different SES groups. Whites showed higher median survival (34 months) than Blacks (27 months) in the first decade, and the survival difference significantly increased to 16 months in the third decade (p < 0.0001; Figure 4a). Similarly, survival advantage was observed in the low-poverty group compared to the high-poverty group, and the gap kept widening over time, from 4 months to 12 months over the three decades. Additionally, Kaplan-Meier survival analysis demonstrated the difference among the three SES subgroups, with decreasing p values over three decades (Figure 4b).
Kaplan-Meier survival analysis according to race (a) including White (orange), and Black (blue), and SES/ county-level poverty rates (b) including Low-poverty (orange), Medium-poverty (blue) and High-poverty (black) for patients with ovarian cancer at 18 SEER sites from 1983 to 2012.
Discussion
We observed that the overall incidence of ovarian cancer has decreased over three decades between 1983 and 2012, and median survival of ovarian cancer increased from 34 months to 46 months to 52 months in each decade, with 5-year RSR increasing from 39.3% to 43.4% to 45.4% in the same period. However, the difference of median survival between Whites (n = 80446) and Blacks (n = 7255) increased from 7 months to 16 months, and the difference between the low-med-poverty group (n = 89411) and high poverty group (n = 5342) increased from 4 months to 12 months over the three decades.
We found that the overall incidence of ovarian cancer decreased by 9.5% during the first two decades, and it further decreased by 12.9% in the last decade. The decreasing tendency was shown in most age groups. The decreasing tendency in incidence was consistent with some previous studies in other regions over the past three decades. Decreased incidence was partly attributable to the widespread use of protective oral contraceptive drugs and the decreased use of postmenopausal hormone supplementation. The median survival of patients with ovarian cancer improved in each decade with the overall 5-year RSR increasing from 39.3% to 45.4% over three decades. The recent data from the Annual Report on the Results of Treatment in Gynecological Cancer, which analyzed survival from a number of sources throughout the world, suggested that 5-year survival for ovarian cancer increased from 27% in 1958-1962 to 50% in 1999-2001[21]. The result was in agreement with the improved survival tendency found in our study. Treatments for ovarian cancer have improved over time, such as the development of tumor cytoreductive surgery, adjuvant therapy with platinum agents, taxane-based chemotherapy and intraperitoneal delivery of chemotherapy [22-25]. Furthermore, the importance of altered scheduling of chemotherapy with dose-dense treatment has been recognized [26]. These changes have improved patients' survival.
In terms of race, Blacks and Others shared a similarly lower incidence, whereas Whites showed the highest incidence over three decades. However, the incidence gap between Whites and other racial groups continually narrowed due to a more rapidly declining ovarian cancer incidence in Whites over three decades. Our study also demonstrated that Whites had higher 5-year, and 10-year RSRs compared with Blacks over three decades. More importantly, the RSR difference between Whites and Blacks increased over time. The increasing survival should be due to the emergence of new treatments including intraperitoneal chemotherapy and treatment with antiangiogenic and targeted chemotherapies in recent years [11]. Disparities in access to these therapies may have significantly increased the survival disparity between the Whites and Blacks in this study. Some recent studies found that Blacks had more frequent delayed treatment rate or received non-standard treatment regimens compared with Whites [25, 27]. Additionally, black patients with ovarian cancer were usually treated with surgery only, while white patients had a combination of surgery and chemotherapy. A study demonstrated that patients with ovarian cancer who received surgery with chemotherapy had significantly improved survival compared to those who received surgery alone [28]. Taken together, this study highlighted social factors and cultural difference in the clinical management of ovarian cancer, and therefore, there is an urgent need to improve treatment and health care for black patients.
In subgroups of SES, incidence differed with the highest incidence in the low-poverty group in first two decades. In the third decade, the medium-poverty group showed the highest incidence, which was slightly higher than that of the low-poverty group. In addition, the low-poverty group had higher RSR, and the survival gap among the three SES groups increased over time, especially in the third decade. This finding may be attributed to the fact that patients living in low-poverty neighborhoods could have access to better medical consultation and treatment resources over time. When classified by SES, Whites were more likely than Blacks to be in the low-poverty group. Compared to whites, Blacks were more likely to reside in counties with lower health insurance coverage, fewer oncology hospitals and medical doctors, and fewer hospitals with ultrasound machines, all of which have been associated with increased risk of ovarian cancer mortality and worse survival [29]. Furthermore, this disparity in finance is believed to keep blank patients away from better medical consultation and treatment early in disease progression. Therefore, the SES disparity between Whites and Blacks may partially explain the changes of incidence and survival between them.
Cox regression analysis showed that age, race and SES were significantly associated with the overall survival of ovarian cancer between 1983 and 2012. SES was increasingly significantly associated with the survival, with the p value decreasing from 0.041 to 0.010 to 0.001 in each respective decade. With more and more novel and effective therapies emerging, the role of SES is increasingly vital in determining whether patients with ovarian cancer can obtain suitable treatment timely. Kaplan-Meier survival analysis also showed the increasing difference in survival among the three SES subgroups with decreasing p values over three decades.
It is noteworthy that although we collected a mass patient population from the SEER database to calculate the incidence, relative survival and associated tends over three decades, this study was still limited because the result reflected only selected SEER regions and were not applied to other geographic locations. Additionally, the study might be affected by under-registration, misclassification and variation of SES within and among counties [19, 20]. Further, it was not analyzed based on histology and did not have the details of treatment for patients with ovarian cancer, which may have differed in relative survival.
In summary, our study demonstrated an improvement in incidence and survival of patients with ovarian cancer over the past three decades. However, the survival gap among races and various SESs increased over time. Furthermore, this study will help politicians improve the health care system and promote effective clinical management to eliminate the survival disparities among age, races and SESs groups confirmed in this study and thereby improved the clinical outcome of ovarian cancer.
Supplementary Material
Supplementary figure and tables.
Acknowledgements
This study was funded by the National Natural Science Foundation of China (81500030) and the Natural Science Foundation of Guangdong Province (2016A030313272, 2016A030313277, 2017A030313573).
Competing Interests
The authors have declared that no competing interest exists.
References
1. Torre LA, Bray F, Siegel RL, Ferlay J, Lortet-Tieulent J, Jemal A. Global cancer statistics, 2012. CA: a cancer journal for clinicians. 2015;65:87-108
2. Holschneider CH, Berek JS. Ovarian cancer: epidemiology, biology, and prognostic factors. Seminars in surgical oncology. 2000;19:3-10
3. Jensen A, Sharif H, Frederiksen K, Kjær SK. Use of fertility drugs and risk of ovarian cancer: Danish population based cohort study. The BMJ. 2009:338
4. Siegel RL, Miller KD, Jemal A. Cancer Statistics, 2017. CA: a cancer journal for clinicians. 2017;67:7-30
5. Towne SD Jr. Socioeconomic, Geospatial, and Geopolitical Disparities in Access to Health Care in the US 2011-2015. International journal of environmental research and public health. 2017:14
6. Kendrick J, Nuccio E, Leiferman JA, Sauaia A. Primary Care Providers Perceptions of Racial/Ethnic and Socioeconomic Disparities in Hypertension Control. American Journal of Hypertension. 2015;28:1091-7
7. Collins Y, Holcomb K, Chapman-Davis E, Khabele D, Farley JH. Gynecologic cancer disparities: a report from the Health Disparities Taskforce of the Society of Gynecologic Oncology. Gynecologic oncology. 2014;133:353-61
8. Dinkelspiel HE, Tergas AI, Zimmerman LA, Burke WM, Hou JY, Chen L. et al. Use and duration of chemotherapy and its impact on survival in early-stage ovarian cancer. Gynecologic oncology. 2015;137:203-9
9. Bellia A, Vitale SG, Lagana AS, Cannone F, Houvenaeghel G, Rua S. et al. Feasibility and surgical outcomes of conventional and robot-assisted laparoscopy for early-stage ovarian cancer: a retrospective, multicenter analysis. Archives of gynecology and obstetrics. 2016;294:615-22
10. Matsuo K, Machida H, Shoupe D, Melamed A, Muderspach LI, Roman LD. et al. Ovarian Conservation and Overall Survival in Young Women With Early-Stage Low-Grade Endometrial Cancer. Obstetrics and gynecology. 2016;128:761-70
11. Terplan M, Schluterman N, McNamara EJ, Tracy JK, Temkin SM. Have racial disparities in ovarian cancer increased over time? An analysis of SEER data. Gynecologic oncology. 2012;125:19-24
12. Praestegaard C, Kjaer SK, Nielsen TS, Jensen SM, Webb PM, Nagle CM. et al. The association between socioeconomic status and tumour stage at diagnosis of ovarian cancer: A pooled analysis of 18 case-control studies. Cancer epidemiology. 2016;41:71-9
13. Mahdi H, Kumar S, Munkarah AR, Abdalamir M, Doherty M, Swensen R. Prognostic impact of marital status on survival of women with epithelial ovarian cancer. Psycho-oncology. 2013;22:83-8
14. Chen T, Jansen L, Gondos A, Emrich K, Holleczek B, Katalinic A. et al. Survival of ovarian cancer patients in Germany in the early 21st century: a period analysis by age, histology, laterality, and stage. European journal of cancer prevention: the official journal of the European Cancer Prevention Organisation (ECP). 2013;22:59-67
15. National Cancer Institute, DCCPS, Surveillance Research Program, Surveillance Systems Branch. Surveillance, Epidemiology, and End Results (SEER) Program Research Data (1973-2015). Released April 2012, based on the November. 2011 submission. https://seer.cancer.gov
16. Organization. WH. International classification of diseases for oncology: Morphology. 3. Geneva: World Health Organization. 2000
17. Sun H, Ma H, Hong G, Sun H, Wang J. Survival improvement in patients with pancreatic cancer by decade: a period analysis of the SEER database, 1981-2010. Scientific reports. 2014;4:6747
18. Singh GK. et al. Area Socioeconomic Variations In US Cancer Incidence, Mortality, Stage, Treatment, And Survival, 1975-1999. National Cancer Institute, Bethesda Report No: NIH Publication No03-5417 (2003).
19. Krieger N, Chen JT, Waterman PD, Soobader MJ, Subramanian SV, Carson R. Geocoding and monitoring of US socioeconomic inequalities in mortality and cancer incidence: does the choice of area-based measure and geographic level matter?: the Public Health Disparities Geocoding Project. American journal of epidemiology. 2002;156:471-82
20. Krieger N, Chen JT, Waterman PD, Rehkopf DH, Subramanian SV. Race/ethnicity, gender, and monitoring socioeconomic gradients in health: a comparison of area-based socioeconomic measures-the public health disparities geocoding project. American journal of public health. 2003;93:1655-71
21. Heintz AP, Odicino F, Maisonneuve P, Quinn MA, Benedet JL, Creasman WT. et al. Carcinoma of the ovary. FIGO 26th Annual Report on the Results of Treatment in Gynecological Cancer. International journal of gynaecology and obstetrics: the official organ of the International Federation of Gynaecology and Obstetrics. 2006;95(Suppl 1):S161-92
22. Griffiths CT. Surgical resection of tumor bulk in the primary treatment of ovarian carcinoma. National Cancer Institute monograph. 1975;42:101-4
23. McGuire WP, Hoskins WJ, Brady MF, Kucera PR, Partridge EE, Look KY. et al. Cyclophosphamide and cisplatin compared with paclitaxel and cisplatin in patients with stage III and stage IV ovarian cancer. The New England journal of medicine. 1996;334:1-6
24. Armstrong DK, Bundy B, Wenzel L, Huang HQ, Baergen R, Lele S. et al. Intraperitoneal cisplatin and paclitaxel in ovarian cancer. The New England journal of medicine. 2006;354:34-43
25. Barnholtz-Sloan JS, Schwartz AG, Qureshi F, Jacques S, Malone J, Munkarah AR. Ovarian cancer: changes in patterns at diagnosis and relative survival over the last three decades. American journal of obstetrics and gynecology. 2003;189:1120-7
26. Katsumata N, Yasuda M, Isonishi S, Takahashi F, Michimae H, Kimura E. et al. Long-term results of dose-dense paclitaxel and carboplatin versus conventional paclitaxel and carboplatin for treatment of advanced epithelial ovarian, fallopian tube, or primary peritoneal cancer (JGOG 3016): a randomised, controlled, open-label trial. The Lancet Oncology. 2013;14:1020-6
27. Harlan LC, Clegg LX, Trimble EL. Trends in surgery and chemotherapy for women diagnosed with ovarian cancer in the United States. Journal of clinical oncology: official journal of the American Society of Clinical Oncology. 2003;21:3488-94
28. Lin JJ, Egorova N, Franco R, Prasad-Hayes M, Bickell NA. Ovarian Cancer Treatment and Survival Trends Among Women Older Than 65 Years of Age in the United States, 1995-2008. Obstetrics and gynecology. 2016;127:81-9
29. Sakhuja S, Yun H, Pisu M, Akinyemiju T. Availability of healthcare resources and epithelial ovarian cancer stage of diagnosis and mortality among Blacks and Whites. J Ovarian Res. 2017;10:57
Author contact
![]() Corresponding authors: Haiqing Ma, email: mahaiqingsysu.edu.cn, and Guangwei Yang, email: yanggwsysu.edu.cn
Corresponding authors: Haiqing Ma, email: mahaiqingsysu.edu.cn, and Guangwei Yang, email: yanggwsysu.edu.cn