Impact Factor ISSN: 1837-9664

 Global reach, higher impact
J Cancer 2018; 9(18):3343-3351. doi:10.7150/jca.25515 This issue Cite
Research Paper
Association of MUC1 rs4072037 Functional Polymorphism and Cancer Risk: Evidence from 12551 Cases and 13436 Controls
Xi Gu#, Jiaxi Feng#, Liyang Liu#, Ming Lu, Xiang Ma, Yang Cao, Baolin Wang, Qinghong Zhao ![]()
Department of General Surgery, the Second Affiliated Hospital of Nanjing Medical University, Nanjing, Jiangsu, China
# Equal contributors and co-first authors.
Received 2018-2-12; Accepted 2018-7-17; Published 2018-9-8
Abstract
Objectives: The result of the relationship between the MUC1 rs4072037 polymorphism and cancer risk is controversial, we take this meta-analysis to investigate a more precise result.
Methods: Electronic database Pubmed, Web of science and Cochrane library had been used to search relevant articles concerning the relationship between MUC1 rs4072037 polymorphism and cancer risk. We used odds ratios (ORs) and 95% confidence intervals (CIs) to assess the strength of the gene-disease association. We also conducted subgroup analysis, sensitivity analyses and publication bias in the meta-analysis.
Results: In our meta-analysis, we involved 17 studies (19 datasets) with 12551 cases and 13436 controls eventually. It showed the MUC1 rs4072037 polymorphism was associated with decreased cancer risk in four genetic models (G vs. A: OR=0.79, 95%CI: 0.71-0.89, P< 0.001; AG vs. AA: OR=0.72, 95%CI: 0.62-0.82, P< 0.001; GG vs. AA: OR=0.78, 95%CI: 0.69-0.88, P< 0.001; AG+GG vs. AA: OR=0.72, 95%CI: 0.63-0.83, P< 0.001). In subgroup analysis, it showed a decreased cancer risk among Asians but not Caucasians and a significant decreased gastric cancer risk in all genetic models.
Conclusion: MUC1 rs4072037 polymorphism is associated with decreased cancer risk and can probably be used as a tumor marker, especially for gastric cancer and for Asians.
Keywords: Cancer, MUC1 rs4072037, Polymorphism, Meta-analysis
Introduction
Cancer is the main disease lead to death in the world. Approximately 14.1 million cancer cases occurred and 8.2 million cancer patients died in 2012[1]. Gastric cancer is the fourth most common cancer worldwide. It is also the second leading cause of cancer death. Every year, there are more than 950000 new gastric cancer patients [2]. Cancer is a complex disease. Endogenous factors (genetic, immune and endocrine disorders) and exogenous factors (unhealthy behaviors and environmental carcinogens) are both contributed to the cause of cancer [3]. However, under similar environmental circumstances, some people have cancers while others not may suggest genetic predisposition is vital in cancer development.
Single nucleotide polymorphisms (SNPs) are signal-base pairs in genomic DNA that vary in at least 1% of the population [4] and account for much of normal human genetic variation [5]. SNPs which have relationship with cancer are involved in lots of cellular pathways related to DNA repair, cell proliferation, apoptosis, chemotherapy targets and immune response [6]. Recently, genome-wide association study (GWAS) was used to identify the potential candidates for SNPs. Abnet et al.conducted a GWAS on Chinese population in 2010 and discovered MUC1 rs4072037 polymorphism was associated with the gastric cancer risk [7]. In 2011, Saeki et al. also found MUC1 rs4072037 polymorphism was associated with gastric cancer by the Japanese GC GWAS [8]. MUC1, or CA15.3, is expressed in epithelial linings in a different of tissues and is strongly expressed in the female genital tract during mammary gland and pregnancy and lactation [9]. Rs4072037, a functional SNP in exon 2 of the MUC1 gene, regulates splicing site selection during the posttranscriptional regulation process [10]. Besides gastric cancer, the MUC1 was also reported have association with colorectal cancer [11], ovarian cancer [12] and breast cancer [13]. But the consequences of these reports were controversial, we conducted this meta-analysis to evaluate a more precise association between the MUC1 rs4072037 polymorphism and cancer risk.
Materials and methods
Identification of Study
We searched Pubmed, Web of science and Cochrane library for relavant studies (updated to December, 2017). The search terms were " "Polymorphism, Single Nucleotide" or "Nucleotide Polymorphism, Single" or "Nucleotide Polymorphisms, Single" or "Polymorphisms, Single Nucleotide" or "Single Nucleotide Polymorphisms" or "SNPs" or "Single Nucleotide Polymorphism" " and " "Neoplasms" or "Neoplasia" or "Neoplasias" or "Neoplasm" or "Tumors" or "Tumor" or "Cancer" or "Cancers" or "Malignant Neoplasms" or "Malignant Neoplasm" or "Neoplasm, Malignant" or "Neoplasms, Malignant" or "Malignancy" or "Malignancies" or "Benign Neoplasms" or "Neoplasms, Benign" or "Benign Neoplasm" or "Neoplasm, Benign" " and " "MUC1" or "mucin1" or "1q22" ", with no language limited. In addition, in order to identify additional relevant studies, references of retrieved articles were also included in the manual review.
Criteria of selection
We selected studies according to these criteria: a. concerning the association between MUC1 rs4072037 and cancer risk. b. case-controls and cohort studies. c. identification of cancer was confirmed histologically. d. the number of each MUC1 rs4072037 genotype. e. genotype spreading of control compliance with Hardy-Weinberg equilibrium (HWE). When the same researcher had two or more publications covering the same patient population, the largest number study was included. There are major reasons for excluded the studies: a. case only studies. b. review papers, case report. c. HWE of controls was < 0.05. d. not providing available genotype frequency. e. containing the data which have common characteristics.
Data extraction
The data of the studies was extracted by JX Feng and LY Liu independently. We extracted these information from studies: name of the first author, publication year, country of origin, ethnicity of cases and controls, type of study, type of cancer, genotyping method, source of controls, HWE of controls, number of cases and controls, frequencies of different genotypes (AA, AG and GG genotypes).
Quality assessment
According to the Newcastle-Ottawa Scale (NOS), FJX and LLY conducted quality assessment independently. When disagreement appeared, authors discussed to solve it. The score of study lower than 6 was considered as “low quality”, otherwise was “high quality”.
Statistical analysis
To evaluate the strength of association between MUC1 rs4072037 polymorphism and cancer risk, crude odds ratios (ORs) and 95% confidence intervals (CIs) were used. The Z test was used to identify the statistical significance of pooled ORs. We calculated the pooled odds ratios (ORs) for the allelic model (G allele vs. A allele), heterozygote model (GA vs. AA), homozygote model (GG vs. AA), dominant model (GG+AG vs. AA) and recessive model (GG vs. AA+AG), respectively. To test the heterogeneity among studies, we performed a Cochrane chi-square-bsaed Q-test. In order to evaluate the statistical, I2 tests were used. To evaluate heterogeneity between studies, the I2 index which expresses the percentage of the total variation across studies due to heterogeneity was calculated. I2 values of 25%, 50% and 75% represents the low, median and high heterogeneity respectively. When I2 >50%, the random effects (Dersimonian-Laird method) [14] was implemented to calculate overall OR value. Otherwise, I2 ≤50%, the fixed effects model (Mantel-Haenszel method) [15] was implemented. To search the heterogeneity between studies, subgroup analyses based on civilization, country, type of cancer, genotyping method and sample size were performed. Begg's funnel plot and Egger's linear regression test [16] were used to evaluate publication bias. We conducted sensitivity analyses by removing each single dataset to explore the influence of the single dataset on the pooled ORs. We used Stata software (version 12.0, Stata Corp, College Station, USA) to perform statistical analysis. All P values were two-sides and P ≤0.05 were considered statistically significant.
Consequences
Studying features
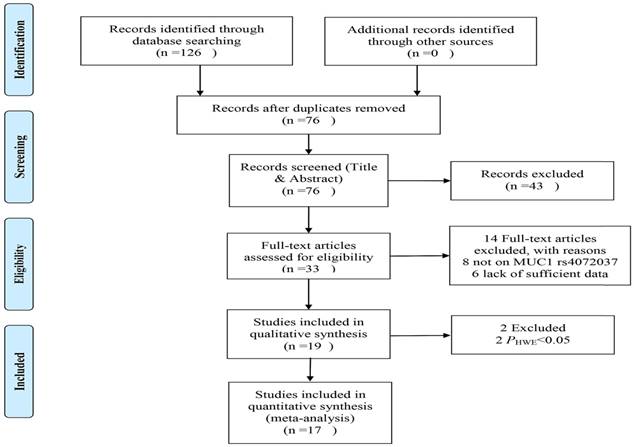
The process of literature selection is shown in the Figure 1. A total 126 articles identified through database searching. After screening title, abstract or the whole text, 19 studies were evaluated for suitability. Then 2 studies were excepted due to genotype distributions of control inconsistent with HWE[17,18]. Finally, 17 studies (19 datasets) with 12551 cases and 13436 controls were involved in this meta-analysis[8,11-13,19-31]. These studies were all case-control designed. There were 13 gastric cancer studies, 2 colorectal cancer studies, 1 breast cancer study, 1 lung cancer study, 1 ovarian cancer study and 1 esophagus cancer study. There were 13 studies of Asian descendent, 6 studies of Caucasian descendent and 1 study of American descendent. There were 10 studies used the genotyping method of TaqMan, 2 used the MassARRAY, 1 used the PCR-SSPs, 1 used the SNPlex and 1 used the KASP. The other characteristic of the studies were shown in the Table 1.
Flow diagram showing studying selection.
Characteristics of included studies
| Study | Year | Country | Ethnicity | Study-type | Cancer-type | Genotyping method | Source of control | Case | Control | PHWE | NOS |
|---|---|---|---|---|---|---|---|---|---|---|---|
| Song[30] | 2013 | Korea | Asian | Case-control | GC | TaqMan | Population | 3225 | 1697 | 0.279 | 6 |
| Zhang H[24] | 2011 | China | Asian | Case-control | GC | TaqMan | Population | 1658 | 1833 | 0.335 | 8 |
| Kruit[13] | 2009 | Netherland | European | Case-control | BC | TaqMan | Population | 229 | 208 | 0.985 | 6 |
| Li F[19] | 2012 | China | Asian | Case-control | CRC | MassARRAY | Population | 230 | 291 | 0.434 | 8 |
| Kupcinskas[20] | 2014 | Lithuania | European | Case-control | GC | TaqMan | Population | 249 | 232 | 0.284 | 6 |
| Horimasu[21] | 2017 | Japan | Asian | Case-control | LC | TaqMan | Population | 172 | 276 | 0.773 | 7 |
| Yang[22] | 2012 | China | Asian | Case-control | GC | MassARRAY | Population | 249 | 100 | 0.223 | 7 |
| Zhang B[23] | 2013 | China | Asian | Case-control | GC | PCR-SSPs | Population | 283 | 281 | 0.992 | 8 |
| Kupcinskas[11] | 2015 | Lithuania | European | Case-control | CRC | TaqMan | Population | 192 | 362 | 0.64 | 6 |
| Palmer[17]a | 2013 | Poland | European | Case-control | EC | TaqMan | Population | 159 | 207 | 0.024 | 6 |
| Palmer[17]a | 2013 | Poland | European | Case-control | GC | TaqMan | Population | 311 | 207 | 0.024 | 6 |
| Cai[25] | 2017 | China | Asian | Case-control | GC | KASP | Population | 480 | 488 | 0.975 | 6 |
| Dai[26] | 2014 | China | Asian | Case-control | EC | TaqMan | Population | 2072 | 2204 | 0.808 | 7 |
| Jia[27] | 2011 | Poland | European | Case-control | GC | SNPlex | Population | 272 | 376 | 0.483 | 7 |
| Li M[28] | 2013 | China | Asian | Case-control | GC | TaqMan | Population | 335 | 334 | 0.242 | 7 |
| Williams[12] | 2014 | America | America | Case-control | OC | TaqMan | Population | 727 | 757 | 0.939 | 6 |
| Sun H[29] | 2015 | China | Asian | Case-control | GC | TaqMan | Hospital | 692 | 774 | 0.735 | 7 |
| Sun Y[31] | 2014 | America | European | Case-control | GC | TaqMan | Population | 129 | 123 | 0.872 | 7 |
| Qiu[18]a | 2016 | China | Asian | Case-control | GC | TaqMan | Hospital | 1124 | 1192 | <0.001 | 7 |
| Saeki-T[8] | 2011 | Japan | Asian | Case-control | GC | TaqMan | Population | 605 | 1264 | 0.466 | 8 |
| Saeki-A[8] | 2011 | Japan | Asian | Case-control | GC | TaqMan | Population | 303 | 1467 | 0.11 | 8 |
| Saeki-K[8] | 2011 | Korea | Asian | Case-control | GC | TaqMan | Population | 449 | 369 | 0.391 | 8 |
a: Studies did not follow the HWE
GC: gastric cancer; BC: breast cancer; CRC: colorectal cancer; LC: lung cancer; EG: esophagus cancer; OC: ovarian cancer
T: Tokyo; A: Aichi; K: Korea
NOS: Newcastle-Ottawa Scale
Conclusions of Meta-analysis
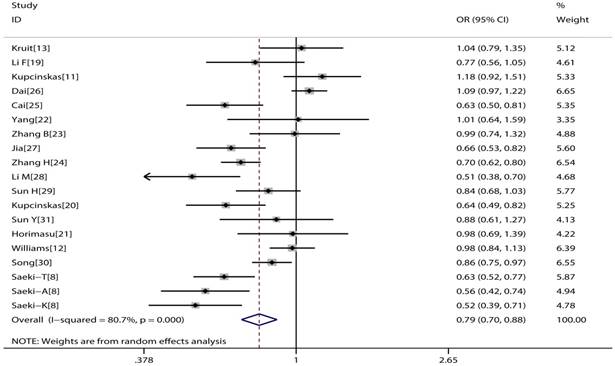
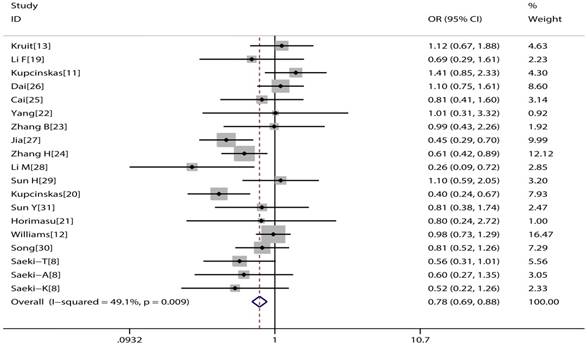
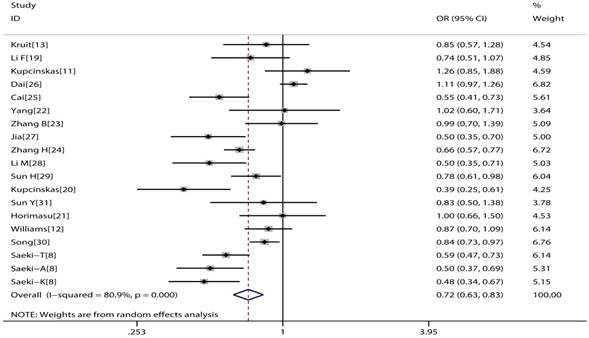
The main consequences of this meta-analysis are shown in the Table 2. MUC1 rs4072037 polymorphism is associated with significant decreased cancer risk in four genetic models (G vs. A: OR=0.79, 95%CI: 0.71-0.89, P< 0.001 Figure 2; AG vs. AA: OR=0.72, 95%CI: 0.62-0.82, P< 0.001 Figure 3; GG vs. AA: OR=0.78, 95%CI: 0.69-0.88, P< 0.001 Figure 4; AG+GG vs. AA: OR=0.72, 95%CI: 0.63-0.83, P< 0.001 Figure 5).
Main results of meta-analysis
| Comparisons | Heterogeneity test | Summary OR (95% CI) | Hypothesis test | Datasets | |||
|---|---|---|---|---|---|---|---|
| Q | P | I2(%) | Z | P | |||
| G vs A | 93.38 | 0 | 80.7 | 0.79(0.71,0.89) | 4.07 | 0 | 19 |
| AG vs AA | 84.59 | 0 | 78.7 | 0.72(0.62,0.82) | 4.65 | 0 | 19 |
| GG vs AA | 35.33 | 0.009 | 49.1 | 0.78(0.69,0.88) | 4.02 | 0 | 19 |
| AG+GG vs AA | 94.37 | 0 | 80.9 | 0.72(0.63,0.83) | 4.5 | 0 | 19 |
| GG vs AG+AA | 21.54 | 0.253 | 16.4 | 0.90(0.81,1.01) | 1.81 | 0.07 | 19 |
Forest plot of cancer risk associated with MUC1 rs4072037 for allelic genetic model (G vs. A).
Forest plot of cancer risk associated with MUC1 rs4072037 for heterozygote genetic model (GA vs. AA).

Forest plot of cancer risk associated with MUC1 rs4072037 for homozygote genetic model (GG vs. AA)
Forest plot of cancer risk associated with MUC1 rs4072037 for dominant genetic model (GG+AG vs. AA)
The subgroup analysis results were shown in the Table 3. By subgroup analysis in ethnicity, a reduced risk of cancer was found in entire genetic models (G vs. A: OR=0.75, 95%CI: 0.65-0.87, P< 0.001; AG vs. AA: OR=0.72, 95%CI: 0.61-0.85, P< 0.001; GG vs. AA: OR=0.75, 95%CI: 0.64-0.89, P= 0.001; AG+GG vs. AA: OR=0.72, 95%CI: 0.61-0.85, P< 0.001; GG vs. AG+AA, OR=0.81, 95%CI: 0.69-0.96, P= 0.013) among Asian descendent. However no similar association was found among Caucasian descendent. Furthermore, significantly reduced gastric cancer risk was found in entire genetic models (G vs. A: OR=0.70, 95%CI: 0.63-0.78, P< 0.001; AG vs. AA: OR=0.64, 95%CI: 0.55-0.74, P< 0.001; GG vs. AA: OR=0.62, 95%CI: 0.53-0.73, P< 0.001; AG+GG vs. AA: OR=0.64, 95%CI: 0.55-0.73, P< 0.001; GG vs. AG+AA, OR=0.75, 95%CI: 0.64-0.87, P< 0.001). However, no similar association was discovered in colorectal cancer and other cancers (breast cancer, lung cancer, ovarian cancer and esophagus cancer). Stratification by country (China and Japan), genotyping methods (TaqMan and other methods) or sample size (<1000 and ≥ 1000 subjects) all showed MUC1 rs4072037 polymorphism associated with an decreased cancer risk in all genetic models except recessive model.
Subgroup analysis of meta-analysis
| Comparisons | Heterogeneity test | Summary OR (95% CI) | Hypothesis test | Datasets | |||
|---|---|---|---|---|---|---|---|
| Q | P | I2(%) | Z | P | |||
| Ethnic | |||||||
| Asian | |||||||
| G vs A | 68.54 | 0 | 82.5 | 0.75(0.65,0.87) | 3.92 | 0 | 13 |
| AG vs AA | 67.31 | 0 | 82.2 | 0.72(0.61,0.85) | 3.9 | 0 | 13 |
| GG vs AA | 13.41 | 0.34 | 10.5 | 0.75(0.64,0.89) | 3.31 | 0.001 | 13 |
| AG+GG vs AA | 71.96 | 0 | 83.3 | 0.72(0.61,0.85) | 3.94 | 0 | 13 |
| GG vs AG+AA | 9.72 | 0.64 | 0 | 0.81(0.69,0.96) | 2.48 | 0.013 | 13 |
| Caucasian | |||||||
| G vs A | 18.78 | 0.001 | 78.7 | 0.85(0.66,1.10) | 1.24 | 0.215 | 5 |
| AG vs AA | 15.24 | 0.004 | 73.7 | 0.68(0.47,1.01) | 1.92 | 0.054 | 5 |
| GG vs AA | 18.95 | 0.001 | 78.9 | 0.74(0.44,1.24) | 1.14 | 0.255 | 5 |
| AG+GG vs AA | 20 | 0.001 | 80 | 0.70(0.47,1.07) | 1.65 | 0.098 | 5 |
| GG vs AG+AA | 8 | 0.091 | 50 | 0.92(0.76,1.12) | 0.82 | 0.412 | 5 |
| Cancer type | |||||||
| Gastric cancer | |||||||
| G vs A | 33.71 | 0.001 | 64.4 | 0.70(0.63,0.78) | 6.39 | 0 | 13 |
| AG vs AA | 37.33 | 0 | 67.9 | 0.64(0.55,0.74) | 6.19 | 0 | 13 |
| GG vs AA | 15.47 | 0.217 | 22.4 | 0.62(0.53,0.73) | 5.76 | 0 | 13 |
| AG+GG vs AA | 41.29 | 0 | 70.9 | 0.64(0.55,0.73) | 6.2 | 0 | 13 |
| GG vs AG+AA | 7.81 | 0.8 | 0 | 0.75(0.64,0.87) | 3.68 | 0 | 13 |
| Colorectal cancer | |||||||
| G vs A | 4.39 | 0.036 | 77.2 | 0.97(0.63,1.47) | 0.17 | 0.867 | 2 |
| AG vs AA | 2.67 | 0.102 | 62.6 | 0.94(0.59,1.50) | 0.26 | 0.794 | 2 |
| GG vs AA | 2.02 | 0.155 | 50.6 | 1.07(0.54,2.12) | 0.19 | 0.846 | 2 |
| AG+GG vs AA | 3.74 | 0.053 | 73.2 | 0.96(0.57,1.62) | 0.16 | 0.874 | 2 |
| GG vs AG+AA | 1.12 | 0.29 | 10.8 | 1.12(0.77,1.63) | 0.61 | 0.542 | 2 |
| Other cancers | |||||||
| G vs A | 1.46 | 0.691 | 0 | 1.04(0.96,1.13) | 0.91 | 0.364 | 4 |
| AG vs AA | 6.37 | 0.095 | 52.9 | 0.95(0.78,1.16) | 0.53 | 0.599 | 4 |
| GG vs AA | 0.51 | 0.917 | 0 | 1.03(0.84,1.26) | 0.24 | 0.809 | 4 |
| AG+GG vs AA | 4.13 | 0.248 | 27.3 | 1.03(0.92,1.14) | 0.48 | 0.631 | 4 |
| GG vs AG+AA | 0.97 | 0.808 | 0 | 1.12(0.93,1.34) | 1.18 | 0.24 | 4 |
| Country | |||||||
| China | |||||||
| G vs A | 44.47 | 0 | 84.3 | 0.80(0.66,0.96) | 2.34 | 0.019 | 8 |
| AG vs AA | 42.9 | 0 | 83.5 | 0.76(0.61,0.95) | 2.38 | 0.018 | 8 |
| GG vs AA | 10.93 | 0.142 | 36 | 0.80(0.65,0.98) | 2.14 | 0.032 | 8 |
| AG+GG vs AA | 46.14 | 0 | 84.8 | 0.76(0.61,0.95) | 2.38 | 0.018 | 8 |
| GG vs AG+AA | 8.27 | 0.31 | 15.3 | 0.85(0.69,1.04) | 1.57 | 0.117 | 8 |
| Japan | |||||||
| G vs A | 6.29 | 0.043 | 68.2 | 0.68(0.52,0.91) | 2.66 | 0.008 | 3 |
| AG vs AA | 7.4 | 0.025 | 73 | 0.65(0.45,0.93) | 2.37 | 0.018 | 3 |
| GG vs AA | 0.26 | 0.877 | 0 | 0.60(0.39,0.94) | 2.26 | 0.024 | 3 |
| AG+GG vs AA | 7.14 | 0.028 | 72 | 0.65(0.46,0.91) | 2.53 | 0.011 | 3 |
| GG vs AG+AA | 0.1 | 0.95 | 0 | 0.68(0.44,1.06) | 1.72 | 0.085 | 3 |
| Other countries | |||||||
| G vs A | 32.41 | 0 | 78.4 | 0.82(0.70,0.97) | 2.29 | 0.022 | 8 |
| AG vs AA | 26.11 | 0 | 73.2 | 0.70(0.56,0.87) | 3.15 | 0.002 | 8 |
| GG vs AA | 22.63 | 0.002 | 69.1 | 0.76(0.56,1.04) | 1.69 | 0.091 | 8 |
| AG+GG vs AA | 31.78 | 0 | 78 | 0.71(0.56,0.90) | 2.86 | 0.004 | 8 |
| GG vs AG+AA | 10.66 | 0.154 | 34.3 | 0.96(0.83,1.10) | 0.59 | 0.552 | 8 |
| Genotyping method | |||||||
| TaqMan | |||||||
| G vs A | 82 | 0 | 84.1 | 0.79(0.69,0.91) | 3.37 | 0.001 | 14 |
| AG vs AA | 70.34 | 0 | 81.5 | 0.72(0.61,0.85) | 3.97 | 0 | 14 |
| GG vs AA | 28.35 | 0.008 | 54.1 | 0.78(0.63,0.97) | 2.27 | 0.023 | 14 |
| AG+GG vs AA | 79.16 | 0 | 83.6 | 0.73(0.62,0.86) | 3.8 | 0 | 14 |
| GG vs AG+AA | 18.87 | 0.127 | 31.1 | 0.93(0.82,1.05) | 1.19 | 0.233 | 14 |
| Other methods | |||||||
| G vs A | 8.4 | 0.078 | 52.4 | 0.77(0.64,0.93) | 2.73 | 0.006 | 5 |
| AG vs AA | 11.64 | 0.02 | 65.6 | 0.71(0.53,0.95) | 2.34 | 0.019 | 5 |
| GG vs AA | 4.47 | 0.346 | 10.5 | 0.63(0.46,0.85) | 3.04 | 0.002 | 5 |
| AG+GG vs AA | 12.33 | 0.015 | 67.6 | 0.71(0.53,0.94) | 2.38 | 0.017 | 5 |
| GG vs AG+AA | 1.32 | 0.857 | 0 | 0.78(0.59,1.03) | 1.77 | 0.077 | 5 |
| Sample size | |||||||
| <1000 | |||||||
| G vs A | 42.21 | 0 | 73.9 | 0.78(0.66,0.92) | 2.92 | 0.004 | 12 |
| AG vs AA | 34.14 | 0 | 67.8 | 0.70(0.57,0.85) | 3.48 | 0.001 | 12 |
| GG vs AA | 24.33 | 0.011 | 54.8 | 0.71(0.52,0.96) | 2.23 | 0.026 | 12 |
| AG+GG vs AA | 39.97 | 0 | 72.5 | 0.70(0.57,0.87) | 3.29 | 0.001 | 12 |
| GG vs AG+AA | 13.57 | 0.258 | 18.9 | 0.87(0.74,1.03) | 1.61 | 0.107 | 12 |
| ≥1000 | |||||||
| G vs A | 47.49 | 0 | 87.4 | 0.80(0.68,0.95) | 2.62 | 0.009 | 7 |
| AG vs AA | 43.27 | 0 | 86.1 | 0.75(0.61,0.91) | 2.93 | 0.003 | 7 |
| GG vs AA | 8.96 | 0.176 | 33.1 | 0.84(0.72,0.99) | 2.14 | 0.032 | 7 |
| AG+GG vs AA | 46.84 | 0 | 87.2 | 0.76(0.62,0.92) | 2.83 | 0.005 | 7 |
| GG vs AG+AA | 7.72 | 0.26 | 22.2 | 0.93(0.80,1.08) | 0.99 | 0.323 | 7 |
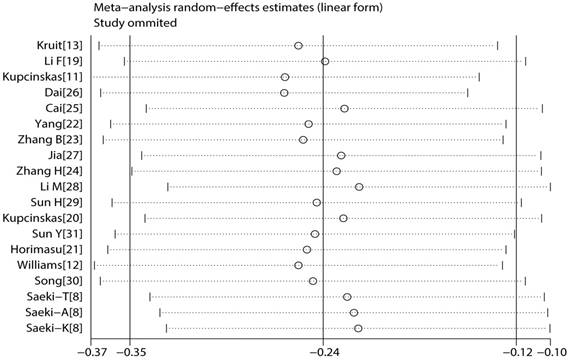
Sensitivity analysis
To reflect the effect of single study on the pooled ORs, we conducted sensitivity analysis by excising each study. Because the corresponding pooled ORs did not materially altered, the meta results were statistically robust (Figure 6).
Result of sensitivity analysis.
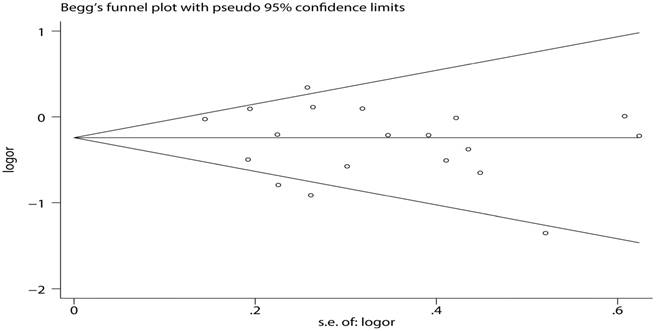
Publication bias
To determine the publication bias of studies, Begg's funnel plot and Egger's test were implemented. The results showed that the figure of the funnel was meristic under the dominant model (Figure 7). In addition, the results of Egger's test quantitatively convinced there was no publication bias in these studies (Table 4).
Begg's funnel plot of MUC1 rs4072037 polymorphism and cancer risk for homozygous genetic model (GG vs. AA)
Publication bias of meta-analysis for Egger's test
| Model | T-value | P-value | 95% CI of intercept value |
|---|---|---|---|
| G vs A | -1.33 | 0.202 | (-4.614735,1.053355) |
| AG vs AA | -1.63 | 0.121 | (-4.139911,0.5275983) |
| GG vs AA | -0.97 | 0.345 | (-2.638502,0.9741915) |
| AG+GG vs AA | -1.47 | 0.159 | (-4.310014,0.7678419) |
| GG vs AG+AA | -1.52 | 0.147 | (-2.141581,0.3494686) |
Discussion
Meta-analysis is a crucial statistical technique which has more statistical power than a single study. It can quantitatively combine analyses from different studies. Because of the association between cancer risk and MUC1 rs4072037 polymorphism are conflicted, we performed this meta-analysis to solve the problem. In our meta-analysis, we found the G allele locus on rs4072037 was associated with significantly decreased cancer risk. Subgroup analysis by cancer type indicated that G allele was associated with decreased gastric cancer risk, but not colorectal cancer or other cancers (breast cancer, lung cancer, ovarian cancer and esophagus cancer). We performed subgroup analysis by ethnicity and found G allele was associated with decreased cancer risk among Asian but not Caucasian. The consequences was not changed when stratification by country, genotyping methods or sample size. The MUC1 gene is used to encode membrane-bound glycosylated phosphorprotein and it is a member of the mucin family. There were several studies focus on the relationship between MUC1 rs4072037 polymorphism and the risk of cancer. However, Zheng et al. [32] Giraldi et al.[33] and Liu et al. [34] included fewer studies and only focused on the relationship of the gastric cancer and MUC1 rs4072037 polymorphism. Duan et al.[35] covered only 3 types of cancer, including 8 researches on cancer of stomach and one each on breast cancer and colorectal cancer. Comparing with these meta-analyses, our meta-analysis has involved more studies, which 12551 cases and 13436 controls were involved. In addition, the result of Duan et al showed MUC1 rs4072037 polymorphism was associated with decreased cancer risk in recessive model, but the result of our meta-analysis showed they have no association (OR=0.90, 95%CI: 0.81-1.01, P=0.07). In the subgroup analysis, Duan et al found a decreased association between MUC1 rs4072037 polymorphism and cancer risk in allelic model, heterozygote model and dominant model among Caucasian. However, the result of our meta-analysis showed they have no association among Caucasian under all genetic model.
When we interpreted the results of meta-analyses, there was possibly heterogeneity. It is an important goal to discover the provenience of heterogeneity in meta-analysis [36]. To assess the heterogeneity, the I2 statistic was used. We found the results of our meta-analysis showed significant heterogeneity in allelic, co-dominant and dominant models. To discover the provenience of heterogeneity, we performed subgroup analysis, meta regression and sensitivity analysis. In the subgroup analysis, we discovered type of cancer may be a source of heterogeneity. Then we conducted sensitivity analysis in GC group. When we took out the Song et al [30] and Zhang B et al [23], the I2 statistic was significantly decreased (Table 5).
The main result of removing Song et al and Zhang B et al.
| Comparisons | Heterogeneity test | Summary OR (95% CI) | Hypothesis test | Datasets | |||
|---|---|---|---|---|---|---|---|
| Q | P | I2(%) | Z | P | |||
| G vs A | 18.04 | 0.054 | 44.6 | 0.67(0.63,0.72) | 11.37 | 0 | 11 |
| AG vs AA | 18.31 | 0.05 | 45.4 | 0.61(0.56,0.66) | 11.29 | 0 | 11 |
| GG vs AA | 12.28 | 0.267 | 18.6 | 0.58(0.48,0.69) | 5.91 | 0 | 11 |
| AG+GG vs AA | 21.05 | 0.021 | 52.5 | 0.59(0.52,0.67) | 7.81 | 0 | 11 |
| GG vs AG+AA | 7.03 | 0.723 | 0 | 0.73(0.62,0.86) | 3.69 | 0 | 11 |
There were still some limits in our meta-analysis. Firstly, publication bias might exist because we just included published studies. Secondly, we knew diet, smoking and other environmental risk might be factors for cancer. However, because of limited information, we cannot explore the associations between these factors and cancers. Last but not least, the heterogeneity of our meta-analysis in some models is high. Though we found the source of heterogeneity, we thought there might be others.
In summary, our meta-analysis found MUC1 rs4072037 polymorphism was associated with lower cancer risk, particularly in gastric cancer and Asians. It might be used as a tumor marker.
Competing Interests
The authors have declared that no competing interest exists.
References
1. Torre LA, Bray F, Siegel RL, Ferlay J, Lortet-Tieulent J, Jemal A. Global cancer statistics, 2012. CA Cancer J Clin. 2015;65(2):87-108
2. Van Cutsem E, Sagaert X, Topal B, Haustermans K, Prenen H. Gastric cancer. LANCET. 2016;388:2654-2664
3. Ferlay J, Soerjomataram I, Dikshit R, Eser S, Mathers C, Rebelo M, Donald Maxwell Parkin DFAF. Cancer incidence and mortality worldwide: Sources, methods and major patterns in GLOBOCAN 2012. INT J CANCER. 2015;136:E359-E386
4. Sauer R, Becker H, Hohenberger W, Rödel C, Wittekind C, Fietkau R, Martus P, Tschmelitsch J, Hager E, Hess CF, Karstens J, Liersch T, Schmidberger H, Raab GRCS. Preoperative versus Postoperative Chemoradiotherapy for Rectal Cancer. THE NEW ENGLAND JOURNAL of MEDICINE. 2004;351:1731-1740
5. Hansen TF, Jakobsen A. Clinical implications of genetic variations in the VEGF system in relation to colorectal cancer. PHARMACOGENOMICS. 2011;12(12):1681-1693
6. Dworak O, Keilholz L, Hoffmann A. Pathological features of rectal cancer after preoperative radiochemotherapy. Int J Colorect Dis. 1997;12:19-23
7. Abnet CC, Freedman ND, Hu N, Wang Z, Yu K, Shu X, Yuan J, Zheng W, Dawsey SM, Dong LM, Lee MP, Ding T, Qiao Y, Gao Y, Koh W, Xiang Y. et al. A shared susceptibility locus in PLCE1 at 10q23 for gastric adenocarcinoma and esophageal squamous cell carcinoma. NAT GENET. 2010;42(9):764-767
8. Saeki N, Saito A, Choi IJ, Matsuo K, Ohnami S, Totsuka H, Chiku S, Kuchiba A, Lee YS, Yoon KA. A Functional Single Nucleotide Polymorphism in Mucin 1, at Chromosome 1q22, Determines Susceptibility to Diffuse-Type Gastric Cancer. GASTROENTEROLOGY. 2011;140(3):892-902
9. Hattrup CL, Gendler SJ. Structure and function of the cell surface (tethered) mucins. ANNU REV PHYSIOL. 2008;70:431-457
10. Ligtenberg MJ, Gennissen AM, Vos HL, Hilkens J. A single nucleotide polymorphism in an exon dictates allele dependent differential splicing of episialin mRNA. NUCLEIC ACIDS RES. 1991;19:297-301
11. Kupcinskas J, Gyvyte U, Bruzaite I, Leja M, Kupcinskaite-Noreikiene R, Pauzas H, Tamelis A, Jonaitis L, Skieceviciene J, Kiudelis G. Common Genetic Variants of PSCA, MUC1 and PLCE1 Genes are not Associated with Colorectal Cancer. Asian Pacific Journal of Cancer Prevention. 2015;16(14):6027-6032
12. Williams KA, Terry KL, Tworoger SS, Vitonis AF, Titus LJ, Cramer DW. Polymorphisms of MUC16 (CA125) and MUC1 (CA15.3) in relation to ovarian cancer risk and survival. PLOS ONE. 2014;9(2):e88334
13. Kruit A, Tilanus-Linthorst MM, Boonstra JG, van Schaik RH, Grutters JC, van den Bosch JMM, Ruven HJT. MUC1 568 A/G genotype-dependent cancer antigen 15-3 levels in breast cancer patients. CLIN BIOCHEM. 2009;42:662-665
14. DerSimonian R, Laird N. Meta-analysis in clinical trials. Controlled Clinical Trial. 1986;7:177-188
15. MANTEL N, HAENSZEL W. Statistical aspects of the analysis of data from retrospective studies of disease. J Natl Cancer Inst. 1959;22(4):719-748
16. Egger M, Davey SG, Schneider M, Minder C. Bias in meta-analysis detected by a simple, graphical test. BMJ. 1997;315(7109):629-634
17. Palmer AJ, Lochhead P, Hold GL, Rabkin CS, Chow W, Lissowska J, Vaughan TL, Berry S, Gammon M, Risch H, El-Omar EM. Genetic variation in C20orf54, PLCE1 and MUC1 and the risk of upper gastrointestinal cancers in Caucasian populations. EUR J CANCER PREV. 2012;21(6):541-544
18. Qiu L, Hua R, Cheng L, He J, Wang M, Zhou F, Zhu X, Sun M, Zhou X, Li J, Wang Y, Yang Y, Wang J, Jin L, Guo W, Wei Q. Genetic variant rs4072037 of MUC1 and gastric cancer risk in an Eastern Chinese population. ONCOTARGET. 2016;7(13):15930-15936
19. Li FX, Yang XX, He XQ, Hu NY, Wu YS, Li M. Association of 10q23 with colorectal cancer in a Chinese population. MOL BIOL REP. 2012;39(10):9557-9562
20. KUPCINSKAS J, WEX T, LINK A, BARTUSEVICIUTE R, DEDELAITE M, KEVALAITE G, LEJA M, SKIECEVICIENE J, KIUDELIS G, JONAITIS L, KUPCINSKAS L, MALFERTHEINER P. PSCA and MUC1 Gene Polymorphisms Are Linked with Gastric Cancer and Pre-malignant Gastric Conditions. ANTICANCER RES. 2014(34):7167-7176
21. Horimasu Y, Ishikawa N, Tanaka S, Hirano C, Iwamoto H, Ohshimo S, Fujitaka K, Hamada H, Hattori N, Kohno N. MUC1 in lung adenocarcinoma: cross-sectional genetic and serological study. BMC CANCER. 2017;17(1):263
22. Yang X, Li F, Zhou C, Hu N, Wu Y, Li M. Association of Genetic Polymorphisms at 1q22 but not 10q23 with Gastric Cancer in a Southern Chinese Population. Asian Pacific Journal of Cancer Prevention. 2012;13(6):2519-2522
23. Zhang B, Hao G, Gao F, Zhang J, Zhou C, Zhou L, Wang Y, Jia Y. Lack of Association of Common Polymorphisms in MUC1 Gene with H. pylori Infection and Non-cardia Gastric Cancer Risk in a Chinese Population. Asian Pacific Journal of Cancer Prevention. 2013;14(12):7355-7358
24. Zhang H, Jin G, Li H, Ren C, Ding Y, Zhang Q, Deng B, Wang J, Hu Z, Xu Y, Shen H. Genetic variants at 1q22 and 10q23 reproducibly associated with gastric cancer susceptibility in a Chinese population. CARCINOGENESIS. 2011;32(6):848-852
25. Cai M, Dai S, Chen W, Xia C, Lu L, Dai S, Qi J, Wang M, Wang M, Zhou L, Lei F, Zuo T, Zeng H, Zhao X. Environmental factors, seven GWAS-identified susceptibility loci, and risk of gastric cancer and its precursors in a Chinese population. CANCER MED-US. 2017;6(3):708-720
26. Dai N, Zheng M, Wang C, Ji Y, Du J, Zhu C, He Y, Zhu M, Zhu X, Sun M, Dai J, Ma H, Chen J, Hu Z, Gu H, Jin G. et al. Genetic variants at 8q24 are associated with risk of esophageal squamous cell carcinoma in a Chinese population. CANCER SCI. 2014;105(6):731-735
27. Jia Y, Persson C, Hou L, Zheng Z, Yeager M, Lissowska J, Chanock SJ, Chow W, Ye W. A comprehensive analysis of common genetic variation in MUC1, MUC5AC, MUC6 genes and risk of stomach cancer. CANCER CAUSE CONTROL. 2010;21(2):313-321
28. Li M, Huang L, Qiu H, Fu Q, Li W, Yu Q, Sun L, Zhang L, Hu G, Hu J, Yuan X. Helicobacter pylori infection synergizes with three inflammation-related genetic variants in the GWASs to increase risk of gastric cancer in a Chinese population. PLOS ONE. 2013;8(9):e74976
29. Sun H, Wu X, Wu F, Li Y, Yu Z, Chen X, Chen Y, Yang W. Associations of Genetic Variants in the PSCA, MUC1 and PLCE1 Genes with Stomach Cancer Susceptibility in a Chinese Population. PLOS ONE. 2015;10(2):e117576
30. Song H, Kim HN, Kweon S, Choi J, Shim HJ, Cho SH, Chung IJ, Park Y, Kim SH, Choi Y, Joo KW, Shin M. Common genetic variants at 1q22 and 10q23 and gastric cancer susceptibility in a Korean population. TUMOR BIOL. 2014;35(4):3133-3137
31. Sun Y, Gu J, Ajani JA, Chang DW, Wu X, Stroehlein JR. Genetic and intermediate phenotypic susceptibility markers of gastric cancer in Hispanic Americans: A case-control study. CANCER-AM CANCER SOC. 2014;120(19):3040-3048
32. Zheng L, Zhu C, Gu J, Xi P, Du J, Jin G. Functional polymorphism rs4072037 in MUC1 gene contributes to the susceptibility to gastric cancer: evidence from pooled 6,580 cases and 10,324 controls. MOL BIOL REP. 2013;40(10):5791-5796
33. Giraldi L, Michelazzo MB, Arzani D, Persiani R, Pastorino R, Boccia S. MUC1, MUC5AC, and MUC6 polymorphisms, Helicobacter pylori infection, and gastric cancer. EUR J CANCER PREV. 2018:1
34. Liu X, Wang Z, Zhang X, Chang J, Tang W, Gan L, Wu Z, Li J. MUC1 gene polymorphism rs4072037 and susceptibility to gastric cancer: a meta-analysis. SPRINGERPLUS. 2014;3:599
35. Duan F, Song C, Dai L, Cui S, Zhang X, Zhao X. The effect of MUC1 rs4072037 functional polymorphism on cancer susceptibility: evidence from published studies. PLOS ONE. 2014;9(4):e95651
36. Higgins JPT, Thompson SG, Deeks JJ, Altman DG. Measuring inconsistency in meta-analyses. bmj. 2003;327:557-560
Author contact
![]() Corresponding author: Qinghong Zhao, Department of General Surgery, The Second Affiliated Hospital of Nanjing Medical University, 121 Jiangjia Yuan Road, Nanjing 210011, Jiangsu, Chia. E-mail: njzhqhcom
Corresponding author: Qinghong Zhao, Department of General Surgery, The Second Affiliated Hospital of Nanjing Medical University, 121 Jiangjia Yuan Road, Nanjing 210011, Jiangsu, Chia. E-mail: njzhqhcom