Impact Factor ISSN: 1837-9664

 Global reach, higher impact
J Cancer 2018; 9(17):3156-3167. doi:10.7150/jca.25494 This issue Cite
Research Paper
Overall survival and cancer-specific survival in patients with surgically resected pancreatic head adenocarcinoma: A competing risk nomogram analysis
Chaobin He1*, Yu Zhang2*, Zhiyuan Cai1, Xiaojun Lin1 ![]() , Shengping Li1
, Shengping Li1 ![]()
1. Department of Hepatobiliary and Pancreatic Surgery, Sun Yat-sen University Cancer Center; State Key Laboratory of Oncology in South China; Collaborative Innovation Center for Cancer Medicine, Guangzhou 510060, China
2. State Key Laboratory of Ophthalmology, Zhongshan Ophthalmic Center, Sun Yat-sen University, Guangzhou, Guangdong, 510060, P.R. China
*These authors contributed equally to this work
Received 2018-2-11; Accepted 2018-6-24; Published 2018-8-6
Abstract
Background: The objective of this study was to estimate probabilities of overall survival (OS) and cancer-specific survival (CSS) in patients with pancreatic head adenocarcinoma after surgery. In addition, we attempted to build nomograms to predict prognosis of these patients.
Methods: Patients diagnosed with surgically resected pancreatic head adenocarcinoma between 2004 and 2014 were selected for the study from the Surveillance, Epidemiology, and End Results (SEER) database. Nomograms were established for estimating 1-, 2- and 3-year OS and CSS based on Cox regression model and Fine and Grey's model. The performance of the nomogram was measured by concordance index (C-index) and the area under receiver operating characteristic (ROC) curve (AUC).
Results: A total of 2374 patients were retrospectively collected from the SEER database. The discrimination of nomogram for OS prediction was superior to that of the Tumor-Node-Metastasis (TNM) 7th or 8th edition stage systems (C-index = 0.640, 95% CI, 0.618 - 0.662 vs 0.573, 95% CI, 0.554 - 0.593, P < 0.001; 0.640, 95% CI, 0.618 - 0.662 vs 0.596, 95% CI, 0.586 - 0.607, P < 0.001, respectively). The comparisons of values of AUC showed that the established nomograms displayed better discrimination power than TNM 7th or 8th stage systems for predicting both OS and CSS.
Conclusions: The nomograms which could predict 1-, 2- and 3-year OS and CSS were established in this study. Our nomograms showed a relatively good performance and could be served as an effective tool for prognostic evaluation of patients with pancreatic head adenocarcinoma after surgery.
Keywords: Pancreatic head adenocarcinoma, Nomogram, Competing risk analysis, Overall survival, Cancer-specific survival
Introduction
Pancreatic ductal adenocarcinoma (PDAC), one of the most common malignant neoplasms of the digestive system, is the fourth leading cause of cancer death in the developed countries [1]. In recent years, the mortality of PDAC has been increasing annually, and PDAC is expected to be the second leading cause of cancer death in 2030 [2]. Surgery is the only potential option for a curative treatment, but the overall five-year survival rate of all pancreatic cancer patients is 5% to 7%, with no notable changes in the death rate in recent decades [3]. Nearly 80% of all pancreatic adenocarcinomas occur in the head of the pancreas. The prognosis for pancreatic head adenocarcinomas remains poor, even after pancreaticoduodenectomy, with a median survival of 10 to 20 months [4]. It is known that personalized cancer treatment is based on a prognostic evaluation. The Tumor-Node-Metastasis (TNM) staging system of the American Joint Commission on Cancer (AJCC) 8th edition [5], which is commonly used for prognostic evaluation of PDAC, only takes tumor size and the presence of histological metastasis into account and does not incorporate many other important prognostic factors, such as age, gender or tumor differentiation. In addition, the TNM 8th edition is still inadequate for prognostic prediction. In this sense, the traditional TNM staging system still needs further validation and improvement. Therefore, development of a staging system that is technically feasible and easily clinically accessible to stratify the prognosis of patients with pancreatic head adenocarcinoma after surgery is urgently required.
In addition, there is a high risk of competing non-cancer events for patients with pancreatic head adenocarcinoma because many patients are older than 60 years and are faced with an associated high rate of comorbidities [6]. Furthermore, the risk of competing events in patients with cancers increases as age increases. In practice, for researchers interested in cancer-specific mortality, those other events compete with the event of interest. Failure to recognize or account for the presence of competing risks may result in misleading conclusions in clinical trials or epidemiological research [7]. Therefore, it is important to take these competing risks into account when evaluating prognosis. In this case, the Kaplan-Meier method adopted in many prognostic studies may be inaccurate because it treats competing events as independent censorings and overestimates the proportion of cancer-specific death. Instead, competing risks methods should be used since it considers the informative nature of the censoring and corresponds to the probability of occurrence of a particular event without the assumption of independence between event types [8, 9].
Competing risk methods have been adopted in many studies of cancers, such as nasopharyngeal carcinoma [10], breast cancer [11] and ovarian cancer [12]. However, to our knowledge, a competing risk analysis and nomogram for patients with pancreatic head adenocarcinoma after surgery on the basis of population-based data has not been reported. In the current work, competing risk analyses were conducted using the Surveillance, Epidemiology, and End Results (SEER) database, and competing risk nomograms were built to investigate the cancer-specific mortality of patients with pancreatic head adenocarcinoma after surgery.
Patients and methods
Patients
The SEER program of the National Cancer Institute provides data on cancer incidence and survival in the United States and covers 30% of the population. For this research, data of patients with surgically resected pancreatic head adenocarcinoma were extracted from the SEER database (2004-2014), using the SEER*Stat software version 8.3.4. The study cohort consisted of patients with the following International Classification of Diseases for Oncology, Third Edition (ICD-O-3), histology code: 8140/3; and the ICD-O-3 site code C25.0. The TNM 8th edition stage was calculated according to tumor size, 6th or 7th edition TNM stages [5]. The exclusion criteria were as follows: (1) patients with second primary cancer; (2) patients with missing or incomplete information about survival, follow-up months, cause of death or other characteristics; (3) age at diagnosis younger than 18 years; (4) patients not newly or pathologically diagnosed. Two thirds of all patients were randomly selected to form the training set to develop the nomogram, and the rest of patients served as a validation set. Institutional review board approval and informed consent were not required in the current study because SEER research data is publicly available and all patient data are de-identified. All authors have signed authorization and received permission from SEER to access and use the dataset.
Data collection
Demographic and clinical variables were extracted from the SEER database, including age at diagnosis, gender, tumor size, histological differentiation, TNM stage, follow-up information and cause of death. Age at diagnosis was divided into two groups (younger than 60 years old and 60 years or older). The lymph node (LN) ratio (LNR) was defined as the ratio of number of metastatic LNs relative to the total number of LN examined. The optimal cutoff value for LNR was determined using time-dependent receiver operating characteristic (ROC) curve analysis. The TNM 8th stage was used as the staging system.
Overall survival (OS) was defined as the duration from the date of diagnosis to death or last follow-up, with no restriction on the cause of death. Cancer-specific survival (CSS) was defined as the duration from the date of diagnosis until death due to pancreatic head adenocarcinoma other than other causes.
Statistical analysis
Continuous data were presented as the medians and ranges and compared using Student's t test. Categorical data were shown as frequencies and proportions and compared with chi-square test and Fisher's exact test. The univariate analysis and multivariate analysis were performed using the Cox regression model and the hazard ratio (HR) and the associated 95% confidence interval (CI) were calculated. The OS was analyzed using the Kaplan-Meier method. The log-rank test was used to compare the differences between groups. Cancer-specific mortality and non-cancer-specific mortality were regarded as two competing events. The combined effects of the variables on overall mortality and cancer-specific mortality were evaluated by proportional hazard analysis of Fine and Grey's model [13, 14]. A nomogram was developed based on the independent risk factors identified in the multivariate analysis. The performance of the nomogram was measured by concordance index (C-index) and assessed by calibration curves [15, 16]. The C-index reflected the probability that a randomly selected patient with a lower probability of survival predicted via the nomogram died earlier than another randomly selected patient with a higher predicted probability. A higher C-index indicates a better ability to separate patients with different survival outcomes. The calibration curves were used to compare the predicted probability with the observed probability in the study cohort. Bootstraps with 200 resamples were used for the development of the nomogram and calibration curve to reduce the overfit bias. Furthermore, the precision of the 1-, 2- and 3-year survival of the nomograms was evaluated and compared using the area under ROC curve (AUC). All statistical analyses were performed using SPSS version 22 (SPSS Inc., Chicago, IL, USA). MedCalc software version 11.4.2.0 (http://www.medcalc.be) was used to perform the survival comparisons. Competing risk analysis, nomogram and ROC curves were performed using R version 3.4.2 software (The R Foundation for Statistical Computing, Vienna, Austria. http://www.r-project.org). A two tailed P-value < 0.05 was considered statistically significant.
Results
Patient characteristics
A total of 2374 eligible patients with surgically resected pancreatic head adenocarcinoma from 2004 to 2014 in the SEER database were enrolled in this study. Baseline patient characteristics are shown in Table 1. Patients were similar with respect to all clinicopathological characteristics between the training set and validation set in this study. In the whole study cohort, the median age at diagnosis was 65 years (range: 29 - 91 years). Of these patients, 1228 (51.7%) were men. Moderate differentiation (1175; 49.5%) was the most common tumor grade, followed by poor differentiation (962; 40.5%) and well differentiation (237; 10.0%). Regarding tumor size, 2 - 4 cm (1405; 59.2%) was the most common, followed by ≥ 4 cm (608; 25.6%) and ≤ 2 cm (361; 15.2%). A total of 1610 (67.8%) patients had LN metastasis, while most of the patients (2257; 95.1%) were without metastasis. Most patients (976; 41.1%) were categorized as TNM stage II, 28.7% (681) were stage III and 25.2% (598) were stage I; stage IV only represented 5% (119) of patients. With the cutoff value of 0.119, LNR was associated with the optimal Youden index for OS and CSS prediction.
The comparison of clinicopathological factors between training set and validation set
| Characteristic | N | Patients | P | ||
|---|---|---|---|---|---|
| Training set | Validation set | ||||
| Total | 2374 | 1780 | 594 | ||
| Age (years) | < 60 | 676 | 5023 | 173 | 0.703 |
| ≥ 60 | 1698 | 1277 | 421 | ||
| Gender | Male | 1228 | 925 | 303 | 0.705 |
| Female | 1146 | 855 | 291 | ||
| Tumor size (cm) | ≤ 2 | 361 | 267 | 94 | 0.875 |
| 2 ~ 4 | 1405 | 1057 | 348 | ||
| ≥ 4 | 608 | 453 | 155 | ||
| Differentiation | Well | 237 | 174 | 63 | 0.832 |
| Moderate | 1175 | 881 | 294 | ||
| Poor | 962 | 712 | 250 | ||
| AJCC T stage (8th) | I | 352 | 263 | 89 | 0.469 |
| II | 1316 | 987 | 329 | ||
| III | 554 | 410 | 144 | ||
| IV | 152 | 122 | 30 | ||
| LN metastasis (8th) | Absent | 764 | 593 | 171 | 0.090 |
| 1 ~ 3 LNs | 911 | 678 | 233 | ||
| ≥ 4 LNs | 699 | 509 | 190 | ||
| LN total number | LN = 0 | 156 | 120 | 36 | 0.391 |
| 1 ≤ LNs < 10 | 437 | 332 | 105 | ||
| 10 ≤ LNs < 20 | 983 | 748 | 235 | ||
| 20 ≤ LNs < 30 | 551 | 399 | 152 | ||
| 30 ≤ LNs < 50 | 213 | 158 | 55 | ||
| LNs ≥ 50 | 34 | 22 | 12 | ||
| Metastasis | Absent | 2257 | 1694 | 563 | 0.444 |
| Present | 117 | 84 | 33 | ||
LN, lymph node
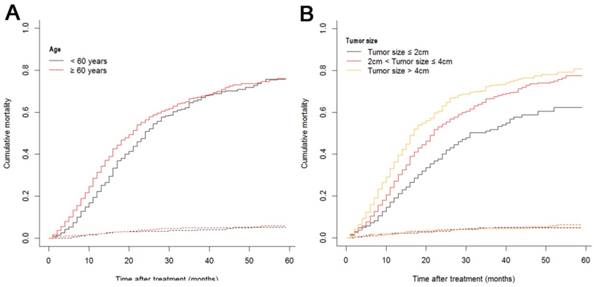
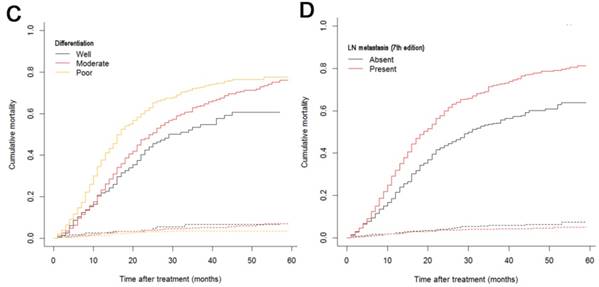
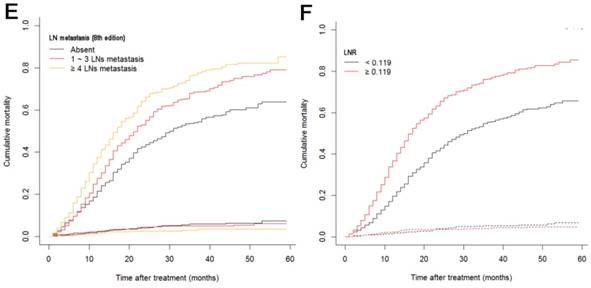
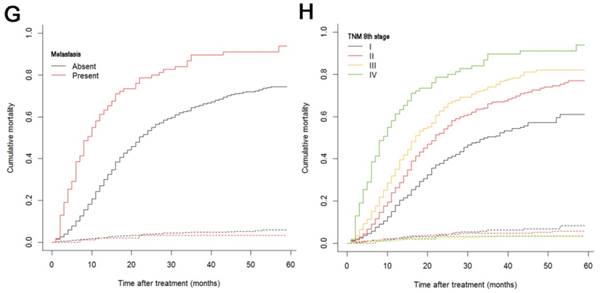
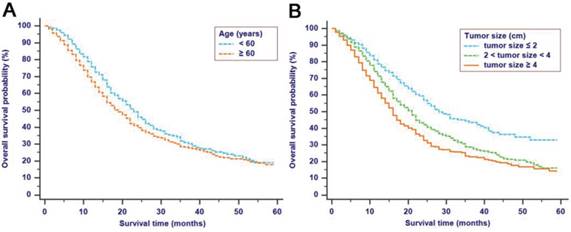
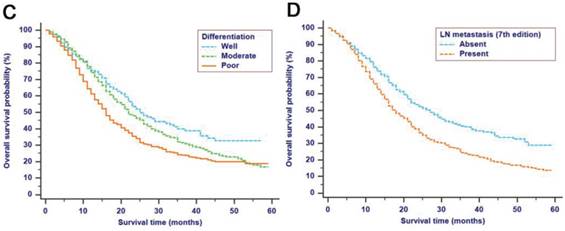
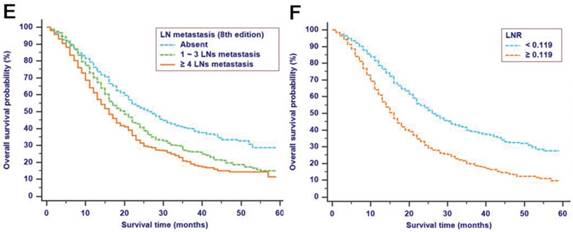
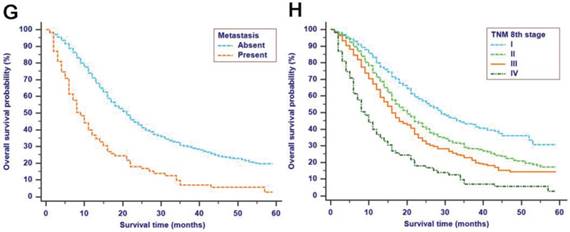
The median follow-up time was 14 months (range: 1-59 months). In total, 1321/2374 (55.6%) patients died, with 1233 cancer-specific deaths and 88 non-cancer-specific deaths were observed, respectively. With regard to non-cancer-specific death, the most common causes were heart diseases (30.4%) and chronic obstructive pulmonary disease (23.3%). The 1-, 2- and 3-year cancer-specific mortalities, non-cancer-specific mortalities and overall survival rates, which were stratified by age, gender, tumor size, differentiation, LN metastasis (7th edition), LN metastasis (8th edition), LNR, metastasis and TNM 8th stage, are summarized in Table 2. In the subgroup competing mortality analyses, the cancer-specific mortality rates were significantly higher in patients when they were accompanied with older ages (P = 0.007, Fig. 1A), enlarged tumors (P < 0.001, Fig. 1B), poor tumor differentiation (P < 0.001, Fig. 1C), presence of LN metastasis (P < 0.001, Fig. 1D), more metastatic LNs (P < 0.001, Fig. 1E), larger LNR values (P < 0.001, Fig. 1F), presence of metastasis (P < 0.001, Fig. 1G), and more advanced TNM stage (P < 0.001, Fig. 1H). Furthermore, there was no significant difference with regard to competing mortality in all the subgroup analyses (P > 0.05). In addition, the Kaplan-Meier curves showed that there were significant differences in OS rates when they were stratified by these characteristics. Patients who had enlarged tumor, LN metastasis, metastasis and an elevated TNM stage had poorer OS. In addition to these variables, age, LNR and tumor differentiation were all associated with OS in these patients (Fig. 2).
Overall survival rates and cumulative incidences of mortality among patients with surgically resected pancreatic head adenocarcinoma
| Characteristic | Patients | Overall survival rate (%) | P | Cancer-specific mortality (%) | P | Non-cancer-specific mortality (%) | P | ||||||||
|---|---|---|---|---|---|---|---|---|---|---|---|---|---|---|---|
| No. | % | 1-year | 2-year | 3-year | 1-year | 2-year | 3-year | 1-year | 2-year | 3-year | |||||
| Total | 2374 | 100 | |||||||||||||
| Age (years) | < 60 | 676 | 28.5 | 75.8 | 45.9 | 31.0 | 0.002 | 22.2 | 50.8 | 65.4 | 0.007 | 2.0 | 3.3 | 3.6 | 0.486 |
| ≥ 60 | 1698 | 71.5 | 66.7 | 39.8 | 28.2 | 31.3 | 56.4 | 66.7 | 2.0 | 3.9 | 5.0 | ||||
| Gender | Male | 1228 | 51.7 | 68.4 | 40.3 | 27.8 | 0.163 | 30.1 | 56.6 | 68.2 | 0.055 | 1.5 | 3.1 | 4.0 | 0.221 |
| Female | 1146 | 48.3 | 70.3 | 42.8 | 30.4 | 27.1 | 56.8 | 64.3 | 2.6 | 4.4 | 5.3 | ||||
| Tumor size (cm) | ≤ 2 | 361 | 15.2 | 78.7 | 56.9 | 43.6 | <0.001 | 19.0 | 40.0 | 51.7 | <0.001 | 2.2 | 3.1 | 4.8 | 0.513 |
| 2 ~ 4 | 1405 | 59.2 | 71.2 | 42.1 | 28.6 | 27.0 | 54.3 | 66.7 | 1.8 | 3.7 | 4.7 | ||||
| ≥ 4 | 608 | 25.6 | 61.2 | 32.8 | 22.8 | 36.4 | 63.2 | 72.9 | 2.4 | 4.0 | 4.3 | ||||
| Differentiation | Well | 237 | 10.0 | 75.5 | 52.1 | 38.7 | <0.001 | 21.9 | 44.0 | 53.4 | <0.001 | 2.6 | 3.9 | 6.6 | 0.168 |
| Moderate | 1175 | 49.5 | 74.2 | 46.4 | 31.0 | 23.3 | 49.8 | 63.4 | 2.4 | 3.8 | 4.9 | ||||
| Poor | 962 | 40.5 | 61.2 | 34.0 | 23.7 | 37.7 | 62.9 | 72.5 | 1.1 | 3.1 | 3.5 | ||||
| LN metastasis (7th) | Absent | 764 | 32.2 | 76.2 | 52.4 | 40.2 | <0.001 | 21.4 | 43.6 | 53.9 | <0.001 | 2.3 | 4.0 | 5.8 | 0.171 |
| Present | 1610 | 67.8 | 66.2 | 36.5 | 23.9 | 31.9 | 59.9 | 72.0 | 1.9 | 3.6 | 4.1 | ||||
| LN metastasis (8th) | Absent | 764 | 32.2 | 76.1 | 52.3 | 40.2 | <0.001 | 21.5 | 43.6 | 54.0 | <0.001 | 2.3 | 4.0 | 5.8 | 0.108 |
| 1 ~ 3 LNs | 911 | 38.4 | 70.1 | 40.5 | 26.6 | 27.7 | 55.1 | 68.5 | 2.2 | 4.3 | 4.9 | ||||
| ≥ 4 LNs | 699 | 29.4 | 61.1 | 31.3 | 20.4 | 37.4 | 66.1 | 76.7 | 1.4 | 2.6 | 3.0 | ||||
| LNR | < 0.119 | 1242 | 52.3 | 78.6 | 53.3 | 39.2 | <0.001 | 19.7 | 42.9 | 55.5 | <0.001 | 1.7 | 3.8 | 5.3 | 0.488 |
| ≥ 0.119 | 1132 | 47.7 | 61.0 | 30.9 | 19.6 | 36.7 | 65.5 | 76.3 | 2.3 | 3.7 | 4.1 | ||||
| Metastasis | Absent | 2257 | 95.1 | 71.0 | 42.7 | 30.3 | <0.001 | 27.0 | 53.5 | 65.0 | <0.001 | 2.0 | 3.7 | 4.7 | 0.392 |
| Present | 117 | 4.9 | 36.8 | 16.7 | 7.0 | 61.1 | 78.7 | 89.8 | 2.0 | 3.3 | 3.3 | ||||
| TNM 8th stage | I | 598 | 25.2 | 79.7 | 56.9 | 43.4 | <0.001 | 18.0 | 39.3 | 50.4 | <0.001 | 2.3 | 3.8 | 6.2 | 0.149 |
| II | 976 | 41.1 | 71.3 | 41.6 | 29.2 | 26.3 | 54.3 | 66.8 | 2.4 | 4.2 | 4.7 | ||||
| III | 681 | 28.7 | 63.8 | 32.9 | 22.8 | 35.0 | 64.5 | 74.2 | 1.2 | 2.6 | 3.0 | ||||
| IV | 119 | 5.0 | 36.8 | 16.7 | 7.0 | 61.2 | 78.7 | 89.8 | 2.0 | 3.3 | 3.3 | ||||
LN, lymph node; LNR, lymph node ratio; TNM, Tumor-Node-Metastasis.
Cumulative cancer-specific and competing mortality curves stratified by patient characteristics: (A) Age; (B) Tumor size; (C) Differentiation; (D) LN metastasis (7th edition); (E) LN metastasis (8th edition); (F) LNR; (G) Metastasis; (H) TNM 8th stage. Abbreviations: LN, lymph node; LNR, lymph node ratio; TNM, Tumor-Node-Metastasis.
Kaplan-Meier OS curves stratified by patient characteristics: (A) Age; (B) Tumor size; (C) Differentiation; (D) LN metastasis (7th edition); (E) LN metastasis (8th edition); (F) LNR; (G) Metastasis; (H) TNM 8th stage. Abbreviations: OS, overall survival; LN, lymph node; LNR, lymph node ratio; TNM, Tumor-Node-Metastasis.
Univariate and multivariate analyses of effects of factors on OS and CSS
The median OS time was 20 months (95% CI, 19 - 20 months), and the 1-year, 2-year and 3-year OS rates were 69.3%, 41.5% and 29.1%, respectively. In the univariate analysis, age (HR = 1.207, 95% CI, 1.068 - 1.364, P = 0.003), tumor diameter (HR = 1.342, 95% CI, 1.230-1.464, P < 0.001), tumor differentiation (HR = 1.306, 95% CI, 1.190 - 1.433, P < 0.001), LNR (HR = 1.843, 95% CI, 1.645 - 2.065, P < 0.001), LN metastasis 7th edition (HR = 1.520, 95% CI, 1.345 - 1.718, P < 0.001), LN metastasis 8th edition (HR = 1.312, 95% CI, 1.224 - 1.407, P < 0.001), bone metastasis (HR = 2.616, 95% CI, 1.086 - 6.298, P = 0.032), liver metastasis (HR = 2.532, 95% CI, 1.902 - 3.370, P < 0.001), lung metastasis (HR = 2.657, 95% CI, 1.504 - 4.694, P = 0.001) and metastasis (HR = 2.448, 95% CI, 1.982 - 3.024, P < 0.001) were significantly associated with OS, while gender was not significantly related to OS (P > 0.05). In addition, for the included patients, it was shown that age, differentiation, LNR, LN metastasis 7th edition, LN metastasis 8th edition, metastasis, bone metastasis, liver metastasis, lung metastasis and tumor size were validated to have significance for CSS according to the results of the univariate competing risk analysis (Table 3).
Univariate and multivariate analyses of survival in patients with surgically resected pancreatic head adenocarcinoma
| Characteristic | Overall survival | Cancer-specific survival | |||||||||||
|---|---|---|---|---|---|---|---|---|---|---|---|---|---|
| Univariate analysis | Multivariate analysis | Univariate analysis | Multivariate analysis | ||||||||||
| HR | 95%CI | P | HR | 95%CI | P | HR | 95%CI | P | HR | 95%CI | P | ||
| Age (years) | < 60 / ≥ 60 | 1.207 | 1.068-1.364 | 0.003 | 1.217 | 1.061-1.397 | 0.005 | 1.208 | 1.065-1.371 | 0.003 | 1.208 | 1.048-1.393 | 0.009 |
| Gender | Male / Female | 0.927 | 0.832-1.033 | 0.171 | NI | 0.911 | 0.815-1.019 | 0.103 | NI | ||||
| Tumor size (cm) | ≤ 2 / 2 ~ 4 / ≥ 4 | 1.342 | 1.230-1.464 | <0.001 | 1.210 | 1.099-1.333 | <0.001 | 1.355 | 1.239-1.483 | <0.001 | 1.215 | 1.100-1.343 | <0.001 |
| Differentiation | Well / Moderate / Poor | 1.306 | 1.190-1.433 | <0.001 | 1.274 | 1.158-1.403 | <0.001 | 1.336 | 1.213-1.471 | <0.001 | 1.304 | 1.180-1.441 | <0.001 |
| LN metastasis | Absent / Present | 1.520 | 1.345-1.718 | <0.001 | 1.224 | 0.957-1.566 | 0.108 | 1.570 | 1.381-1.784 | <0.001 | 1.256 | 0.972-1.622 | 0.081 |
| LN metastasis | Absent / 1 ~ 3 / ≥ 4 LN metastasis | 1.312 | 1.224-1.407 | <0.001 | 0.963 | 0.826-1.124 | 0.634 | 1.339 | 1.246-1.439 | <0.001 | 0.980 | 0.836-1.148 | 0.799 |
| LNR | < 0.119 / ≥ 0.119 | 1.843 | 1.645-2.065 | <0.001 | 1.597 | 1.340-1.903 | <0.001 | 1.888 | 1.678-2.125 | <0.001 | 1.577 | 1.316-1.890 | <0.001 |
| Bone metastasis | Absent / Present | 2.616 | 1.086-6.298 | 0.032 | 1.044 | 0.355-3.070 | 0.937 | 3.704 | 1.386-9.897 | 0.009 | 1.114 | 0.329-3.775 | 0.862 |
| Liver metastasis | Absent / Present | 2.532 | 1.902-3.370 | <0.001 | 1.150 | 0.637-2.076 | 0.643 | 2.631 | 1.970-3.513 | <0.001 | 1.201 | 0.657-2.198 | 0.552 |
| Lung metastasis | Absent / Present | 2.657 | 1.504-4.694 | <0.001 | 0.708 | 0.306-1.636 | 0.419 | 2.757 | 1.560-4.871 | <0.001 | 0.726 | 0.313-1.683 | 0.456 |
| Metastasis | Absent / Present | 2.448 | 1.982-3.024 | <0.001 | 2.110 | 1.340-3.323 | 0.001 | 2.552 | 2.058-3.165 | <0.001 | 2.106 | 1.322-3.355 | 0.002 |
HR, hazard ratio; CI, confidence interval; NI, not included.
Variables that were significantly associated with OS and CSS in the univariate analyses were included in the multivariate analyses performed to delineate various prognostic indicators (Table 3). After adjusting for other risk factors, the multivariate analysis showed that age (HR = 1.217, 95% CI, 1.061 - 1.397, P = 0.005), tumor diameter (HR = 1.210, 95% CI, 1.099 - 1.333, P < 0.001), tumor differentiation (HR = 1.274, 95% CI, 1.158 - 1.403, P < 0.001), LNR (HR=1.597, 95% CI, 1.340 - 1.903, P < 0.001) and metastasis (HR = 2.110, 95% CI, 1.340 - 3.323, P < 0.001) all remained independently associated with OS. Moreover, these variables were also independent predictive factors for CSS. Older age (HR = 1.208, 95% CI, 1.048 - 1.393, P = 0.009), enlarged tumors (HR = 1.215, 95% CI, 1.100 - 1.343, P < 0.001), poorer tumor differentiation (HR = 1.304, 95% CI, 1.180 - 1.441, P < 0.001), higher LNR values levels (HR = 1.577, 95% CI, 1.316 - 1.890, P < 0.001) and presence of metastasis (HR = 2.106, 95% CI, 1.322 - 3.355, P = 0.002) were more likely to contribute to cancer-specific mortality.
Construction and validation of nomograms for OS and CSS
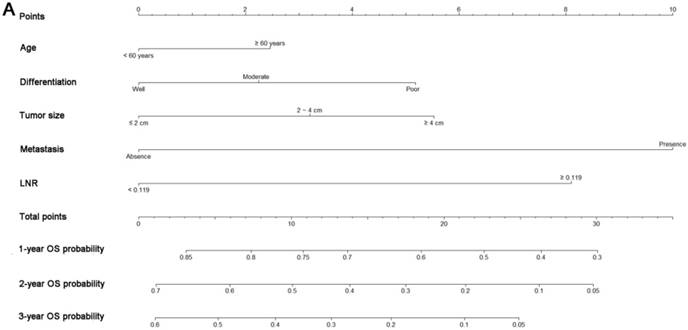
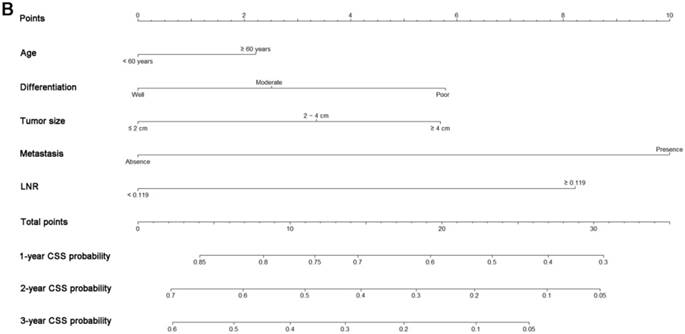
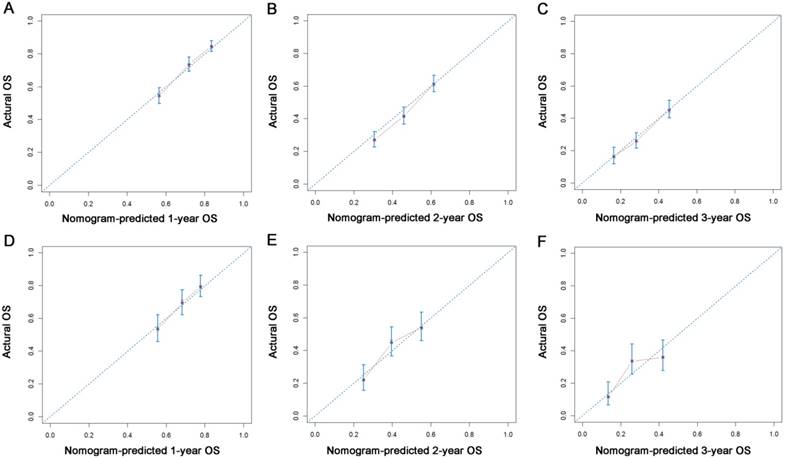
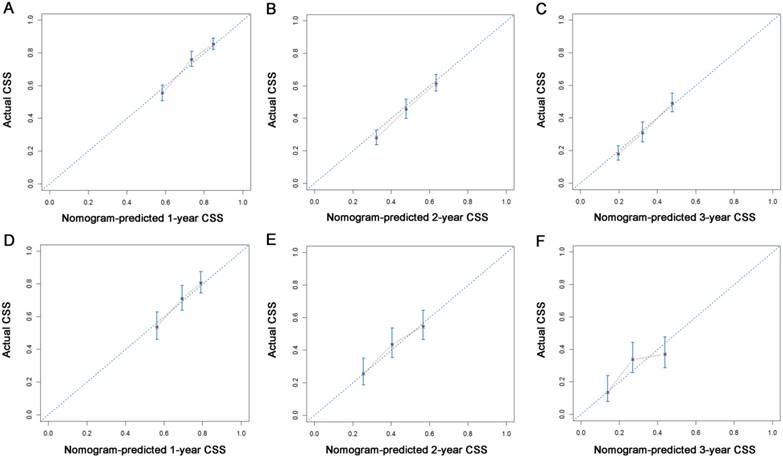
All the independent predictors of OS and CSS in the whole study cohort were integrated into the nomogram. Fig. 3 illustrates the predictive nomograms established for the 1-, 2-, and 3-year OS and CSS rates in the training set. A patient's probability of individual survival can easily be calculated by adding the scores for each selected variable. The nomogram demonstrated good accuracy for OS prediction, with a C-index of 0.64 (95% CI, 0.618 - 0.662). Calibration plots for the probabilities of 1-, 2-, and 3-year OS showed fair agreement between the nomogram-predicted survival and the actual survival in both the training and validation sets (Fig. 4). The nomogram for CSS prediction which was generated based on Fine and Grey's model, also showed good accuracy, with a C-index for the CSS prediction of 0.645 (95% CI, 0.622 - 0.668). Calibration plots for the probabilities of 1-, 2-, and 3-year CSS showed an optimal agreement between the prediction by the nomogram and the actual observed survival in both the training and validation sets (Fig. 5).
Nomograms predicting 1-, 2- and 3-year OS (A) and CSS (B) of patients with pancreatic head adenocarcinoma after surgery. Abbreviations: OS, overall survival; CSS, cancer-specific survival; LNR, lymph node ratio.
Calibration plots of the nomogram for 1-, 2- and 3-year OS prediction of the training set (A, B, C) and validation set (D, E, F). X-axis represents the nomogram-predicted probability of survival; Y-axis represents the actual OS probability. A perfectly accurate nomogram prediction model would result in a plot that the observed and predicted probabilities for given groups fall along the 45-degree line. Dots with bars represent nomogram-predicted probabilities along with 95% confidence interval.
Calibration plots of the nomogram for 1-, 2- and 3-year CSS prediction of the training set (A, B, C) and validation set (D, E, F). X-axis represents the nomogram-predicted probability of survival; Y-axis represents the actual CSS probability.
We compared the discriminatory accuracy of the nomograms with that of the 7th and 8th editions of the TNM staging systems in the training set. The nomogram discriminatory accuracy for OS prediction was superior to that of either the 7th or 8th edition TNM staging systems (C-index = 0.640, 95% CI, 0.618 - 0.662 vs 0.573, 95% CI, 0.554 - 0.593, P < 0.001; 0.640, 95% CI, 0.618 - 0.662 vs 0.596, 95% CI, 0.586 - 0.607, P < 0.001, respectively). Discriminatory accuracy of the nomogram for CSS prediction was also enhanced compared with both the 7th or 8th edition TNM staging systems in the training set (C-index = 0.645, 95% CI, 0.622 - 0.668 vs 0.576, 95% CI, 0.556 - 0.596, P < 0.001; 0.645, 95% CI, 0.622 - 0.668 vs 0.599, 95% CI, 0.577 - 0.621, P < 0.001, respectively). Furthermore, the nomograms established in this study also displayed more powerful efficiency of discrimination for both OS and CSS prediction in the validation set compared with either the 7th or 8th edition TNM staging system (Table 4).
C-indexes for the nomograms and TNM staging systems in patients with surgically resected pancreatic head adenocarcinoma
| Survival | All patients | P | Training set | P | Validation set | P | |
|---|---|---|---|---|---|---|---|
| Overall survival | Nomogram | 0.637(0.618-0.656) | Reference | 0.640(0.618-0.662) | Reference | 0.624(0.606-0.642) | Reference |
| TNM 7th stage | 0.571(0.554-0.588) | <0.001 | 0.573(0.554-0.593) | <0.001 | 0.564(0.533-0.595) | <0.001 | |
| TNM 8th stage | 0.589(0.580-0.598) | <0.001 | 0.596(0.586-0.607) | <0.001 | 0.566(0.548-0.584) | <0.001 | |
| Cancer-specific survival | Nomogram | 0.640(0.621-0.659) | Reference | 0.645(0.622-0.668) | Reference | 0.631(0.595-0.667) | Reference |
| TNM 7th stage | 0.575(0.558-0.592) | <0.001 | 0.576(0.556-0.596) | <0.001 | 0.576(0.540-0.612) | 0.001 | |
| TNM 8th stage | 0.594(0.575-0.613) | <0.001 | 0.599(0.577-0.621) | <0.001 | 0.571(0.540-0.602) | 0.001 |
Comparison of AUC values of the nomogram and 7th and 8th edition TNM staging systems
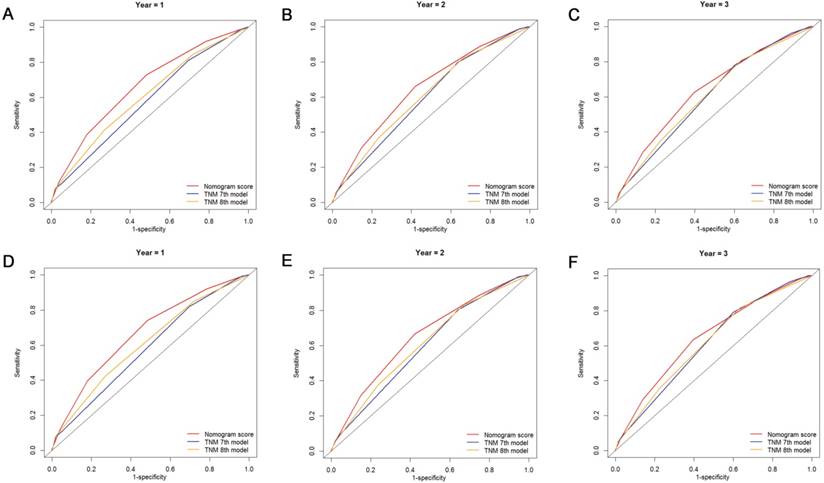
The discriminatory capacity of the nomogram and the 7th and 8th edition TNM staging systems was compared by analyzing the AUC values (Fig. 6). For the whole study cohort, the AUC values of the nomogram for predicting 1-, 2-, and 3-year OS rates were 0.663, 0.651 and 0.642, respectively, whereas the AUC values were 0.577, 0.598 and 0.607, respectively, for the TNM 7th edition staging system and were 0.605, 0.610 and 0.610, respectively, for the TNM 8th edition staging system. With regard to the prediction of the 1-, 2-, and 3-year CSS rates, the AUC values of the nomogram were 0.670, 0.651 and 0.646, respectively, while the AUC values of the 7th edition staging system were 0.582, 0.597, and 0.613, respectively, and the AUC values of the 8th edition staging system were 0.610, 0.610 and 0.616, respectively. It was shown that the nomogram had a superior discriminative capacity for predicting both OS and CSS compared with either the 7th or 8th edition TNM staging system.
Comparison of the ROC curves of the nomogram and the TNM staging systems for 1-, 2- and 3-year OS prediction (A, B, C) and CSS prediction (D, E, F).
Discussion
The annual incidence of pancreatic head adenocarcinoma is steadily on the rise [1]. The curative resectable rate is only 20%, and the prognosis is relatively poor [17]. It is necessary to establish an efficient prognostic system that can be used to predict survival for these patients. However, pancreatic adenocarcinoma is heterogeneous in regard to the survival of individual patients. It is imprecise to solely use tradsitional staging systems to evaluate prognosis. Furthermore, several previously reported nomograms for patients with pancreatic adenocarcinoma only focused on the OS of patients, ignoring non-cancer-specific mortality, which had profound effects on the survival outcome, especially for patients with increasing age [18, 19]. Thus, we sought to develop and validate such prognostic nomograms to predict the probability of OS and CSS. The nomograms which were derived from retrospectively collected data on 2374 patients from the SEER dataset, showed favorable discrimination and calibration. Additionally, the ROC curves demonstrated that the nomogram showed better ability in predicting OS and CSS. Superior to the existing TNM staging system, the proposed nomograms included easily measured clinical characteristics, which facilitated the popularization of patient counseling and personalized treatment.
Currently, most patients with pancreatic adenocarcinoma are older than 60 years old [20, 21]. In addition, it has been indicated that increasing age has a direct effect on cancer-specific mortality. Multivariate analyses showed that older age was an independent risk factor for both OS and CSS, which indicated that older patients had poorer survival and were at greater risk of cancer-specific death. Furthermore, three-fourths of non-cancer-specific mortality was observed in patients with older age in this study. This conclusion was similar to that of other studies which showed that non-cancer-specific mortality was an important competing risk event in older patients [22]. Age-related comorbid conditions or complications may contribute to non-cancer-specific mortality in older patients. Thus, it was practical and necessary to take non-cancer-specific mortality into account in the analysis of prognosis, especially among patients of older ages.
A nomogram was developed as a statistical tool to calculate the probability of a specific survival outcome via a simple graphical presentation. The monograms established in this study were only composed of pathological variables. According to our nomogram based on the proportional hazard analysis of Cox regression model and Fine and Grey's model, patients older than 60 years were more likely to have poor survival and cancer-specific mortality. What is more, our nomograms also indicated the magnitude of poor prognosis as tumor grade changed from well to poorly differentiated. It was shown that tumor differentiation was an independent factor for the prediction of survival in similar reports [23, 24], which is consistent with our results. Furthermore, tumor differentiation was independent of other pathological variables, such as tumor size and LN metastasis, which are the main components of TNM staging systems. According to the nomograms, patients with different tumor differentiation would be assigned different points and would have different OS and CSS, even if they were classified as the same TNM stage. These results clearly identified differences between prognoses predicted by nomograms and those predicted by the traditional TNM staging systems, and they might partly explain the superior power of nomograms for predicting OS and CSS compared with TNM 7th and 8th edition staging systems.
In addition to tumor differentiation, increased LNR value was found to be a poor prognostic factor for both OS and CSS. Our nomograms revealed an interesting phenomenon: the classic 'N' stages of both TNM 7th and 8th edition staging systems failed to remain independent predictive factors, whereas LNR exhibited independent predictive significance in both OS and CSS analyses, which is similar to other reports [25, 26]. LNR incorporates information regarding the positive LNs as well as an estimate of the adequacy of obtained LNs [27]. It was indicated that LNR is a significant modifier of the effects of LN status and the number of examined LNs [28]. An elevated LNR is a sign showing the tendency of metastasis or progression and was associated with poorer OS and CSS in this study. These results are similar to those from research conducted by the MD Anderson Cancer Center [29], in which the strong association between higher LNR values and low distant metastasis-free survival was proven.
In addition to the factors mentioned above, metastasis and tumor size were also identified to be significant predictors of prognosis. This result was consistent with many previous reports [18, 20] that showed the independent significance of these two factors for survival prediction in patients with pancreatic adenocarcinoma.
Non-cancer-specific mortality is the main form of competing risk and should be considered when evaluating prognosis for decision-making and patient counseling. Competing risk nomograms have been developed for several cancers, including lung cancer, middle ear cancer and renal cancer [30-32]. As far as we know, this is the first attempt to establish a competing risk nomogram to predict OS and CSS in patients with surgically resected pancreatic head adenocarcinoma. Moreover, a combination of main elements of traditional staging systems and other tumor-associated indices, such as age, tumor differentiation and LNR, ensures that the nomograms display better discrimination power in predicting both OS and CSS compared with 7th and 8th edition TNM staging systems, which was shown by the comparisons of C-indexes and values of AUC. The relatively large cohort size on which the nomogram were developed could also make these results more generalizable than those from single-center studies. Furthermore, the nomograms, which were composed of few predictors, were easily available for doctors to make accurate individual prognosis estimates.
This study has several limitations that must be taken into account. First, information on serum carbohydrate antigen 19-9 (CA19-9), which is the most widely used tumor marker for PDAC [33], as well as some positive variables associated with prognosis, such as surgical margin status and vascular invasion, was unavailable in the SEER dataset. Inclusion of these variables will be a major part of our future research. In addition, some indices associated with the patient's basic information, such as comorbidity, did not serve as a predictor in the competing risk nomogram. As age was selected as an important predictor in the nomograms, we regarded it as a proxy of comorbidity to offset this limitation. Moreover, we randomly divided patients into two groups: 2/3 for nomogram establishment and 1/3 for nomogram validation, and the C-indexes and AUC values were not relatively high. Although this was a generally accepted method for nomogram construction and validation, and although the nomograms showed better performance in OS and CSS prediction compared with TNM stagings systems, external validation in other populations is still needed to estimate model accuracy. Finally, despite being user-friendly tools to help doctors make decisions, these nomograms did not include all prognostic factors and could not always provide precise prognosis in clinical practice.
In conclusion, we analyzed the prognostic data of surgically resected pancreatic head adenocarcinoma using the SEER database. Cancer-specific mortality and competing risk mortality were evaluated. Furthermore, nomograms for estimating 1-, 2- and 3-year OS and CSS in patients with pancreatic head adenocarcinoma after surgery were established for the first time based on a large study cohort. Our nomograms showed a relatively good performance and may be considered as practical tools to predict prognosis. However, further external validation is still needed.
Acknowledgements
The authors would like to thank SEER for open access to database.
Competing Interests
The authors have declared that no competing interest exists.
References
1. Siegel RL, Miller KD, Jemal A. Cancer statistics, 2018. CA: a cancer journal for clinicians. 2018;68:7-30
2. Rahib L, Smith BD, Aizenberg R, Rosenzweig AB, Fleshman JM, Matrisian LM. Projecting cancer incidence and deaths to 2030: the unexpected burden of thyroid, liver, and pancreas cancers in the United States. Cancer research. 2014;74:2913-21
3. Salem AI, Alfi M, Winslow E, Cho CS, Weber SM. Has survival following pancreaticoduodenectomy for pancreas adenocarcinoma improved over time? Journal of surgical oncology. 2015;112:643-9
4. Griffin JF, Poruk KE, Wolfgang CL. Pancreatic cancer surgery: past, present, and future. Chinese journal of cancer research = Chung-kuo yen cheng yen chiu. 2015;27:332-48
5. Kamarajah SK, Burns WR, Frankel TL, Cho CS, Nathan H. Validation of the American Joint Commission on Cancer (AJCC) 8th Edition Staging System for Patients with Pancreatic Adenocarcinoma: A Surveillance, Epidemiology and End Results (SEER) Analysis. Annals of surgical oncology. 2017;24:2023-30
6. Janssen-Heijnen ML, Houterman S, Lemmens VE, Louwman MW, Maas HA, Coebergh JW. Prognostic impact of increasing age and co-morbidity in cancer patients: a population-based approach. Critical reviews in oncology/hematology. 2005;55:231-40
7. Noordzij M, Leffondre K, van Stralen KJ, Zoccali C, Dekker FW, Jager KJ. When do we need competing risks methods for survival analysis in nephrology? Nephrology, dialysis, transplantation: official publication of the European Dialysis and Transplant Association - European Renal Association. 2013;28:2670-7
8. Gooley TA, Leisenring W, Crowley J, Storer BE. Estimation of failure probabilities in the presence of competing risks: new representations of old estimators. Statistics in medicine. 1999;18:695-706
9. Putter H, Fiocco M, Geskus RB. Tutorial in biostatistics: competing risks and multi-state models. Statistics in medicine. 2007;26:2389-430
10. Zhang J, Peng H, Chen L, Li WF, Mao YP, Liu LZ. et al. Decreased Overall and Cancer-Specific Mortality with Neoadjuvant Chemotherapy in Locoregionally Advanced Nasopharyngeal Carcinoma Treated by Intensity-modulated Radiotherapy: Multivariate Competing Risk Analysis. Journal of Cancer. 2017;8:2587-94
11. Ghavami V, Mahmoudi M, Rahimi Foroushani A, Baghishani H, Homaei Shandiz F, Yaseri M. Long-Term Disease-Free Survival of Non-Metastatic Breast Cancer Patients in Iran: A Survival Model with Competing Risks Taking Cure Fraction and Frailty into Account. Asian Pacific journal of cancer prevention: APJCP. 2017;18:2825-32
12. Chang YH, Li WH, Chang Y, Peng CW, Cheng CH, Chang WP. et al. Front-line intraperitoneal versus intravenous chemotherapy in stage III-IV epithelial ovarian, tubal, and peritoneal cancer with minimal residual disease: a competing risk analysis. BMC cancer. 2016;16:235
13. Gray RJ. A class of K-sample tests for comparing the cumulative incidence of a competing risk. The Annals of statistics. 1988:1141-54
14. Fine JP, Gray RJ. A proportional hazards model for the subdistribution of a competing risk. Journal of the American statistical association. 1999;94:496-509
15. Harrell FE Jr, Lee KL, Mark DB. Multivariable prognostic models: issues in developing models, evaluating assumptions and adequacy, and measuring and reducing errors. Statistics in medicine. 1996;15:361-87
16. Pencina MJ, D'Agostino RB. Overall C as a measure of discrimination in survival analysis: model specific population value and confidence interval estimation. Statistics in medicine. 2004;23:2109-23
17. Kamisawa T, Wood LD, Itoi T, Takaori K. Pancreatic cancer. Lancet (London, England). 2016;388:73-85
18. Deng QL, Dong S, Wang L, Zhang CY, Ying HF, Li ZS. et al. Development and Validation of a Nomogram for Predicting Survival in Patients with Advanced Pancreatic Ductal Adenocarcinoma. Scientific reports. 2017;7:11524
19. Pu N, Gao S, Xu Y, Zhao G, Lv Y, Nuerxiati A. et al. Alkaline Phosphatase-To-Albumin Ratio as a Prognostic Indicator in Pancreatic Ductal Adenocarcinoma after Curative Resection. Journal of Cancer. 2017;8:3362-70
20. Hamada T, Nakai Y, Yasunaga H, Isayama H, Matsui H, Takahara N. et al. Prognostic nomogram for nonresectable pancreatic cancer treated with gemcitabine-based chemotherapy. British journal of cancer. 2014;110:1943-9
21. Eubanks A, Pepe J, Veldhuis P, de la Fuente SG. Age as a prognostic indicator for adjuvant therapy in patients who underwent pancreatic resections for cancer. Journal of geriatric oncology. 2018
22. Eguchi T, Bains S, Lee MC, Tan KS, Hristov B, Buitrago DH. et al. Impact of Increasing Age on Cause-Specific Mortality and Morbidity in Patients With Stage I Non-Small-Cell Lung Cancer: A Competing Risks Analysis. Journal of clinical oncology: official journal of the American Society of Clinical Oncology. 2017;35:281-90
23. Hornick JR, Johnston FM, Simon PO, Younkin M, Chamberlin M, Mitchem JB. et al. A single-institution review of 157 patients presenting with benign and malignant tumors of the ampulla of Vater: management and outcomes. Surgery. 2011;150:169-76
24. Winter JM, Cameron JL, Olino K, Herman JM, de Jong MC, Hruban RH. et al. Clinicopathologic analysis of ampullary neoplasms in 450 patients: implications for surgical strategy and long-term prognosis. Journal of gastrointestinal surgery: official journal of the Society for Surgery of the Alimentary Tract. 2010;14:379-87
25. Riediger H, Kulemann B, Wittel U, Adam U, Sick O, Neeff H. et al. Prognostic Role of Log Odds of Lymph Nodes After Resection of Pancreatic Head Cancer. Journal of gastrointestinal surgery: official journal of the Society for Surgery of the Alimentary Tract. 2016;20:1707-15
26. Zhan HX, Xu JW, Wang L, Zhang GY, Hu SY. Lymph node ratio is an independent prognostic factor for patients after resection of pancreatic cancer. World journal of surgical oncology. 2015;13:105
27. Ashfaq A, Pockaj BA, Gray RJ, Halfdanarson TR, Wasif N. Nodal counts and lymph node ratio impact survival after distal pancreatectomy for pancreatic adenocarcinoma. Journal of gastrointestinal surgery: official journal of the Society for Surgery of the Alimentary Tract. 2014;18:1929-35
28. Smith BJ, Mezhir JJ. An interactive Bayesian model for prediction of lymph node ratio and survival in pancreatic cancer patients. Journal of the American Medical Informatics Association: JAMIA. 2014;21:e203-11
29. Roland CL, Katz MH, Gonzalez GM, Pisters PW, Vauthey JN, Wolff RA. et al. A high positive lymph node ratio is associated with distant recurrence after surgical resection of ampullary carcinoma. Journal of gastrointestinal surgery: official journal of the Society for Surgery of the Alimentary Tract. 2012;16:2056-63
30. Zhou H, Zhang Y, Qiu Z, Chen G, Hong S, Chen X. et al. Nomogram to Predict Cause-Specific Mortality in Patients With Surgically Resected Stage I Non-Small-Cell Lung Cancer: A Competing Risk Analysis. Clinical lung cancer. 2017
31. Shen W, Sakamoto N, Yang L. Prognostic models to predict overall and cause-specific survival for patients with middle ear cancer: a population-based analysis. BMC cancer. 2014;14:554
32. Kutikov A, Egleston BL, Wong YN, Uzzo RG. Evaluating overall survival and competing risks of death in patients with localized renal cell carcinoma using a comprehensive nomogram. Journal of clinical oncology: official journal of the American Society of Clinical Oncology. 2010;28:311-7
33. Itzkowitz SH, Yuan M, Fukushi Y, Lee H, Shi ZR, Zurawski V Jr. et al. Immunohistochemical comparison of Lea, monosialosyl Lea (CA 19-9), and disialosyl Lea antigens in human colorectal and pancreatic tissues. Cancer research. 1988;48:3834-42
Author contact
![]() Corresponding authors: Professor Xiaojun Lin, Department of Hepatobiliary and Pancreatic Surgery, Sun Yat-sen University Cancer Center; State Key Laboratory of Oncology in South China; Collaborative Innovation Center for Cancer Medicine, Guangzhou 510060, China. E-mail: linxjorg.cn; Professor Shengping Li, Department of Hepatobiliary and Pancreatic Surgery, Sun Yat-sen University Cancer Center; State Key Laboratory of Oncology in South China; Collaborative Innovation Center for Cancer Medicine, Guangzhou 510060, China. E-mail: lishporg.cn
Corresponding authors: Professor Xiaojun Lin, Department of Hepatobiliary and Pancreatic Surgery, Sun Yat-sen University Cancer Center; State Key Laboratory of Oncology in South China; Collaborative Innovation Center for Cancer Medicine, Guangzhou 510060, China. E-mail: linxjorg.cn; Professor Shengping Li, Department of Hepatobiliary and Pancreatic Surgery, Sun Yat-sen University Cancer Center; State Key Laboratory of Oncology in South China; Collaborative Innovation Center for Cancer Medicine, Guangzhou 510060, China. E-mail: lishporg.cn