Impact Factor ISSN: 1837-9664

 Global reach, higher impact
J Cancer 2018; 9(16):2885-2894. doi:10.7150/jca.25408 This issue Cite
Research Paper
Different Risk Profiles for the Postsurgical Prognosis of Gastric Cancer Patients with Different Blood Types: The FIESTA Study
Guohui Fan1,*, Dan Hu2,*, Feng Peng3,*, Guodong Xu1,*, Xiandong Lin2, Binying Liang4, Hejun Zhang2, Yan Xia2, Jinxiu Lin3, Xiongwei Zheng2, Wenquan Niu1 ![]()
1. Institute of Clinical Medical Sciences, China-Japan Friendship Hospital, Beijing, China.
2. Department of Pathology, Fujian Provincial Cancer Hospital, The Affiliated Hospital of Fujian Medical University, Fuzhou, Fujian, China.
3. Department of Cardiology, The First Affiliated Hospital of Fujian Medical University, Fuzhou, Fujian, China.
4. Department of Medical Record, Fujian Provincial Cancer Hospital, The Affiliated Hospital of Fujian Medical University, Fuzhou, Fujian, China.
*Shared first authors.
Received 2018-2-7; Accepted 2018-6-9; Published 2018-7-30
Abstract
Objectives: We here attempted to evaluate the prediction of different “ABO” blood groups for postsurgical gastric cancer-specific mortality by using data from the ongoing Fujian prospective investigation of cancer (FIESTA) study.
Methods: Initially, a total of 3413 patients with gastric cancer were consecutively enrolled between January 2000 and December 2010 to receive radical gastrectomy, and they were followed up until December 2015. Study patients were divided into the “O+” group and the blood type “O-” group.
Results: Of 2781 eligible patients, 1116 (40.1%) were in the “O+” group and 1665 (59.9%) in the “O-” group, with mortality rate of being 45.0% (n = 502) and 45.3% (n = 755), respectively. A 1:1 propensity score match between the “O+” and the “O-” groups was used. After adjustment, neutrophil-lymphocyte ratio (NLR), lymphocyte-monocyte ratio (LMR), high total cholesterol and high low-density lipoprotein cholesterol, had non-overlapping 95% confidence intervals between the “O+” and the “O-” groups and simultaneously had detectable statistical significance in either group only. A forward method in the multivariate-adjusted COX model was employed and there were five shared risk factors between both groups, including diabetes mellitus, low high-density lipoprotein cholesterol, regional lymph node metastasis, tumor size and TNM stage. Further nomogram plot revealed that presurgical risk factors selected can better predict the risk of early gastric cancer-specific mortality (C-index: 0.737 for the “O-” group and 0.751 for the “O+” group).
Conclusions: Our findings indicated that the prognostic factors differed between postsurgical gastric cancer patients with “O+” and “O-” blood types.
Keywords: Gastric cancer, Blood type, Prognosis, Mortality.
Introduction
Gastric cancer ranks as the fifth most common cancer and the third leading cause of cancer-related deaths worldwide, especially in East Asia [1]. In China, it is estimated that 679 100 cases of gastric cancer were newly diagnosed and 498 000 deaths occurred during the year 2015 [2]. Although great efforts have been made in medical interventions, the pooled 5-year survival rate of gastric cancer is still far less satisfactory, as most patients are diagnosed at high-grade invasive stages [3]. Management that benefits the prognosis of gastric cancer patients includes identification of poor prognostic indicators with timely and proper intervention, such as blood types [4].
The “ABO” blood group system was first discovered by Karl Landsteiner in 1901, and it is the major human blood type system in transfusion medicine [5]. Humans have four blood types, viz. A, B, O and AB. A large number of studies have claimed that “ABO” blood group was associated with the significant risk of various malignancies, including gastric cancer [4, 6-10]. For example, a recent study indicated that “A” blood group was an adverse prognostic factor in gastric cancer patients [11]. Another study by Aird et al [12] reported that less gastric cancer cases were found in “O” blood type. A hospital-based matched case-control study in Taipei also showed that the incidence of stomach cancer differed significantly across different blood types [13].
However, whether the “ABO” blood group can predict the clinical prognosis of patients with gastric cancer after radical surgery is rarely reported. To yield more information, we here attempted to evaluate the prediction of different “ABO” blood groups for postsurgical gastric cancer-specific mortality by using data from the ongoing Fujian prospective investigation of cancer (FIESTA) study, which was designed to seek preoperative prognostic factors for digestive cancer-specific mortality, aiming to slow down tumor progression and prolong the survival of cancer patients after the surgery [14-20]. What's more, we further explored whether the prognostic risk profiles were identical across “ABO” blood groups after a 15-year follow-up period.
Materials and Methods
Study Patients
Initially, a total of 3413 patients diagnosed with gastric cancer were consecutively admitted to the Department of Thoracic Surgery, Fujian Provincial Cancer Hospital between January 2000 and December 2010 to receive radical gastrectomy, and they were followed up until December 2015.
Ethic Approval
This study was approved by the Ethics Committee of Fujian Provincial Cancer Hospital. All study patients gave written informed consent for collecting biospecimen and academic analyses.
Eligible Criteria
Patients were included if they were unrelated in consanguinity and were of Han Chinese descent. In addition, they had not received radical gastrectomy, as well as preoperative chemotherapy and/or radiotherapy prior to participation in the current study. Moreover, eligible patients must have no history of any malignance except non-melanoma skin cancer. Patients were excluded if they had recurrent gastric cancer at the time of enrolment and received treatment elsewhere.
Tissue Collection
Matched primary gastric cancer and adjacent normal tissue samples were collected during the surgery, and they were fixed in 10% neutral-buffered formalin for 20 hours within 1 hour after surgical removal and were paraffin-embedded using standard procedures.
Diagnosis
The clinicopathologic analysis of these specimens was completed at the Department of Pathology, Fujian Provincial Cancer Hospital. Diagnosis of gastric cancer was confirmed through postsurgical pathological tests.
Follow-up Assessment
All eligible patients were invited for follow-up interviews every six to twelve months at the Out-Patient Department of Fujian Provincial Cancer Hospital after discharge. Phone calls or postal mails were adopted if patients failed to show up at scheduled time. The time to event was recorded in months from the date of receiving radical gastrectomy between 2000 and 2010 to the date of specific-cause death or the date of last follow-up before 2015, whichever occurred first. As the minimal follow-up of postoperative patients was at least 5 years, prognostic prediction can be accurately calculated at the 5-year time point.
After 15-year follow-up of 3413 patients receiving radical gastrectomy, 118 patients were lost, 48 patients had follow-up time less than 1 month, 235 patients died of causes other than gastric cancer, 231 patients without recorded information on blood types, leaving a total of 2781 patients with complete data in the final analysis. The median follow-up time of these 2781 patients was 42.3 months (range: 1.1 months to 175.4 months). As of December 2015, 1257 patients died of gastric cancer and 1524 patients survived. Besides, those who failed to follow-up were dealt as sensor data.
Baseline Information
At the time of enrolment, each patient was invited to complete a self-designed structured questionnaire to collect baseline information on demographic and anthropometric characteristics, including date of birth, age of gastric cancer onset, gender, ABO blood type, smoking, drinking and family cancer history. Age was recorded at the surgery time for gastric cancer. Smoking was categorized as former or current smoking and never smoking. Drinking was categorized as former or current drinking and never drinking. Family cancer history was recorded to be positive if one or more cases of a family suffering from cancer except non-melanoma skin cancer within three generations.
On site, body weight and height were measured to derive body mass index (BMI), which was calculated as weight (in kilograms) divided by the square of height (in meters). Blood pressure (BP) was also measured, and hypertension was defined as systolic BP ≥ 140 mm Hg or diastolic BP ≥ 90 mm Hg or under antihypertensive medication.
Clinicopathologic Characteristics
Clinicopathologic characteristics were abstracted from medical charts and pathological reports, including tumor nodes metastasis (TNM) stage (I, II, III and IV) [21], tumor size (in centimeters), depth of invasion (T1, T2, T3 and T4), regional lymph node metastasis (LNM) (N0, N1, N2 and N3), distant metastasis (M0 andM1), Lauren's classification (intestinal type and diffuse type), and embolus (positivity and negativity) [17].
Biochemical Markers
In the morning of surgery day, fasting venous blood samples (at least 8 hours) were collected into the EDTA-K2 anticoagulative tubes from each patient. Some routine biochemical markers were measured, including fasting blood glucose (FBG), triglycerides, total cholesterol, high-density lipoprotein cholesterol (HDLC) and low-density lipoprotein cholesterol (LDLC) according to standard procedures at the Clinical Laboratory of Fujian Provincial Cancer Hospital.In addition, routine blood markers were also measured at the Clinical Laboratory of Fujian Provincial Cancer Hospital using the fasting venous blood samples, including neutrophil, lymphocyte, monocyte, eosinophil, basophil, white blood cell count, red blood cell count, hemoglobin, red cell distribution width and platelet count by using the SYSMEX XE-2100 Automatic Blood Cell Analyzer (Sysmex, Kobe, Japan). Besides, composite markers, neutrophil-lymphocyte ratio (NLR), platelet-lymphocyte ratio (PLR) and LMR (lymphocyte-monocyte ratio) were calculated accordingly.
Diabetes mellitus was diagnosed if FBG ≥ 7.0 mmol/L. Hypertriglyceridemia were defined as triglycerides ≥ 2.26 mmol/L. High total cholesterol was defined as total cholesterol ≥ 2.26 mmol/L. Low HDLC was defined as LDLC < 1.04 mmol/L. High LDLC was defined as LDLC ≥ 4.14 mmol/L. Dyslipidemia was defined as hypertriglyceridemia, high total cholesterol, low HDLC or high LDLC, whichever was diagnosed.
Statistical Analysis
From statistical and biological viewpoints, we divided study patients into the “O+” group (blood type: O, carrying no antigens) and the blood type “O-” group (blood type: A, B and AB, carrying antigens). Continuous variables were presented as median (interquartile range), and categorical variables as number or proportion. Two group comparisons were done by the Wilcoxon rank-sum test or χ2 test, where appropriate.
The Kaplan-Meier curve and Log-rank test were used to display and test the differences of cumulative survival rates. Survival tree analysis was used to determine the optimal cut-off value by the STREE program (available at the website: http://c2s2.yale.edu/software/stree/).
A propensity score was estimated using logistic regression with the “O+” group and the “O-” group as the outcome to determine the probability of blood type of each patient conditional on observed covariates. The propensity score for each patient was obtained by fitting a propensity model. With covariates selected based on clinical judgment and statistical significance in univariate comparisons, the following variables were used in propensity models, including age, gender, smoking, drinking, BMI, hypertension, dyslipidemia, and diabetes mellitus. A 1:1 match was then performed between the “O+” group and the “O-” group based on the propensity score. Those with closest scores were considered as pairs. After propensity matching, adjusted and unadjusted Cox proportional hazard models were fitted to estimate hazard ratio (HR) and its 95% confidence interval (CI) for gastric cancer-specific mortality.
Finally, a prognostic nomogram was drawn based on the estimates of adjusted multivariable Cox regression models to predict the three-year, five-year, and ten-year survival rates separately for the “O+” group and the “O-” group. The nomogram was realized using “rms” program package in the R software, version 3.4.2 (available at the website: https://www.r-project.org).
Statistical analyses were completed with the SAS software, version 9.4(SAS Institute Inc.), unless otherwise indicated.
Results
Baseline Characteristics
Of 2781 eligible patients under study (Mortality rate: 94 per 10,000 per person-month), 1116 (40.1%) were in the “O+” group and 1665 (59.9%) in the “O-” group, with mortality rate of being 45.0% (n = 502, mortality rate: 95 per 10,000 per person-month) and 45.3% (n = 755, mortality rate: 93 per 10,000 per person-month), respectively. In both groups, patients who died of gastric cancer (non-survivors) had significant higher levels of age at surgery, neutrophil and red cell distribution width than patients who survived (survivors), as well as for the percentages of hypertension, dyslipidemia, hypertriglyceridemia, low HDLC, diabetes mellitus, overweight and obesity, whereas the levels of lymphocyte, red blood cell count and hemoglobin were significantly lower in non-survivors than in survivors (all P < 0.05). In the “O+” group, the levels of white blood cell count and the percentages of high total cholesterol, high LDLC were significantly higher in non-survivors than in survivors (all P < 0.05) (Table 1).
The baseline characteristics of cohort patients in both “O+” and “O-” blood type groups.
| Characteristics | The “O+” group (n=1116) | The “O-“ group (n=1665) | |||||||
|---|---|---|---|---|---|---|---|---|---|
| Total | Non-survivors | Survivors | P | Total | Non-survivors | Survivors | P | ||
| Overall, n | 1116 | 502 (45.0) | 614 (55.0) | - | 1665 | 755 (45.3) | 910 (54.7) | - | |
| Age at surgery (years) | 59 (51, 67) | 60 (52, 68) | 58 (50, 65) | 0.0162 | 59 (51, 67) | 60 (52, 69) | 58 (51, 66) | 0.0012 | |
| Males, n (%) | 841 (75.36) | 366 (72.91) | 475 (77.36) | 0.0859 | 1231 (73.93) | 556 (73.64) | 675 (74.18) | 0.8050 | |
| Smoking, n (%) | 213 (19.19) | 92 (18.44) | 121 (19.80) | 0.5651 | 341 (20.59) | 146 (19.49) | 195 (21.50) | 0.3148 | |
| Drinking, n (%) | 70 (6.31) | 30 (6.01) | 40 (6.55) | 0.7155 | 97 (5.86) | 43 (5.74) | 54 (5.96) | 0.8501 | |
| Family history, n (%) | 101 (9.10) | 42 (8.42) | 59 (9.66) | 0.4751 | 157 (9.49) | 65 (8.69) | 92 (10.14) | 0.3152 | |
| White blood cell count (109/L) | 6.3 (5.3,7.6) | 6.5 (5.4,7.8) | 6.2 (5.1,7.5) | 0.0090 | 6.3 (5.2,7.7) | 6.3 (5.3,7.6) | 6.3 (5.1,7.7) | 0.3316 | |
| Neutrophil (109/L) | 3.7 (2.8,4.7) | 3.9 (2.9,4.9) | 3.5 (2.7,4.5) | <.0001 | 3.7 (2.8,4.8) | 3.9 (3,5) | 3.6 (2.7,4.7) | <.0001 | |
| Lymphocyte (109/L) | 1.8 (1.4,2.2) | 1.7 (1.4,2.2) | 1.8 (1.5,2.3) | 0.0013 | 1.8 (1.4,2.2) | 1.7 (1.3,2.1) | 1.9 (1.5,2.4) | <.0001 | |
| Monocyte (109/L) | 0.5 (0.4,0.6) | 0.5 (0.4,0.6) | 0.5 (0.4,0.6) | 0.3035 | 0.5 (0.4,0.6) | 0.5 (0.4,0.6) | 0.5 (0.4,0.6) | 0.0413 | |
| Eosinophil (109/L) | 0.2 (0.1,0.3) | 0.19 (0.1,0.3) | 0.2 (0.1,0.3) | 0.1324 | 0.2 (0.1,0.3) | 0.2 (0.1,0.3) | 0.2 (0.1,0.3) | 0.9934 | |
| Basophil (109/L) | 0 (0,0) | 0 (0,0.01) | 0 (0,0) | 0.0286 | 0 (0,0) | 0 (0,0) | 0 (0,0) | 0.1066 | |
| Red blood cell count (1012/L) | 4.18 (3.73, 4.55) | 4.09 (3.64, 4.5) | 4.22 (3.78, 4.6) | 0.0009 | 4.2 (3.7, 4.58) | 4.04 (3.59, 4.47) | 4.28 (3.81, 4.63) | <.0001 | |
| Hemoglobin (g/L) | 125 (103, 138) | 121 (97, 134) | 130 (108, 141) | <.0001 | 126 (105, 139) | 120 (99, 134) | 130 (113, 142) | <.0001 | |
| Red cell distribution width (%) | 13.3 (12.5, 14.6) | 13.5 (12.6, 15.2) | 13.2 (12.4, 14.4) | 0.0002 | 13.2 (12.5, 14.6) | 13.4 (12.5, 15.3) | 13.1 (12.4, 14.1) | 0.0034 | |
| Platelet-to-lymphocyte ratio | 255.5 (207, 317.5) | 257.5 (206.5, 321) | 254 (207, 313.5) | 0.4046 | 250 (200, 307) | 250 (200, 311) | 249 (200, 304) | 0.3576 | |
| Invasion depth, n (%) | <.0001 | <.0001 | |||||||
| T1 | 102 (9.15) | 7 (1.40) | 95 (15.47) | 147 (8.84) | 6 (0.80) | 141 (15.53) | |||
| T2 | 98 (8.79) | 21 (4.19) | 77 (12.54) | 150 (9.03) | 25 (3.32) | 125 (13.77) | |||
| T3 | 629 (56.41) | 274 (54.69) | 355 (57.82) | 932 (56.08) | 425 (56.37) | 507 (55.84) | |||
| T4 | 286 (25.65) | 199 (39.72) | 87 (14.17) | 433 (26.05) | 298 (39.52) | 135 (14.87) | |||
| Regional lymph node metastasis, n (%) | <.0001 | <.0001 | |||||||
| N0 | 294 (26.37) | 43 (8.58) | 251 (40.88) | 448 (26.94) | 79 (10.48) | 369 (40.59) | |||
| N1 | 379 (33.99) | 169 (33.73) | 210 (34.20) | 508 (30.55) | 220 (29.18) | 288 (31.68) | |||
| N2 | 353 (31.66) | 217 (43.31) | 136 (22.15) | 568 (34.16) | 344 (45.62) | 224 (24.64) | |||
| N3 | 89 (7.98) | 72 (14.37) | 17 (2.77) | 139 (8.36) | 111 (14.72) | 28 (3.08) | |||
| Distant metastasis, n (%) | <.0001 | <.0001 | |||||||
| Negative | 968 (86.82) | 365 (72.85) | 603 (98.21) | 1466 (88.26) | 569 (75.56) | 897 (98.79) | |||
| Positive | 147 (13.18) | 136 (27.15) | 11 (1.79) | 195 (11.74) | 184 (24.44) | 11 (1.21) | |||
| Tumor-node-metastasis stage, n (%) | <.0001 | <.0001 | |||||||
| I | 138 (12.40) | 8 (1.60) | 130 (21.17) | 197 (11.87) | 7 (0.93) | 190 (20.93) | |||
| II | 162 (14.56) | 33 (6.61) | 129 (21.01) | 255 (15.36) | 61 (8.11) | 194 (21.37) | |||
| III | 625 (56.15) | 295 (59.12) | 330 (53.75) | 947 (57.05) | 441 (58.64) | 506 (55.73) | |||
| IV | 188 (16.89) | 163 (32.67) | 25 (4.07) | 261 (15.72) | 243 (32.31) | 18 (1.98) | |||
| The Lauren's classification, n (%) | <.0001 | <.0001 | |||||||
| Diffuse type | 697 (62.85) | 356 (71.49) | 341 (55.81) | 989 (60.09) | 509 (68.23) | 480 (53.33) | |||
| Intestinal type | 412 (37.15) | 142 (28.51) | 270 (44.19) | 657 (39.91) | 237 (31.77) | 420 (46.67) | |||
| Embolus, n (%) | 461 (41.53) | 266 (53.41) | 195 (31.86) | <.0001 | 615 (37.39) | 361 (48.39) | 254 (28.25) | <.0001 | |
| Tumor size (cm) | 5 (3.5,7) | 6 (4,8) | 4 (3,6) | <.0001 | 5 (3.5,7) | 6 (4.5,8) | 4.5 (3,6) | <.0001 | |
| Number of regional lymph node metastasis | 4 (0,9) | 7 (3,12) | 1 (0,5) | <.0001 | 3 (0,8) | 6 (2,12) | 1 (0,5) | <.0001 | |
| Hypertension, n (%) | 310 (27.78) | 176 (35.06) | 134 (21.82) | <.0001 | 445 (26.73) | 247 (32.72) | 198 (21.76) | <.0001 | |
| Dyslipidemia, n (%) | 691 (62.20) | 360 (72.00) | 331 (54.17) | <.0001 | 1055 (63.63) | 544 (72.44) | 511 (56.34) | <.0001 | |
| High total cholesterol , n (%) | 54 (4.86) | 36 (7.20) | 18 (2.95) | 0.0011 | 118 (7.12) | 57 (7.59) | 61 (6.73) | 0.4956 | |
| High triglycerides, n (%) | 92 (8.28) | 51 (10.20) | 41 (6.71) | 0.0358 | 129 (7.78) | 74 (9.85) | 55 (6.06) | 0.0041 | |
| Low HDLC, n (%) | 615 (55.36) | 319 (63.80) | 296 (48.45) | <.0001 | 926 (55.88) | 496 (66.13) | 430 (47.41) | <.0001 | |
| High LDLC, n (%) | 94 (8.46) | 61 (12.20) | 33 (5.40) | <.0001 | 199 (12.01) | 99 (13.20) | 100 (11.03) | 0.1753 | |
| Diabetes mellitus, n (%) | 255 (22.91) | 211 (42.12) | 44 (7.19) | <.0001 | 405 (24.40) | 291 (38.65) | 114 (12.57) | <.0001 | |
| Body mass index (kg/m2) | 22.77 (20.8, 25) | 22.95 (20.72, 25.44) | 22.65 (20.83, 24.46) | 0.0536 | 22.55 (20.58, 24.68) | 22.66 (20.57, 25.03) | 22.48 (20.62, 24.45) | 0.1807 | |
| Body mass index, n (%) | 0.0075 | 0.0009 | |||||||
| < 24 kg/m2 | 731 (65.50) | 305 (60.76) | 426 (69.38) | 1118 (67.15) | 489 (64.77) | 629 (69.12) | |||
| 24 - 28 kg/m2 | 313 (28.05) | 157 (31.27) | 156 (25.41) | 462 (27.75) | 211 (27.95) | 251 (27.58) | |||
| ≥28 kg/m2 | 72 (6.45) | 40 (7.97) | 32 (5.21) | 85 (5.11) | 55 (7.28) | 30 (3.30) | |||
Abbreviations: HDLC, high-density lipoprotein cholesterol; LDLC, low-density lipoprotein cholesterol. Data are expressed as median (interquartile range) or percentage. P was calculated by the Wilcoxon rank-sum test or the Chi-squared test where appropriate.
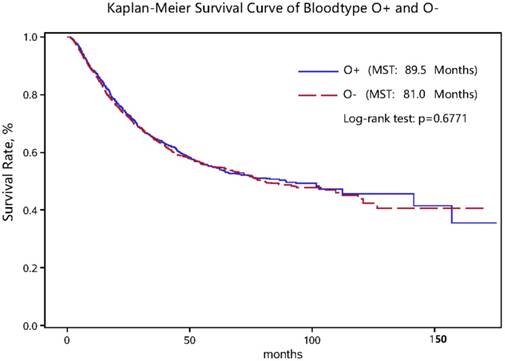
As for clinicopathologic characteristics, the distributions of invasion depth, regional LNM, distant metastasis, TNM stage, the Lauren's classification, tumor embolus, tumor size and number of regional LNM differed significantly between non-survivors and survivors in both the “O+” and the “O-” groups (all P < 0.05) (Table 1). Nevertheless, the log-rank test for survival rates between the “O+” and the “O-” groups showed no significant difference (Figure 1).
Kaplan-Meier survival curve in gastric cancer patients with the “O+” and “O-” blood types.
Propensity Score Match and Overall Risk Estimates
To reduce confounding bias, we used a 1:1 propensity score match between the “O+” and the “O-” groups. On the basis of score match and after adjusting for age, gender, smoking, drinking, BMI and family cancer history, four variables, NLR, LMR, high total cholesterol and high LDLC, had non-overlapping 95% CIs between the “O+” and the “O-” groups and simultaneously had detectable statistical significance in either group only (Table 2). The risk estimation of NLR for gastric cancer mortality was reinforced in the “O+” group relative to the “O-” group (HR: 1.07 vs. 1.02, 95% CI: 1.04-1.11 vs. 1.00-1.04, P for interaction: 0.0135). The risk prediction of LMR was only significant in the “O-” group (HR: 0.82, 95% CI: 0.76-0.88), in comparison with the “O+” group (HR: 0.97, 95% CI: 0.93-1.02) (P for interaction < 0.0001). In the “O+” group, patients with high total cholesterol (HR: 1.51, 95% CI: 1.04-2.21) or high LDLC (HR: 1.67, 95% CI: 1.25-2.25) had a higher mortality risk of gastric cancer-specific mortality than patients without, yet the interaction with the “O-” group was non-significant. In addition, “ABO” blood type was treated as a covariate in COX regression model before (Supplementary Figure 1) and after (Supplementary Figure 2) propensity score analysis.
Risk estimates after propensity-score-matched patients by “O+” and “O-” blood type†.
| The “O+” group‡ | The “O-“ group‡ | |||||||
|---|---|---|---|---|---|---|---|---|
| Characteristics | Unadjusted HR (95% CI) | P | Adjusted HR (95% CI) | P | Unadjusted HR (95% CI) | P | Adjusted HR (95% CI) | P |
| Baseline Characteristics | ||||||||
| Age | 1.01 (1.00-1.02) | 0.0079 | 1.01 (1.00-1.02) | 0.0041 | 1.01 (1.01-1.02) | 0.0016 | 1.01 (1.01-1.02) | 0.0017 |
| Male | 0.83 (0.67-1.03) | 0.0951 | 0.80 (0.64-1.00) | 0.0509 | 0.97 (0.78-1.21) | 0.7919 | 0.95 (0.75-1.19) | 0.6346 |
| Smoking | 0.94 (0.74-1.20) | 0.6454 | 0.99 (0.76-1.30) | 0.9648 | 0.93 (0.73-1.19) | 0.5824 | 0.99 (0.74-1.31) | 0.9172 |
| Drinking | 0.93 (0.63-1.37) | 0.7206 | 0.99 (0.65-1.51) | 0.9672 | 0.86 (0.58-1.29) | 0.4727 | 0.88 (0.55-1.38) | 0.5723 |
| Family history | 1.00 (0.72-1.38) | 0.9922 | 1.03 (0.75-1.42) | 0.8555 | 0.79 (0.56-1.11) | 0.1809 | 0.82 (0.58-1.16) | 0.2666 |
| BMI | 1.01 (0.97-1.04) | 0.7340 | 1.00 (0.97-1.04) | 0.8309 | 1.00 (0.97-1.03) | 0.9939 | 1.00 (0.97-1.03) | 0.9164 |
| Clinicopathologic Characteristics | ||||||||
| Tumor-node-metastasis stage | ||||||||
| I/II | Ref | Ref | Ref | Ref | ||||
| III/IV | 5.10 (3.67-7.09) | <.0001 | 5.15 (3.70-7.16) | <.0001 | 4.67 (3.39-6.45) | <.0001 | 4.68 (3.39-6.46) | <.0001 |
| Invasion depth | ||||||||
| T1/T2 | Ref | Ref | Ref | Ref | ||||
| T3/T4 | 4.35 (2.95-6.43) | <.0001 | 4.38 (2.97-6.47) | <.0001 | 6.52 (4.11-10.33) | <.0001 | 6.53 (4.12-10.36) | <.0001 |
| Regional lymph node metastasis | ||||||||
| N0 | Ref | Ref | Ref | Ref | ||||
| N1 | 3.45 (2.44-4.87) | <.0001 | 3.44 (2.44-4.86) | <.0001 | 2.76 (1.98-3.83) | <.0001 | 2.76 (1.99-3.84) | <.0001 |
| N2/N3 | 6.15 (4.41-8.57) | <.0001 | 6.36 (4.56-8.87) | <.0001 | 4.88 (3.59-6.63) | <.0001 | 4.97 (3.65-6.76) | <.0001 |
| Distant metastasis | ||||||||
| Negative | Ref | Ref | Ref | Ref | ||||
| Positive | 4.97 (4.02-6.13) | <.0001 | 5.11 (4.13-6.32) | <.0001 | 4.30 (3.44-5.36) | <.0001 | 4.43 (3.54-5.54) | <.0001 |
| The Lauren's classification | ||||||||
| Intestinal type | Ref | Ref | Ref | Ref | ||||
| Diffuse type | 1.82 (1.48-2.25) | <.0001 | 1.90 (1.54-2.36) | <.0001 | 1.59 (1.30-1.95) | <.0001 | 1.72 (1.40-2.12) | <.0001 |
| Embolus | ||||||||
| Negative | Ref | Ref | Ref | Ref | ||||
| Positive | 1.91 (1.58-2.31) | <.0001 | 1.91 (1.58-2.30) | <.0001 | 1.68 (1.39-2.04) | <.0001 | 1.67 (1.38-2.02) | <.0001 |
| Tumor size | 1.12 (1.09-1.14) | <.0001 | 1.11 (1.09-1.14) | <.0001 | 1.16 (1.13-1.19) | <.0001 | 1.16 (1.13-1.19) | <.0001 |
| Number of regional lymph node metastasis | 1.07 (1.06-1.08) | <.0001 | 1.07 (1.06-1.08) | <.0001 | 1.07 (1.06-1.08) | <.0001 | 1.07 (1.06-1.08) | <.0001 |
| Biochemical Indexes | ||||||||
| NLR | 1.07 (1.04-1.10) | <.0001 | 1.07 (1.04-1.11) | <.0001 | 1.02 (1.01-1.04) | 0.0078 | 1.02 (1.00-1.04) | 0.0123 |
| PLR | 1.00 (1.00-1.00) | 0.6355 | 1.00 (1.00-1.00) | 0.5601 | 1.00 (1.00-1.00) | 0.2131 | 1.00 (1.00-1.00) | 0.1710 |
| LMR | 0.98 (0.93-1.02) | 0.2986 | 0.97 (0.93-1.02) | 0.2597 | 0.81 (0.75-0.87) | <.0001 | 0.82 (0.76-0.88) | <.0001 |
| Metabolic Indexes | ||||||||
| Hypertension | 1.47 (1.21-1.79) | <.0001 | 1.42 (1.15-1.74) | 0.0009 | 1.39 (1.14-1.70) | 0.0011 | 1.31 (1.06-1.61) | 0.0130 |
| Dyslipidemia | 1.92 (1.56-2.37) | <.0001 | 1.96 (1.58-2.43) | <.0001 | 1.82 (1.47-2.24) | <.0001 | 1.87 (1.51-2.31) | <.0001 |
| HTC | 1.61 (1.11-2.33) | 0.0121 | 1.51 (1.04-2.21) | 0.0312 | 1.03 (0.72-1.48) | 0.8727 | 1.00 (0.70-1.43) | 0.9949 |
| HTG | 1.52 (1.12-2.05) | 0.0069 | 1.57 (1.15-2.13) | 0.0044 | 1.53 (1.12-2.10) | 0.0080 | 1.61 (1.17-2.22) | 0.0033 |
| LHDLC | 1.72 (1.42-2.10) | <.0001 | 1.77 (1.45-2.16) | <.0001 | 1.80 (1.47-2.19) | <.0001 | 1.84 (1.51-2.25) | <.0001 |
| HLDLC | 1.70 (1.27-2.27) | 0.0004 | 1.67 (1.25-2.25) | 0.0006 | 1.25 (0.95-1.65) | 0.1071 | 1.23 (0.93-1.62) | 0.1433 |
| Diabetes mellitus | 3.80 (3.14-4.60) | <.0001 | 3.91 (3.20-4.78) | <.0001 | 2.53 (2.08-3.09) | <.0001 | 2.52 (2.06-3.08) | <.0001 |
† Propensity model included age, gender, smoking, drinking, body mass index (BMI), hypertension, dyslipidemia, DM.
‡ Adjusted for age, gender, smoking, drinking, BMI, family cancer history.
Abbreviations: BMI, body mass index; HTC, High total cholesterol; HTG, hypertriglyceridemia; LHDLC, low high-density lipoprotein cholesterol; HLDLC, high low-density lipoprotein-cholesterol; NLR, neutrophil-lymphocyte ratio; PLR, platelet-lymphocyte ratio; LMR, lymphocyte-monocyte ratio; HR, hazard ratio; 95% CI, 95% confidence interval. The effect-size estimates were calculated under the COX proportional hazards regression models.
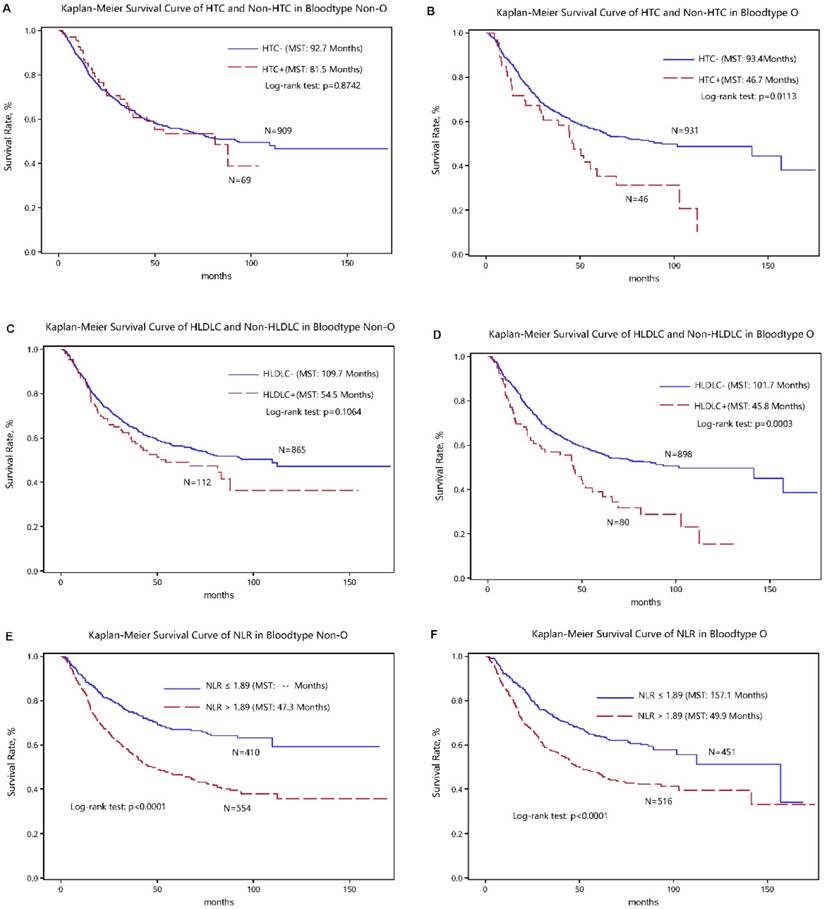
The optimal cut-off values of four above significant variables were determined in survival tree analysis and they can split patients with the maximal differences in median survival time. The discrimination ability of cutoff values for gastric cancer-specific mortality was presented in the Kaplan-Meier curves (Figure 2).
Kaplan-Meier survival curves of high total cholesterol (HTC), high low-density lipoprotein cholesterol (HLDLC) and neutrophil-lymphocyte ratio (NLR) in gastric cancer patients with the “O+” (the upper panel) and “O-” (the lower panel) blood types.
Prognostic Risk Profiles per Blood Type
A forward method in the multivariate-adjusted COX model was employed to identify major risk factors in significant prediction for gastric cancer-specific mortality in the “O+” group and the “O-” group, respectively (Table 3). By comparison, there were five shared risk factors between both groups, including diabetes mellitus, low HDLC, regional LNM, tumor size and TNM stage. Besides, high LDLC (HR: 1.99, 95% CI: 1.40-2.83, P = 0.0001) and diffuse type (HR: 1.49, 95% CI: 1.16-1.91, P = 0.0019) were significant risk factors specific for the “O+” group, whereas age (HR: 1.12, 95% CI: 1.01-1.25, P = 0.0286) and LMR (HR: 0.74, 95% CI: 0.57-0.98, P = 0.0338) were specific for the “O-” group.
Forward multivariate-adjusted COX models for “O+” and “O-” blood type groups.
| Blood Type O | Blood Type non-O | |||
|---|---|---|---|---|
| Variables | HR 95%CI | P | HR 95%CI | P |
| Age groups (year) | - | 1.124 (1.012-1.249) | 0.0286 | |
| Diabetes mellitus | 2.998 (2.394-3.755) | <.0001 | 1.994 (1.571-2.531) | <.0001 |
| HLDLC | 1.993 (1.403-2.830) | 0.0001 | - | |
| LMR | - | 0.743 (0.565-0.978) | 0.0338 | |
| LHDLC | 1.418 (1.125-1.788) | 0.0031 | 1.541 (1.222-1.942) | 0.0003 |
| Number of regional lymph node metastasis | 1.043 (1.028-1.058) | <.0001 | 1.049 (1.033-1.065) | <.0001 |
| The Lauren's classification | ||||
| Intestinal type | Ref | - | - | - |
| Diffuse type | 1.486 (1.157-1.909) | 0.0019 | - | - |
| Tumor size | 1.049 (1.018-1.081) | 0.0019 | 1.070 (1.034-1.107) | 0.0001 |
| Tumor-node-metastasis stage | 2.641 (1.773-3.934) | <.0001 | 2.175 (1.494-3.168) | <.0001 |
Abbreviations: LHDLC, low high-density lipoprotein cholesterol; HLDLC, high low-density lipoprotein-cholesterol; LMR, lymphocyte-to-monocyte ratio; HR, hazard ratio; 95% CI, 95% confidence interval. The effect-size estimates were calculated under the COX proportional hazards regression models.
Prognostic Nomogram
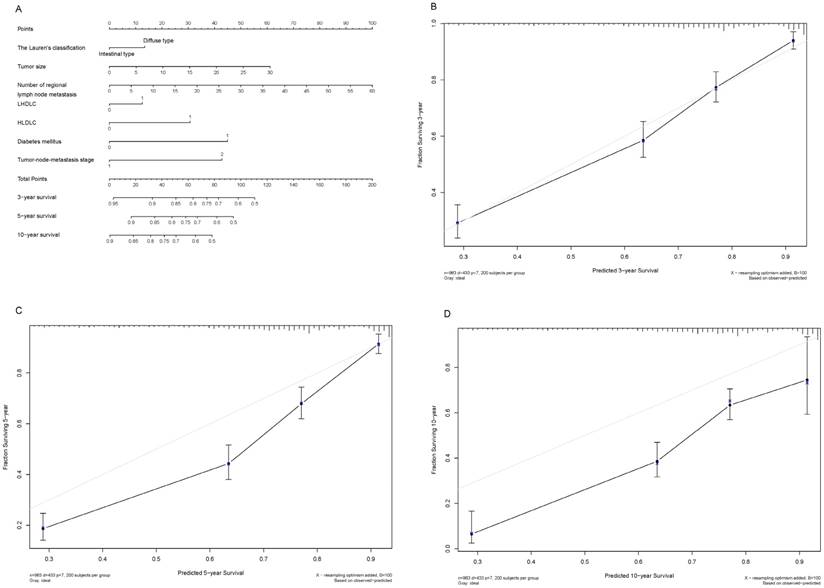
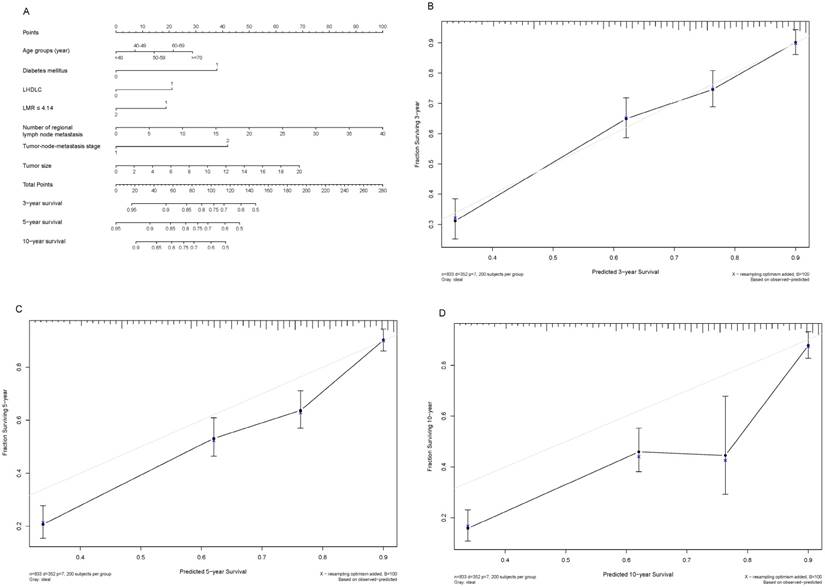
Shown in Figure 3A and Figure 4A are two prognostic nomograms predicting the probability of three-year, five-year and ten-year survival after radical gastrectomy in the “O+” and the “O-” groups, respectively. The corresponding calibration curves are shown in Figure 4B-4D and Figure 4B-4D. In particular, three-year survival calibration curves in both groups were perfectly fitted, indicating that pre-surgical risk factors selected can better predict the risk of early gastric cancer-specific mortality (C-index: 0.737 for the “O-” group and 0.751 for the “O+” group).
Nomogram plot and associated calibration curve in gastric cancer patients with the “O+” blood type.
Nomogram plot and associated calibration curve in gastric cancer patients with the “O-” blood type.
Discussion
To our knowledge, this study is to date the largest prospective study in an attempt to interrogate the blood type-specific prognosis of postsurgical gastric cancer-specific mortality. Via a comprehensive analysis, we found that high LDLC and diffuse type were robust indicators of poor survival in “O” blood type patients with gastric cancer who received radical gastrectomy, while in patients with the other blood types, elevated age and LMR implied worse and better prognosis, respectively.
The relationship between the antigens of “ABO” blood system and cancer development has been identified for decades [10, 22, 23]; however, little is known about the prognostic value of “ABO” blood groups in postsurgical gastric cancer patients. A recent retrospective analysis of 1412 newly diagnosed gastric cancer patients was conducted by Xu et al [24] who defined “ABO” blood groups as a single covariate to form a predictive model and found that older age and higher TNM stage were two adverse prognostic factors. Consistent with the findings by Xu et al [24], we divided age into five groups and found that mortality risk, per group increase, was 1.12-fold in the “O-” group. In addition, we observed a significant association of Lauren's classification (diffuse type) with poor prognosis of the “O” blood type patients after surgery, and that LDLC and LMR can respectively predict the survival in the “O+” and “O-” groups. The exact mechanism underlying the relationship between “ABO” blood types and gastric cancer prognosis is not entirely understood. Possible actions include inflammation, immunosurveillance of tumor cell lines, membrane signaling and intracellular adhesion [25].
Previous evidence indicated that carbohydrate moieties shown on the surface of red blood cells and expressed on membrane lipids and proteins can determine the “ABO” blood types [5]. The antigens of “ABO” blood groups are glycosyltransferases encoded by “A”, “B”, and “O” alleles with diverse substrate specificities that are overexpressed on gastrointestinal cells [26]. An experimental study by Boren et al indicated that specific blood type antigen mediated the attachment to human gastric mucosa of Helicobacter pylori (H. pylori), the main cause of chronic active gastritis, gastric and duodenal, ulcers and gastric adenocarcinoma [27]. So individuals with “O” blood type may bound significantly more H. pylori and exhibit greater inflammatory response than individuals with the other blood types [28, 29]. As the pathogenesis of peptic ulcer and gastric cancer is closely associated with H. pylori infection, it is reasonable to expect that the prognosis is related to specific risk factors in biological ways for gastric cancer patients with or without “O” blood type.
To predict the blood type-specific prognosis more accurately and qualified risk estimates, a visualized method, nomogram, was employed (Fig. 2, Fig. 3). The nomogram is well known for its superior accuracy than conventional staging systems and is adopted to predict the prognosis of various cancer, including gastric cancer [30, 31]. Using this method, we generated a nomogram to predict the 3-year, 5-year, and 10-year survival rates in gastric cancer patients receiving radical gastrectomy in blood type “O+” and “O-” groups, respectively. The nomogram performed well in 3-year survival prediction for both groups.
Some limitations of this study should be acknowledged. First, the status of H. pylori was unavailable, and so the possible role of this risk factor could play in the prognosis in patients with different blood types remained an open question. Second, all study patients were consecutively enrolled in ten years, and during this period the technical advances could engender selection bias. Third, therapies including radiation and chemotherapy were not involved in the analysis, because patients in diverse age groups may prefer certain treatment or effectiveness of the therapy may differ. Fourth, the conclusions of this prospective study was based on single-center, and it will of interest to validate our findings in other independent prospective studies. Last but not the least, all study patients are Han Chinese, which may confine the generalizability of our results to other nationalities or races. We agree that further studies in other groups are warranted.
In conclusion, our findings indicated that the prognostic factors differed between postsurgical gastric cancer patients with “O+” and “O-” blood types. Specifically, for patients with gastric cancer, high LDLC and diffuse type were robust indicators of poor survival in “O” blood type patients with gastric cancer who received radical gastrectomy, while in patients with the other blood types, elevated age and LMR implied worse and better prognosis, respectively.
Supplementary Material
Supplementary tables.
Acknowledgements
Funding
This study was financially supported by the Natural Science Foundation of Fujian Province (grants no. 2015J01451, 2016J01508) and the Training Project for Young and Middle-Aged Core Talents of Health System of Fujian Province (grants no. 2015-ZQN-JC-7, 2015-ZQN-JC-22) and the National Clinical Key Specialty Construction Program of China (grant no. 2013-544).
Availability of Data and Materials
The datasets used and/or analyzed during the current study are available from the corresponding author on reasonable request.
Competing Interests
The authors have declared that no competing interest exists.
References
1. Graham DY. Helicobacter pylori update: gastric cancer, reliable therapy, and possible benefits. Gastroenterology. 2015;148:719-31 e3
2. Chen W, Zheng R, Baade PD, Zhang S, Zeng H, Bray F. et al. Cancer statistics in China, 2015. CA: a cancer journal for clinicians. 2016;66:115-32
3. Zong L, Abe M, Seto Y, Ji J. The challenge of screening for early gastric cancer in China. Lancet. 2016;388:2606
4. Franchini M, Favaloro EJ, Targher G, Lippi G. ABO blood group, hypercoagulability, and cardiovascular and cancer risk. Critical reviews in clinical laboratory sciences. 2012;49:137-49
5. Calafell F, Roubinet F, Ramirez-Soriano A, Saitou N, Bertranpetit J, Blancher A. Evolutionary dynamics of the human ABO gene. Hum Genet. 2008;124:123-35
6. Wu T, Ma XA, Wang GQ, Li Q, Li MJ, Guo JY. et al. ABO blood type correlates with survival in hepatocellular carcinoma following hepatectomy. Scientific reports. 2017;7:4412
7. Wolpin BM, Chan AT, Hartge P, Chanock SJ, Kraft P, Hunter DJ. et al. ABO blood group and the risk of pancreatic cancer. Journal of the National Cancer Institute. 2009;101:424-31
8. Hsiao LT, Liu NJ, You SL, Hwang LC. ABO blood group and the risk of cancer among middle-aged people in Taiwan. Asia-Pacific journal of clinical oncology. 2015;11:e31-6
9. Edgren G, Hjalgrim H, Rostgaard K, Norda R, Wikman A, Melbye M. et al. Risk of gastric cancer and peptic ulcers in relation to ABO blood type: a cohort study. American journal of epidemiology. 2010;172:1280-5
10. Li B, Tan B, Chen C, Zhao L, Qin L. Association between the ABO blood group and risk of common cancers. J Evid Based Med. 2014;7:79-83
11. Xu YQ, Jiang TW, Cui YH, Zhao YL, Qiu LQ. Prognostic value of ABO blood group in patients with gastric cancer. Journal of Surgical Research. 2016;201:188
12. Aird I, Bentall HH, Robert JAF, Roberts JAF. A Relationship Between Cancer Of Stomach And The Abo Blood Groups. British Medical Journal. 1953;1:799
13. Lee HH, Wu HY, Chuang YC, Chang AS, Chao HH, Chen KY. et al. Epidemiologic characteristics and multiple risk factors of stomach cancer in Taiwan. Anticancer Research. 1990;10:875
14. Hu D, Zhang H, Lin X, Chen G, Li C, Liang B. et al. Elevated preoperative neutrophil-to-lymphocyte ratio can predict poor survival in early stage gastric cancer patients receiving radical gastrectomy: The Fujian prospective investigation of cancer (FIESTA) study. Journal of Cancer. 2017;8:1214-22
15. Peng F, Hu D, Lin X, Chen G, Liang B, Li C. et al. The monocyte to red blood cell count ratio is a strong predictor of postoperative survival in colorectal cancer patients: The Fujian prospective investigation of cancer (FIESTA) study. J Cancer. 2017;8:967-75
16. Peng F, Hu D, Lin X, Chen G, Liang B, Zhang H. et al. Analysis of Preoperative Metabolic Risk Factors Affecting the Prognosis of Patients with Esophageal Squamous Cell Carcinoma: The Fujian Prospective Investigation of Cancer (FIESTA) Study. EBioMedicine. 2017;16:115-23
17. Hu D, Peng F, Lin X, Chen G, Zhang H, Liang B. et al. Preoperative Metabolic Syndrome Is Predictive of Significant Gastric Cancer Mortality after Gastrectomy: The Fujian Prospective Investigation of Cancer (FIESTA) Study. EBioMedicine. 2017;15:73-80
18. Hu D, Lin X, Chen Y, Chang Q, Chen G, Li C. et al. Preoperative blood-routine markers and prognosis of esophageal squamous cell carcinoma: The Fujian prospective investigation of cancer (FIESTA) study. Oncotarget. 2017;8:23841-50
19. Peng F, Hu D, Lin X, Chen G, Liang B, Zhang H. et al. Preoperative metabolic syndrome and prognosis after radical resection for colorectal cancer: The Fujian prospective investigation of cancer (FIESTA) study. Int J Cancer. 2016;139:2705-13
20. Hu D, Peng F, Lin X, Chen G, Liang B, Li C. et al. The elevated preoperative fasting blood glucose predicts a poor prognosis in patients with esophageal squamous cell carcinoma: The Fujian prospective investigation of cancer (FIESTA) study. Oncotarget. 2016;7:65247-56
21. Edge SB, Compton CC. The American Joint Committee on Cancer: the 7th edition of the AJCC cancer staging manual and the future of TNM. Annals of surgical oncology. 2010;17:1471-4
22. Nakao M, Matsuo K, Ito H, Shitara K, Hosono S, Watanabe M. et al. ABO genotype and the risk of gastric cancer, atrophic gastritis, and Helicobacter pylori infection. Cancer epidemiology, biomarkers & prevention: a publication of the American Association for Cancer Research, cosponsored by the American Society of Preventive Oncology. 2011;20:1665
23. Aird I, Bentall HH, Roberts JAF. Relationship Between Cancer of Stomach and the ABO Blood Groups. British Medical Journal. 1953;1:799
24. Xu YQ, Jiang TW, Cui YH, Zhao YL, Qiu LQ. Prognostic value of ABO blood group in patients with gastric cancer. The Journal of surgical research. 2016;201:188-95
25. Nozoe T, Ezaki T, Baba H, Kakeji Y, Maehara Y. Correlation of ABO blood group with clinicopathologic characteristics of patients with esophageal squamous cell carcinoma. Diseases of the esophagus: official journal of the International Society for Diseases of the Esophagus. 2004;17:146-9
26. Le Pendu J, Marionneau S, Cailleau-Thomas A, Rocher J, Le Moullac-Vaidye B, Clement M. ABH and Lewis histo-blood group antigens in cancer. APMIS: acta pathologica, microbiologica, et immunologica Scandinavica. 2001;109:9-31
27. Boren T, Falk P, Roth KA, Larson G, Normark S. Attachment of Helicobacter pylori to human gastric epithelium mediated by blood group antigens. Science. 1993;262:1892-5
28. Alkout AM, Blackwell CC, Weir DM. Increased Inflammatory Responses of Persons of Blood Group O to Helicobacter pylori. Journal of Infectious Diseases. 2000;181:1364
29. Alkout AM, Blackwell CC, Weir DM, Poxton IR, Elton RA, Luman W. et al. Isolation of a cell surface component of Helicobacter pylori that binds H type 2, Lewis(a), and Lewis(b) antigens. Gastroenterology. 1997;112:1179-87
30. Deng Q, He B, Gao T, Pan Y, Sun H, Xu Y. et al. Up-Regulation of 91H Promotes Tumor Metastasis and Predicts Poor Prognosis for Patients with Colorectal Cancer. Plos One. 2014;9:e103022
31. Touijer K, Scardino PT. Nomograms for staging, prognosis, and predicting treatment outcomes. Cancer. 2009;115:3107-11
Author contact
![]() Corresponding author: Wenquan Niu, Ph.D. Address: No. 2 Yinghua East Street, Chaoyang District, Beijing 100029, China. Tel & Fax: 86-01-8420 6414. E-mail: niuwenquan_shcncom or niuwenquancom.cn.
Corresponding author: Wenquan Niu, Ph.D. Address: No. 2 Yinghua East Street, Chaoyang District, Beijing 100029, China. Tel & Fax: 86-01-8420 6414. E-mail: niuwenquan_shcncom or niuwenquancom.cn.