Impact Factor ISSN: 1837-9664

 Global reach, higher impact
J Cancer 2018; 9(14):2492-2501. doi:10.7150/jca.25257 This issue Cite
Research Paper
MCT1 regulates aggressive and metabolic phenotypes in bladder cancer
Guiming Zhang ![]() , Yongjian Zhang, Dahai Dong, Fangming Wang, Xiaocheng Ma, Fengju Guan, Lijiang Sun
, Yongjian Zhang, Dahai Dong, Fangming Wang, Xiaocheng Ma, Fengju Guan, Lijiang Sun
Department of Urology, The Affiliated Hospital of Qingdao University, Qingdao, China
Received 2018-1-31; Accepted 2018-4-28; Published 2018-6-15
Abstract
Background: Monocarboxylate transporter isoform 1 (MCT1) is an important molecule in mediating lactate transportation. Recent studies have shown an oncogenic role of MCT1 in cancer development.
Methods: In this study, we aimed to investigate the expression and role of MCT1 in bladder cancer (BCa). MCT1 expression was detected in 124 BCa tissues and their clinicopathological significance was analyzed. We also used The Cancer Genome Atlas database to explore the prognostic association of MCT1 with BCa. Cell proliferation, migration and invasion assays were performed on BCa cells in which MCT1 was downregulated. The effect of MCT1 on BCa cell aerobic glycolysis, as well as its association with HIF-1α, was tested.
Results: We found that high MCT1 expression correlated with lymph node and distant metastasis. Patients with high-MCT1 expression showed shorter overall survival than those with low-MCT1 expression. Knockdown of MCT1 inhibited BCa cell proliferation, migration and invasion, and affected expression of epithelial-mesenchymal transition related proteins. Downregulation of MCT1 decreased lactate levels in cell medium, as well as HK2, GLUT1 and LDHB expression. In addition, MCT1 expression was partly dependent on HIF-1α.
Conclusions: Taken together, our study has shown a prognostic role of MCT1 in BCa, and provided potential diagnostic and therapeutic options for BCa patients.
Keywords: Bladder cancer, MCT1, EMT, Aerobic glycolysis, HIF-1α
Introduction
Bladder cancer (BCa) is the sixth most commonly diagnosed cancer in male, while it drops to ninth when both genders are considered. The worldwide age-standardized incidence rate of BCa is 9.0 for males and 2.2 for females (per 100,000 person/years) [1]. Approximately 75% of BCa patients present with a disease of non-muscle invasive (NMI), which is characterized by high recurrence rate [2]; the remaining patients indicate a phenotype of muscle-invasive (MI) cancer. Radical cystectomy with pelvic lymphadenectomy and/or perioperative chemotherapy is the standard treatment for high-risk NMI and MI BCa. However, despite advances in therapeutic strategy, the long-term oncological outcome of BCa is not satisfactory. Therefore, BCa disease mechanisms and potential treatment regimen warrant urgent research.
Tumor progression and metastasis are complicated process in which epithelial-mesenchymal transition (EMT) plays a critical role in the early stage. In this process the epithelial cells undergo multiple biological changes that enable them to lose their epithelial-like phenotype (such as cell-cell basement membrane contacts and structural polarity) and to assume the mesenchymal phenotype (such as enhanced migratory capacity, invasiveness and increased production of extracellular matrix components). The acquisition of several mesenchymal molecules such as N-cadherin and vimentin, as well as the loss of epithelial cell adhesion molecules such as E-cadherin, is the typical event involved in EMT [3]. Recent studies indicated that EMT participated in various biological behaviors of BCa, and contributed to drug resistance in the later stage and ultimately metastasis [4-6].
Aerobic glycolysis, termed as the Warburg effect, is a hallmark of cancer phenotype. It means that cancer cells produce energy via the conversion of glucose into lactate, even with sufficient oxygen. Through the Warburg effect, cancer cells are provided with not only ATP and nutrients, but also an acidic environment which facilitates the destruction of extracellular matrix and tumor metastasis. As a consequence of the Warburg effect, cancer cells would generate large amounts of lactate. The production and removal of lactate may also be considered as an important signal transduction pathway in cancer metabolism [7]. Through several transduction molecules, lactate is exchanged on quantitative bases between and with cell compartments. Monocarboxylate transporter (MCT) family (MCT1-MCT4) has been found to play a critical role in mediating lactate transportation. Among the MCT family, MCT1 and MCT4 have triggered researchers' attention, and increased expression of MCT1 and MCT4 has been reported recently in several malignancies [8,9]. Kim et al. reported that high expression of MCT1 was associated with worse progression-free survival in clear cell renal cell carcinoma [10]. Our previous study has observed that cancer-associated fibroblasts (CAFs) could interact with BCa T24 cells and promote tumor progression, accompanied with the upregulation of MCT1 and MCT4 in expression in CAFs [11]. However, the effect and mechanism of MCT1 on BCa have not been deeply studied so far. In this study, we focused on MCT1 expression as well as its functional consequences in BCa.
Material and Methods
Patients and tissue samples
BCa patients' information was collected from two cohorts: The Affiliated Hospital of Qingdao University (AHQDU) cohort (QD cohort) and The Cancer Genome Atlas cohort (TCGA cohort). QD cohort included 124 BCa patients who underwent surgical treatment between January 2009 and December 2010 at AHQDU. Clinicopathological data were collected from medical records. All patients were pathological confirmed with urothelial carcinoma and did not receive neoadjuvant therapy. For immunohistochemical (IHC) staining study, BCa tissues of QD cohort were acquired from Department of Pathology at AHQDU. Staging and grading systems were adopted with UICC TNM classification (2009, version 7) and WHO 2004 grading system. Written informed consent was obtained from each patient before participation and the study protocol was approved by The Institutional Research Review Boards of AHQDU. Gene expression data by RNA-seq for TCGA cohort including 426 BCa cases which have available clinical outcome data were extracted from TCGA (https://cancergenome.nih.gov/).
Immunohistochemistry
IHC staining was performed as described previously [12]. In brief, formalin-fixed paraffin-embedded sections were de-paraffinized, rehydrated and washed in Phosphate Buffer solution. After antigen retrieval in 10 mM sodium citrate buffer, blocking of peroxidase activity with 3% H2O2, and non-specific protein blocking using 10% goat seum, sections were incubated with primary antibodies (anti-MCT1 at a dilution of 1:100, Abcam, Cambridge, MA, USA), followed by anti-mouse/rabbit horseradish peroxidase-labeled antibody (Univ-bio, Shanghai, China) as the second antibody. Membranous and cytoplasmic MCT1 expression was observed, and the evaluation of MCT1 staining was defined considering the sum score of the proportion of positively stained cells (0, 0% of positive cells; 1, <5% of positive cells; 2, 5-50% positive cells; 3, >50% of positive cells) and the intensity of the staining (0, negative; 1, weak; 2, intermediate; 3, strong) as described previously [13]. MCT1 staining was scored as 0 (sum score 0), 1 (sum score 1, 2), 2 (sum score 3, 4), and 3 (sum score 5, 6). Score of 0 and 1 were considered as low expression, while 2 and 3 were as high expression.
Cell culture
The human BCa cell lines T24, 5637, J82 and SW780 were obtained from the Institute of Cell Research of the Chinese Academy of Sciences (Shanghai, China). T24 and 5637 were cultured in RPMI1640 medium, J82 in MEM medium and SW780 in L-15 medium respectively, all containing 10% fetal bovine serum. Cells were cultured at 37°C at 5% CO2. To study the effect of hypoxia on cultured cells, cells were placed in an incubator containing 1% O2 and 5% CO2.
RNA extraction and quantitative real-time polymerase chain reaction (qRT-PCR)
Total RNA from cells was extracted using TRIzol reagent. First strand cDNA was synthesized using the RevertAid First Strand cDNA synthesis Kit (Life technology, Carlsbad, CA, USA). The expression levels of MCT1 and β-actin were determined using the Power SYBR Green PCR Master Mix (Invitrogen, Carlsbad, CA, USA) by an ABI 7900HT Real-time PCR system. All tests were run in triplicate. The primer sequences were listed as follows: MCT1-forward: 5'-CATGCCACCACCAGCGAAG-3', reverse: 5'-TGACAAGCAGCCACCAACAATC-3'; β-actin-forward: 5'-ACCGAGCGCGGCTACAG-3', reverse: 5'-CTTAATGTCACGCACGATTTCC-3'.
siRNA transfection
The sequence of the (hypoxia-inducible factor) HIF-1α-targeted siRNA (5'-CTACTCAGGACACAGATTTAGACTTGGAG-3') was chosen from three pairs of siRNAs (chemically synthesized in Genepharma, Shanghai, China) because of the high efficiency in reducing MCT1 expression at mRNA level. siRNA transfection was carried out using Lipofectamine 2000 (Invitrogen, Carlsbad, CA, USA) according to the manufacturer's instruction. Briefly, cells were seeded in 6-well plate and incubated overnight. Then the transfection complex including diluted siRNA and Lipofectamine 2000 was added to the plate, followed by continued culture for 48 hours. At last, cells were harvested for further experiments.
Establishment of stable transfection cell lines
The shRNA against MCT1 was introduced into the PLKO.1 vector to generate PLKO.1-shMCT1. The sequences of shRNA for MCT1 were shown in Table S 1. For establishment of knockdown stable cells, PLKO.1-shMCT1 was mixed with psPAX2 and PMD2-G and transfected into HEK293T cells using Lipofectamine 2000 reagent. Forty-eight hours after transfection, lentivirus was harvested and used to infect BCa cells. Infected cells were selected using puromycin (2 μg/ml) to acquire stable cell clones for further experiments.
In vitro cell proliferation, migration and invasion assays
In vitro cell proliferation was assessed using CCK8 assay as described previously [14]. Wound healing assay was performed to evaluate cell migration: cells were seeded in a monolayer in 6‑well plates. When the cells reached 90% confluency, manual scratch with a pipette tip was made to form a wound, then cells were observed under inverted microscope at the indicated time points respectively. Cell invasion assay was performed using a Transwell system: the upper chambers which has been seeded with cells were coated with Matrigel (BD Biosciences, Franklin Lakes, NJ, USA) diluted with serum-free medium. The lower chamber was filled with medium containing 10% FBS. After incubation at 37℃ for 48 h, successfully translocated cells were fixed and stained with 0.5% crystal violet. Invaded cells of three random visual fields were counted under inverted microscope, and calculated by average.
Xenografted nude mice model
Five 4-6-week-old male BALB/c nude mice were prepared for in vivo tumorigenesis evaluation. Cells were paired injected subcutaneously into forelimbs of the same mouse. Tumor sizes were measured using calipers at least three times weekly. All mice were euthanized with CO2 25 days postinoculation. Tumor volume was calculated and tumor weight was measured after sacrifice. Animal experiments were carried out under protocols approval by the Animal Studies Ethics Committee of AHQDU.
Lactate measurement
For lactate measurement in cell culture medium, EnzyChromTM Lactate Assay kit (ECLC-100) (BioAssay Systems, Hayward, USA) was used according to the manufacturer's protocol. In brief, using a series of lactate solution with certain concentration, the standard curve was drawn. Cells were seeded in 12-well plates and cultured for 48h, then 20 μl culture media were collected and detected using spectrophotometry at 565 nm. Results were normalized for total cell number.
Western blot analysis
The procedure was detailed previously [14]. In brief, cell protein samples were extracted and quantified using the CelLytic extraction kit supplemented with protease inhibitors (Roche, Basel, Switzerland) and the BCA Protein Assay reagent kit (Thermo Fisher Scientific, Waltham, MA, USA) according to the manufacturer's instruction, respectively. Equal amounts of samples were separated by 10% sodium dodecyl sulfate polyacrylamide gel electrophoresis and transferred to a polyvinylidene fluoride membrane. The membrane was incubated at 4℃overnight with primary antibodies, then followed by anti-rabbit horseradish peroxidase as second antibody. Signals were visualized using the ECL PlusWestern Blotting System (Thermo Fisher Scientific, Waltham, MA, USA). GAPDH was used as loading controls.
Statistical analysis
Continuous variables were expressed as mean values ± SD and compared by Student's t test. Categorical variables was compared by chi-squared test. Overall survival (OS) was analyzed using Kaplan-Meier curves and compared using log-rank test. All statistical analyses were performed by STATA 12.0, and two-sided P values <0.05 were considered to indicate statistical significance.
Results
MCT1 expression is associated with BCa prognosis
In this study, QD cohort comprised 100 male (80.6%) and 24 (19.4%) female patients, with a median age at diagnosis of 65 years (range from 30-88 years). Low-grade tumors were observed in 5 cases, while high-grade tumors in 119 cases. Seventy-one patients presented with non-muscle invasive diseases and 53 cases with muscle-invasive diseases. Lymph node metastasis was found in 37 patients, and 9 patients showed distant metastasis at diagnosis. With respect to the TCGA cohort, 421 of 426 patients had muscle-invasive tumors, 138 and 12 patients had lymph node and distant metastases respectively. The demographic and pathological characteristics of all subjects, including QD cohort and TCGA cohort are listed in Table 1.
Demographic and pathological characteristics of subjects in QD cohort and TCGA cohort.
| QD cohort | TCGA cohort | |||
|---|---|---|---|---|
| (n=124) | (n=426) | |||
| age (years) | median (range) | 65 (30-88) | 69 (34-90) | |
| sex | male | 100 | 311 | |
| female | 24 | 115 | ||
| smoking status | yes | 68 | 178 | |
| no | 56 | 248 | ||
| grade | low | 5 | 21 | |
| high | 119 | 398 | ||
| missing | 0 | 7 | ||
| T stage | Tx | 0 | 1 | |
| T0 | 0 | 1 | ||
| T1 | 71 | 3 | ||
| T2 | 25 | 155 | ||
| T3 | 17 | 205 | ||
| T4 | 11 | 61 | ||
| N stage | Nx | 0 | 36 | |
| N0 | 87 | 246 | ||
| N1-N3 | 37 | 138 | ||
| missing | / | 6 | ||
| M stage | Mx | 0 | 180 | |
| M0 | 115 | 232 | ||
| M1 | 9 | 12 | ||
| missing | / | 2 | ||
| history of chemotherapy | yes | 42 | 35 | |
| no | 82 | 51 | ||
| missing | / | 340 | ||
| history of radiotherapy | yes | 12 | 25 | |
| no | 112 | 64 | ||
| missing | / | 337 |
IHC staining shown that MCT1 expression were increased in 53 (42.7%) patients (Figure 1A-D). No significant differences in age, sex, smoking status, history of chemotherapy/radiotherapy were observed between patients with high and low MCT1 expression. High MCT1 expression correlated with lymph node metastasis (P=0.022, Figure 1E) and distant metastasis (P=0.005, Figure 1F), whereas did not significantly correlated with tumor grade and T stage.
MCT1 expression is associated with BCa metastasis and poor prognosis. Immunohistochemical (IHC) staining showed (A) 3+, (B) 2+, (C) 1+ and (D) negative expression of MCT1 in BCa tissue (magnification, x400); MCT1 expression was higher in patients with (E) lymph node metastasis and (F) distant metastasis; High MCT1 expression was associated with poorer prognosis in both (G) QD cohort and (H) TCGA cohort.
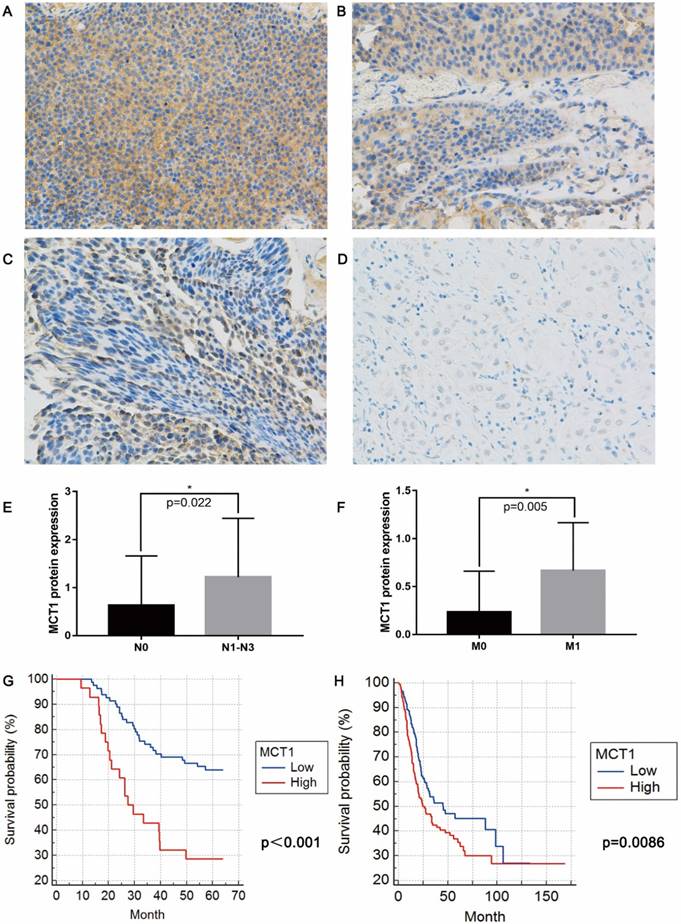
For 124 patients in the QD cohort, the median follow-up period was 50.8 months (range from 9-64 months), and median survival was 48.9 months. The high-MCT1 group had significantly shorter OS (median OS 36.2 months) than did the low-MCT1 group (median OS 51.6 months)(P<0.001, Figure 1G). For the TCGA cohort, MCT1 expression was presented with mRNA levels. According to the median level of MCT1 expression, all patients were also divided into high-MCT1 group and low-MCT1 group. The median survival was 32.5 months. As shown in Figure 1H, the high-MCT1 group also indicated shorter OS (median OS 24.6 months) than did the low-MCT1 group (median OS 44.9 months)(P=0.0086).
MCT1 inhibits the viability of BCa cells in vitro and in vivo
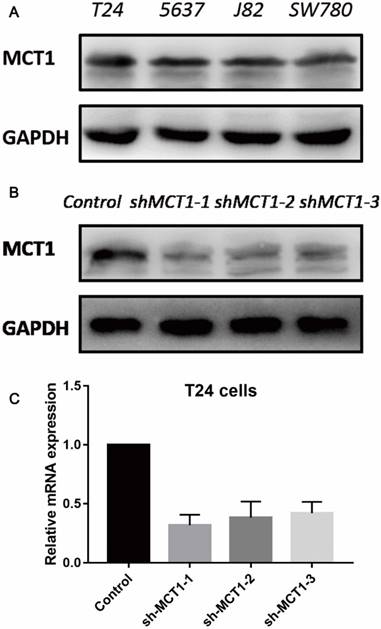
To evaluate the function of MCT1 in BCa cells, we measured the protein expression of MCT1 in four human BCa cell lines (T24, 5637, J82 and SW780). As shown in Figure 2A, all the four cell lines expressed MCT1 and there was relatively higher expression of MCT1 in T24 cells. Then we used lentivirus-mediated silencing of MCT1 in T24 cells. The efficiency of knockdown was verified by western blotting (Figure 2B and C).
MCT1 expression profiles in human BCa cell lines and MCT1 knockdown T24 cells. (A) MCT1 expression was detected in four human BCa cell lines by western blot; Lower expression of MCT1 protein and mRNA in MCT1 knockdown T24 cells using (B) western blot and (C) RT-PCR.
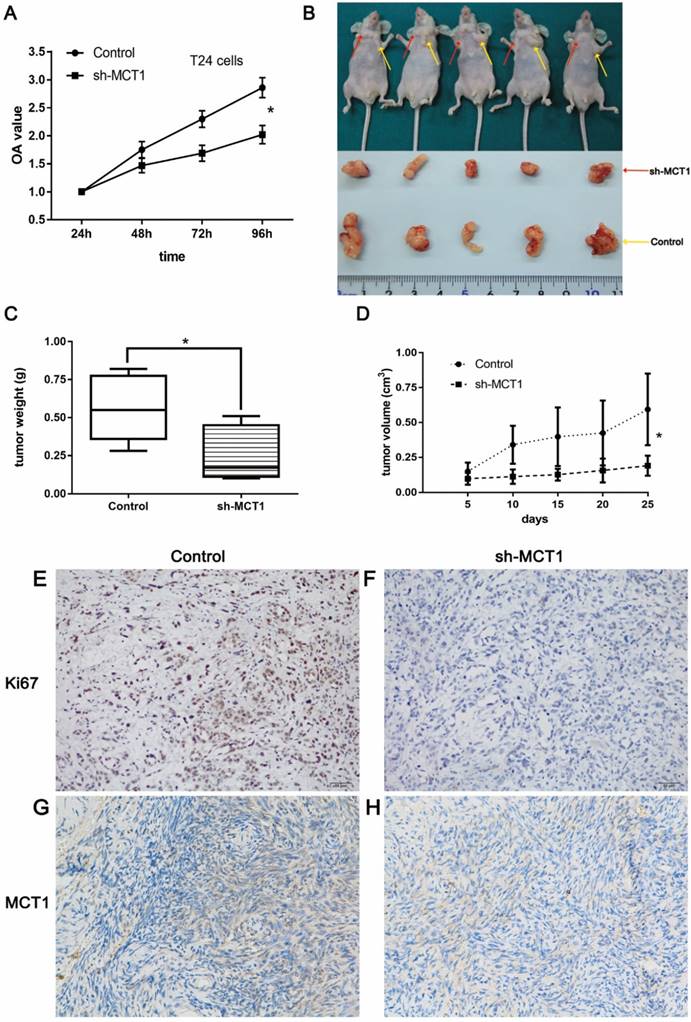
The CCK-8 assay was performed to examine the effect of MCT1 on BCa cell viability in vitro. As shown in Figure 3A, knockdown of MCT1 inhibited cell proliferation with statistical significance (P<0.05). To validate our observation and assess the role of MCT1 in BCa tumorigenic potential, we used nude mice model by subcutaneous injection sh-MCT1 T24 cells and Scramble/sh-MCT1 cells. The results indicated that tumors derived from sh-MCT1 cells were obviously lighter and smaller than those derived from control cells (Figure 3B-D). MCT1 and Ki67 expressions were also tested in tumor samples obtained from sacrificed mice by IHC. As expected, the expression of both MCT1 and Ki67 was downregulated significantly in sh-MCT1 cells compared with the controls (Figure 3E-H).
MCT1 knockdown significantly inhibits BCa cell proliferation in vitro and in vivo. (A) CCK-8 assays were performed to measure cell proliferation in BCa cells; (B) BCa cells were paired injected subcutaneously into forelimbs in BALB/c nude mice. The tumour mass (C) and volume (D) were significantly lower in sh-MCT1 group than in the control group (*P<0.05). IHC staining indicated lower MCT1 (E, F) and Ki67 (G, H) expression in tumours derived from sh-MCT1 cells than those derived from control cells.
MCT1 affects BCa cell migration and invasion in vitro
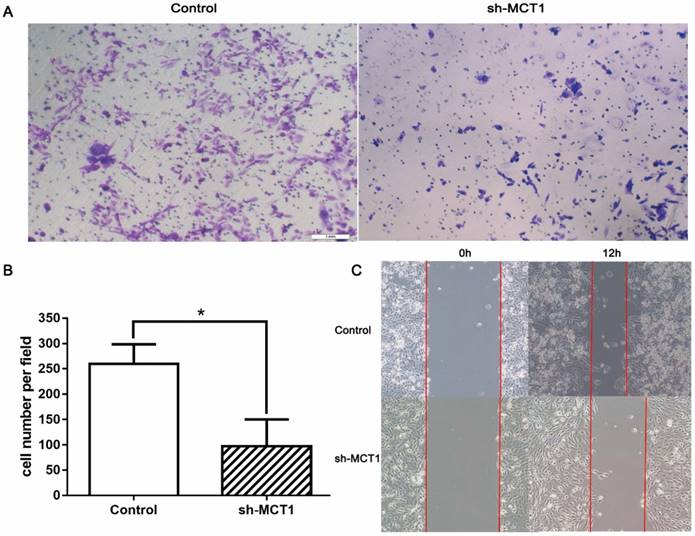
Transwell chamber assay and wound-healing assay were carried out to determine whether silencing MCT1 affected cell invasion and migration in vitro. We found that MCT1 downregulation notably inhibited the invasive capacity of T24 cells compared with the control cells (P<0.05; Figure 4A and B). Wound‑healing assay demonstrated that cell migration of sh-MCT1 cells was markedly reduced 12 h after wound creation (Figure 4C). These results indicate that knockdown of MCT1 inhibits BCa cell invasion and migration in vitro.
Knockdown of MCT1 inhibits BCa cell migration and invasion in vitro. (A, B) Transwell assays were carried out to assess to effect of MCT1 on BCa cell invasion (*P<0.05). (C) Wound healing assays were performed following MCT1 knockdown in the indicated cells.
To investigate whether EMT mediated the role of MCT1 in BCa cell migration and invasion, several EMT markers were measured using western blotting. As expected, MCT1 knockdown increased E-cadherin expression and decreased expression of N-cadherin, vimentin and Snail (Figure 5A).
MCT1 affects EMT, aerobic glycolysis in BCa cells, and is associated with HIF-1α expression. (A) Western blot analyses of several EMT markers and glycolytic genes, including E-cadherin, N-cadherin, Vimentin, Snail, HK2, GLUT1 and LDHB in MCT1 knockdown BCa cells. (B) The lactate levels in MCT1 knockdown cell medium decreased compared with the control (*P<0.05). (C) Western blot analyses indicated MCT1 expression was associated with HIF-1α.
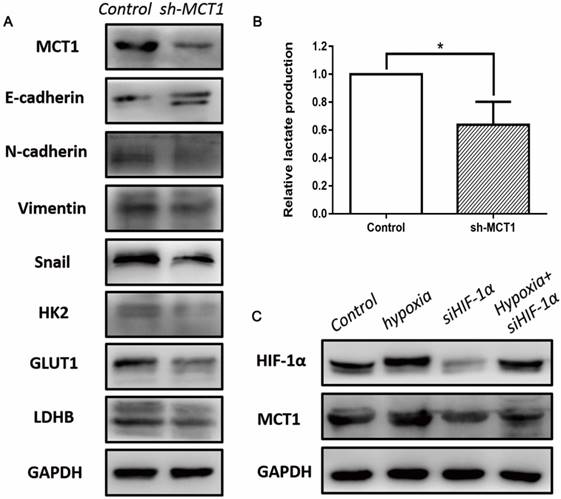
MCT1 affects aerobic glycolysis in BCa cells in vitro
To better understand the role of MCT1 in Warburg effect in BCa cells, we performed lactate production assay that is commonly used to reflect the glucose usage of cancer cells. As shown in Figure 5B, the concentration of lactate decreased in sh-MCT1 cell medium compared with the control. Moreover, we detected several key glycolytic genes which are involved in glucose metabolism, including HK2, GLUT1 and LDHB. In keeping with the glucose usage analysis, these three genes were downregulated in the presence of MCT1 (Figure 5A).
MCT1 expression is associated with HIF-1α
It has been demonstrated that HIF-1α is a key regulator of glucose metabolism transformation [15]. To explore whether MCT1 expression in BCa cells is correlated with HIF-1α, we examined the expression of HIF-1 and MCT1 under hypoxia. As indicated in Figure 5C, MCT1 and HIF-1α expression levels were markedly up-regulated by incubation under hypoxia. Silencing HIF-1α expression using siRNA reduced HIF-1α level notably, as well as decreased MCT1 level compared with the control group. These changes were partly reversed when HIF-1α-silenced T24 cells were cultured under hypoxia.
Discussion
The present study indicates that increased expression of MCT1 protein is closely associated with lymph node and distant metastases in BCa patients. Higher MCT1 expression represents poorer prognosis for BCa patients. This prognostic role is also validated in the TCGA cohort. Through in vitro and in vivo experiments, we found that downregulation of MCT1 inhibits BCa cell proliferation, migration and invasion. Its oncogenic function is exerted by affecting EMT and aerobic glycolysis. In addition, our observations link MCT1 to HIF-1α, demonstrating that MCT1 plays an important role in BCa carcinogenesis.
MCT1 is located at the chromosome 1p12-13. As a representative rate-limiting enzyme, it can facilitate lactate entry into or efflux out of cells depending on cellular glucose metabolism [16]. CD147 has been demonstrated to serve as a chaperone to MCT1, and its expression is required for cell surface expression and function of MCT1. Le Floch et al. reported that CD147-MCT1 is critical for energetics and growth of glycolytic tumors [9]. The roles of MCT1 in BCa have been studied recently. Afonso et al. have found the possible cooperative role of CD147 and MCT1 in resistance to cisplatin-based chemotherapy of BCa, and a marginal statistical significance of high MCT1 expression in oncological outcomes (p=0.053 for a 5-year disease-free survival; p=0.065 for a 5-year OS) [13]. A Korean research group reported that MCT1 and CD147 expressions have prognostic implications in BCa patients [17]. They found that high MCT1 expression levels correlated with high tumor grade, advanced tumor stage and lymphatic tumor invasion. However, neither of these two research groups have explored the exact ways in which MCT1 affects BCa prognosis. In line with their results, we also observed a close association between high MCT1 expression and lymphatic and distant metastases. In our QD cohort, high-MCT1 patients presented with poorer prognosis compared with low-MCT1 cases. Using the TCGA cohort, we validated our results. Although the two cohorts in our study have different baseline pathological characteristics and different detective methods, MCT1 expression represents as a prognostic indicator in both cohorts. All these results strongly suggest the possible role of MCT1 in BCa progression.
It has been reported that disease recurrence occurs in approximately 50% of BCa patients although surgery and/or chemotherapy have been developed in recent years, and the 5-year OS rate is only 6% for those who develop or present with distant metastasis [18]. EMT is considered to be critical in cancer invasion and metastatic progression. In our study, we observed that knockdown of MCT1 resulted in increased expression of epithelial markers and decreased expression of mesenchymal markers. These findings provided evidence that MCT1 might be a regulator of EMT and thereby promoted migration and invasion of BCa cells.
The Warburg effect has been highlighted in recent cancer studies. Through the Warburg effect, excess lactate is released to the extracellular environment and decreased the extracellular pH. This acidic environment provides a growth advantage for cancer cells [19]. The high glycolytic flux depends on the overexpression of glycolysis-related genes. To date, numerous studies have investigated the role of glucose metabolism in cancer development, and several inhibitors targeting glucose uptake and glycolysis are available, however, very few are focused in BCa. Our previous studies revealed a series of changes of metabolic reprogramming in the context of tumor microenvironment. We found that CAFs and tumor endothelial cells in tumor microenvironment played an important role in cancer glycolysis and progression [11,20]. Targeting MCT1 in CAFs and tumor endothelial cells regulated BCa cell growth and apoptosis by altering the tumor microenvironment [20]. The present study found that knockdown of MCT1 in BCa cells significantly inhibited cell proliferation in vitro and in vivo. In addition, MCT1 affected BCa cell migration and invasion in vitro. All these results suggest that a complicated energy metabolic loop favor the proliferative and metastatic potential of BCa, by regulating metabolism transformation in the tumor microenvironment.
Hypoxia is a common feature in tumor microenvironment and proposed to underlie the development of cancer [21]. HIF-1α is a pivotal element in the response to hypoxia, and modulates the expression of many genes involved in a range of functions, such as inflammation, angiogenesis and energy metabolism [22,23]. Under the condition of hypoxia, lactate release from cancer cells may also rise. In our study, in parallel with decreased expression of MCT1, we observed reduced lactate release from BCa cells. Therefore we proposed the possibility that hypoxia can modulate the expression of MCT1 in BCa cells. We found that MCT1 expression was obviously increased under hypoxia, along with elevated HIF-1α level. Downregulation of HIF-1α resulted in decreased MCT1 expression, yet these changes were partly reversed when HIF-1α-silenced T24 cells were cultured under hypoxia. However, previous study has indicated that HIF-1 is in the promotor region of the MCT4 gene but not in the MCT1 gene, demonstrating that MCT4 gene is a target for HIF-1 [24]. Therefore, we cannot rule out that hypoxia regulates MCT1 expression through both direct and indirect mechanisms. Clearly, further studies are needed to clarify the real mechanisms by which MCT1 promotes BCa progression and metastasis.
Conclusions
In summary, our study has shown a prognostic role of MCT1 in BCa, and offered a new insight into the mechanisms of MCT1. MCT1 may have an oncogenic effect on BCa progression and metastasis through affecting EMT and aerobic glycolysis. Taken together, MCT1 may provide potential diagnostic and therapeutic options for BCa patients in the future.
Abbreviations
MCT1: Monocarboxylate transporter isoform 1
BCa: Bladder cancer
NMI: Non-muscle invasive
MI: Muscle invasive
EMT: Epithelial-mesenchymal transition
CAFs: Cancer-associated fibroblasts
AHQDU: Affiliated Hospital of Qingdao University
TCGA: The Cancer Genome Atlas
IHC: Immunohistochemical
qRT-PCR: Quantitative real-time polymerase chain reaction
HIF: Hypoxia-inducible factor
OS: Overall survival
Supplementary Material
Supplementary table S1.
Acknowledgements
This study was partly funded by the National Natural Science Foundation of China (Grant No. NSFC 81502195 and NSFC 81672512).
Ethics approval and consent to participate
Written informed consent was obtained from each patient before participation and the study protocol was approved by The Institutional Research Review Boards of AHQDU.
Authors' contributions
Zhang GM and Sun LJ conceived and designed the study. Zhang YJ, Dong DH, Wang FM participated in the experiments and data collecting. Ma XC performed the statistical analysis. Guan FJ finished the manuscript. All authors commented on drafts of the paper and approved the final manuscript.
Competing Interests
The authors have declared that no competing interest exists.
References
1. Cancer Today. Estimated cancer incidence, mortality and prevalence worldwide in 2015. http://gco.iarc.fr/today/home.
2. Clark PE, Agarwal N, Biagioli MC, Eisenberger MA, Greenberg RE, Herr HW. et al. Bladder cancer. Journal of the National Comprehensive Cancer Network: JNCCN. 2013;11:446-75
3. Zeisberg M, Neilson EG. Biomarkers for epithelial-mesenchymal transitions. The Journal of clinical investigation. 2009;119:1429-37
4. Yun SJ, Kim WJ. Role of the epithelial-mesenchymal transition in bladder cancer: from prognosis to therapeutic target. Korean journal of urology. 2013;54:645-50
5. McConkey DJ, Choi W, Marquis L, Martin F, Williams MB, Shah J. et al. Role of epithelial-to-mesenchymal transition (EMT) in drug sensitivity and metastasis in bladder cancer. Cancer metastasis reviews. 2009;28:335-44
6. Syed IS, Pedram A, Farhat WA. Role of Sonic Hedgehog (Shh) Signaling in Bladder Cancer Stemness and Tumorigenesis. Current urology reports. 2016;17:11
7. Brooks GA. Cell-cell and intracellular lactate shuttles. The Journal of physiology. 2009;587:5591-600
8. Walters DK, Arendt BK, Jelinek DF. CD147 regulates the expression of MCT1 and lactate export in multiple myeloma cells. Cell cycle (Georgetown, Tex). 2013;12:3175-83
9. Le Floch R, Chiche J, Marchiq I, Naiken T, Ilc K, Murray CM. et al. CD147 subunit of lactate/H+ symporters MCT1 and hypoxia-inducible MCT4 is critical for energetics and growth of glycolytic tumors. Proceedings of the National Academy of Sciences of the United States of America. 2011;108:16663-8
10. Kim Y, Choi JW, Lee JH, Kim YS. Expression of lactate/H(+) symporters MCT1 and MCT4 and their chaperone CD147 predicts tumor progression in clear cell renal cell carcinoma: immunohistochemical and The Cancer Genome Atlas data analyses. Hum Pathol. 2015;46:104-12
11. Shi H, Jiang H, Wang L, Cao Y, Liu P, Xu X. et al. Overexpression of monocarboxylate anion transporter 1 and 4 in T24-induced cancer-associated fibroblasts regulates the progression of bladder cancer cells in a 3D microfluidic device. Cell cycle (Georgetown, Tex). 2015;14:3058-65
12. Zhang GM, Luo L, Ding XM, Dong DH, Li B, Ma XC. et al. MicroRNA-126 inhibits tumor cell invasion and metastasis by downregulating ROCK1 in renal cell carcinoma. Mol Med Rep. 2016;13:5029-2036
13. Afonso J, Santos LL, Miranda-Goncalves V, Morais A, Amaro T, Longatto-Filho A. et al. CD147 and MCT1-potential partners in bladder cancer aggressiveness and cisplatin resistance. Molecular carcinogenesis. 2015;54:1451-66
14. Zhang GM, Wan FN, Qin XJ, Cao DL, Zhang HL, Zhu Y. et al. Prognostic significance of the TREK-1 K2P potassium channels in prostate cancer. Oncotarget. 2015;6:18460-8
15. Purkayastha BP, Roy JK. Cancer cell metabolism and developmental homeodomain/POU domain transcription factors: a connecting link. Cancer letters. 2015;356:315-9
16. Halestrap AP, Meredith D. The SLC16 gene family-from monocarboxylate transporters (MCTs) to aromatic amino acid transporters and beyond. Pflugers Archiv: European journal of physiology. 2004;447:619-28
17. Choi JW, Kim Y, Lee JH, Kim YS. Prognostic significance of lactate/proton symporters MCT1, MCT4, and their chaperone CD147 expressions in urothelial carcinoma of the bladder. Urology. 2014;84:245.e9-15
18. Siegel RL, Miller KD, Jemal A. Cancer statistics, 2016. CA: a cancer journal for clinicians. 2016;66:7-30
19. Vander Heiden MG, Cantley LC, Thompson CB. Understanding the Warburg effect: the metabolic requirements of cell proliferation. Science. 2009;324:1029-33
20. Hu KY, Wang de G, Liu PF, Cao YW, Wang YH, Yang XC. et al. Targeting of MCT1 and PFKFB3 influences cell proliferation and apoptosis in bladder cancer by altering the tumor microenvironment. Oncology reports. 2016;36:945-51
21. Keith B, Johnson RS, Simon MC. HIF1alpha and HIF2alpha: sibling rivalry in hypoxic tumour growth and progression. Nature reviews Cancer. 2011;12:9-22
22. Rocha S. Gene regulation under low oxygen: holding your breath for transcription. Trends in biochemical sciences. 2007;32:389-97
23. Semenza GL. Targeting HIF-1 for cancer therapy. Nature reviews Cancer. 2003;3:721-32
24. Ullah MS, Davies AJ, Halestrap AP. The plasma membrane lactate transporter MCT4, but not MCT1, is up-regulated by hypoxia through a HIF-1alpha-dependent mechanism. The Journal of biological chemistry. 2006;281:9030-7
Author contact
![]() Corresponding author: Dr. Guiming Zhang (12111230005edu.cn, No.16, Jiangsu Road, Qingdao, 266003, China. Tel: +8653282913056; Fax: +8653282911999) or Dr. Lijiang Sun (slijiang999com, No.16, Jiangsu Road, Qingdao, 266003, China. Tel: +8653282911329; Fax: +8653282911999).
Corresponding author: Dr. Guiming Zhang (12111230005edu.cn, No.16, Jiangsu Road, Qingdao, 266003, China. Tel: +8653282913056; Fax: +8653282911999) or Dr. Lijiang Sun (slijiang999com, No.16, Jiangsu Road, Qingdao, 266003, China. Tel: +8653282911329; Fax: +8653282911999).