Impact Factor ISSN: 1837-9664

 Global reach, higher impact
J Cancer 2018; 9(14):2480-2491. doi:10.7150/jca.25213 This issue Cite
Research Paper
Cry 1 Regulates the Clock Gene Network and Promotes Proliferation and Migration Via the Akt/P53/P21 Pathway in Human Osteosarcoma Cells
Lei Zhou#, Yueming Yu#, Shiwei Sun, Tieqi Zhang, Minghai Wang ![]()
The Fifth People's Hospital of Shanghai, Fudan University
# Equal contributors
Received 2018-1-29; Accepted 2018-5-1; Published 2018-6-14
Abstract
The many circadian clock genes buildup a network structure that controls physiological processes such as sleep cycle, metabolism and hormone secretion. A close relationship exists between circadian rhythm and cancers because cell cycle is affected by clock controlled genes (CCGs), including Cyclin D1, Cyclin A, Cyclin E and P21. The abnormal expression of the core circadian clock gene Cryptochrome 1 (Cry1) was found in many types of cancers. However, it is still unclear the exact mechanism of Cry1 dysregulation influences carcinogenesis and progression of cancers. In this study, we investigated the role of Cry1 in regulating proliferation and migration of Hos and U2os human osteosarcoma cells by silencing Cry1 using short hairpin RNA interference. Our data from in vitro and in vivo experiments confirmed that Cry1 knockdown enhanced proliferation and migration of osteosarcoma cells. Then, Cry2, Per1, Per2, Per3, Bmal1 and Clock were found up regulated, while Dec1, Dec2, CK1ε and Npas2 were downregulated at mRNA level. Besides, Akt/P53/P21 signaling was activated after Cry1 silencing and Akt was negatively phosphorylated along with Cry1 expression, while enhanced progression of osteosarcoma cells by Cry1 knockdown was reversed when Akt inhibitor treated. Furthermore, the rescue experiment verified the Akt/P53/P21 was downstream genes of Cry1 to control osteosarcoma progression. Taken together, these findings provide a new insight into how Cry1 regulates clock gene network and promotes proliferation and migration in a Akt dependent manner in human osteosarcoma cells.
Keywords: Cryptochrome 1, Circadian clock, osteosarcoma, signaling pathway
Introduction
The circadian clock, which exists in almost all eukaryotic organisms, is driven by the circadian timing system that consists of both central (located in the suprachiasmatic nucli, SCN) and peripheral (present in most body cells) biological oscillators[1]. Recently, researchers have got insight into the molecular mechanism of circadian clock[2, 3]. It is basically based on the canonical feedback loop of seven core circadian genes: Clock and Bmal1 that act as transcriptional activators of Cryptochrome (Cry1, Cry2) and Period (Per1, Per2, Per3), and the Cry/Per complex represses the transcription of Clock and Bmal1. Furthermore, a rather precise molecular oscillator established when the function of canonical feedback loop is modulated by additional circadian genes, such as Dec1, Dec2, Rev-Erbα, Rorα, CK1ε and Npas2 et al[4-6]. In mammals, approximately 10% of all genes are controlled by the circadian clock, such as p21, cyclin A, cyclin E, c-myc and WEE-1, known as clock controlled genes (CCGs) which regulate cell metabolism, proliferation, differentiation, DNA damage repair, apoptosis and autophagy[3, 7]. Disruption of the circadian clock causes a variety of disorders, even tumorigenesis[8]. For example, epidemiological data shows that women in nightshift had a higher risk of breast cancer, while cancer patients with irregular circadian rhythm had poor prognosis[9, 10]. In mouse model studies, experimental group mice that were rendered arrhythmic light-dark cycle or SCN ablation exhibited accelerated transplanted tumor growth rate and vigor compared with control group mice[11, 12]. These evidences suggest that there is a close relation between circadian rhythm and tumorigenesis.
Cryptochrome 1 (Cry1), one of the key circadian clock genes, plays an important role in circadian clock and clock-related diseases[13, 14]. Cryptochrome mutation mice had arrhythmic pattern, while mice under arrhythmic conditions were prone to have faster rate of implanted tumor growth rate[11]; the SCN has a high expression level of Cry1, whereas SCN-ablated mice also exhibited accelerated tumor growth rate[12]. In particular, chronic lymphocytic leukemia patients were detected elevated Cry1 transcript levels, and epigenetic silencing of Cry1 is associated with an indolent clinical course[15]. Besides, researchers found that Cry1 overexpression correlates with tumor progression and poor prognosis in patients with colorectal cancer[16]. These studies indicated that Cry1 might correlate with the onset, progression and prognosis of tumors, and understanding the molecular function of Cry1 may help improving prevention and clinical treatment. However, studies evaluating the correlation between pathogenesis of osteosarcoma with the Cry1 expression level have not been reported. Moreover, it is still unclear whether the altered level of Cry1 in osteosarcoma cells would influence the normal expression of other circadian clock genes. For this reason, we designed a series of in vitro and in vivo experiments with Cry1-knocked-down Hos and U2os human osteosarcoma cells. Our data show that after Cry1 silencing, osteosarcoma cells proliferation, migration and tumor formation were promoted and a series of changes in the clock gene network had taken place. In addition, Akt/P53/p21 signaling pathway was activated in Cry1 knockdown group and Akt phosphorylation degree increased along with Cry1 downregulation, while accelerated cell proliferation and migration in experimental group were reversed when Cry1 overexpressed or MK-2206 was used to inhibit Akt/P53/p21 signaling pathway. These findings suggest Cry1 exerts its tumor suppressive activity through activation of the Akt/P53/p21 signaling pathway.
Materials and methods
Microarray data
The gene expression profile of Gse16088 and Gse19276 was obtained from the GEO (http://www.ncbi.nlm. nih.gov/geo/) database[17, 18], which were sequenced on the GPL96 platform of Affymetrix Human Genome U133A Array and the GPL6848 platform of Whole Human Genome Oligo Microarray G4112A. The Gse16088 database includes microarray gene expression data derived from 14 human osteosarcoma tissues and 6 normal tissues. And the Gse19276 database includes microarray gene expression data derived from 23 samples of human osteosarcoma analyzed in duplicate and 5 non-malignant tissues. Data were analyzed with GEO2R web tool.
Construction and identification of lentivirus shRNA plasmids
Three plasmids including pLKO.1-EGFP-puromycin, psPAX2, and pMD2.G, which involved in the lentivirus system for short hairpin RNA (shRNA) expression, was obtained from GeneChem, CHN. To knockdown of Cry1, two Cry1 RNAi sequences were selected based on the GenBank mRNA encoding hCry1 (NM_004075) (Cry1-1, CAAGATCATAGAACTCAAT; Cry1-2, TCTGTTAACACAGACAGTA). Then, two shRNA targeting human Cry1 were designed (Table 1), annealed and inserted into the lentiviral vector pLKO.1-EGFP-puromycin.
Sequences of Cry1-shRNA
| Group | Sense strand | Antisense strand |
|---|---|---|
| Cry1-shRNA1 | 5'-ATTGAGTTCTATGATCTTGTC-3' | 5'-ATTGAGTTCTATGATCTTGTC-3' |
| Cry1-shRNA2 | 5'-TACTGTCTGTGTTAACAGAGG-3' | 5'-TACTGTCTGTGTTAACAGAGG-3' |
| Control-shRNA | 5'-TTCTCCGAACGTGTCACGT-3' | |
Lentivirus shRNA plasmid packing
In order to produce lentiviruses, lentiviral vector (pLKO.1-EGFP-puromycin), psPAX2, and pMD2.G were all added into 50-70% 293T cells with LipofectamineTM2000 (Invitrogen, USA), which was applied followed the instruction. Ten hours after transfection, the medium was changed into 10% FBS high glucose DMEM complete medium. Supernatants were collected after incubating for 2d and filtered using 0.45μm cellulose acetate filters (Millipore, USA). Three kinds of lentivirus were stored at -80°C.
Cell transfection
Hos and U2os cells were seeded into 6-well plates and infected with virus in the presence of 6μg/ml polybrene (Sigma, USA) for 24h. In order to get stable Cry1 knockdown cells, they were cultured with DMEM medium containing 4μg/mL of puromycin (Sigma, USA) in the first 3 days, and then changed into 1μg/mL of puromycin for the next week. The cells were divided into four groups respectively: two experimental groups expressing Cry1-shRNA1~2, a Control-shRNA group and a blank cell group.
Reagents and drug preparation
MK-2206 (Akt specific inhibitor) was purchased from MedChem Express (Princeton, USA). The stock solutions of MK-2206 were dissolved in dimethyl sulfoxide at the concentration of 5mg/ml, stored at -20°C, and diluted in fresh culture medium immediately before in vitro experiments.
CCK8 assay
The effect of Cry1 on cell viability of Hos and U2os cells was evaluated by applying CCK-8 kit (Dojindo, JPN) in accordance with manufacturer's instructions. Osteosarcoma cells were digested and seeded at 3*103 cells/well into 96-well plates with five replicates. The cells were cultured for 24, 48, 72, and 96 hours, then added 10μl CCK-8 reagent per well and incubated at 37°C for 2 hours respectively. The absorbance was detected at 450 nm using a Tecan Infinity 200PRO multi-well plate reader (Tecan Ltd., Switzerland) and expressed in optical density (OD) units. The experiment was performed in triplicate.
Colony formation assay
Single cell suspension with 500 cells per well was seeded into six-well plates, being incubated until visible clones appeared. After 10 days, the medium was removed and the cells were fixed with methanol for 10min and stained for the formation of cell colonies with 0.1% crystal violet staining solution. The picture of the colonies was then shot by a digital camera. The experiment was repeated three times.
Flow cytometry assay
Osteosarcoma cells were digested with 0.25% trypsin, then centrifuged at 1000 r/min for 5 min. Cells were rinsed twice with PBS and fixed in pre-cooled 70% ethanol at 4°C for 24 h. Then centrifugation was conducted to remove ethanol, and resuspension was performed with the addition of PBS. Cell concentration was adjusted to 1*106 cells/ml. And then cells were added with RNase A (Merck KGaA, Germany) for a 4 min water-bath at 37°C. Then 500μL of propidium iodide (Sigma, USA) was added for dyeing at 4 °C for 30 min in the dark. The flow cytometer was used to analyze cell cycle distribution with 300 mV argon lasers at the wavelength of 488 nm. Each sample was tested at a proportion of 1*104 cells/ml. The proliferation index (PI) was calculated according to the following formula: PI=(S+G2/M)/(G0/G1+S+G2/M) *100%. The experiment was repeated three times.
Transwell migration assay
Transwell migration chamber, consists of upper and lower chambers divided by a polycarbonate transwell membrane filter (8μm pore size), was used in the experiment. Osteosarcoma cells (1*104), digested with 0.25% trypsin and adjusted at a density of 1*105 cells/ml with serum-free DMEM, were transferred on the upper chamber. The DMEM medium (600μL) containing 10% FBS was added into the lower chamber. After 24h incubation in the 37°C, 5% CO2 incubator, cells that remained on the top of the filter were removed by cotton swab and migrated cells to the lower surface were fixed with methanol for 10min and then stained with 0.1% crystal violet staining solution for 20min. Images of migrated cells was taken by an inverted microscope. Five visual fields were randomly chosen and stained calls were counted. The experiment was repeated three times.
Scratching test
Osteosarcoma cells in logarithmic growth phase were digested with 0.25% trypsin, seeded into the 6-well plate at a density of 5*105 cells/ well, and cultured in the 5% CO2 incubator at 37°C overnight. The next day, 200μl pipette tip was used for scratching, then washed by PBS twice to sweep away suspension cells and added with serum-free medium. After incubation in the 5% CO2 incubator at 37 °C for 24 and 48 hours, the migration of cells in each group was observed using inverted microscope, and images were collected. The migration ability of osteosarcoma cells was measured by healing rate (HR): HR= (scratch area at 0h-scratch area at 24h or 48h)/scratch area at 0h*100%. Image j software was used to measure scratch areas. The experiment was repeated for three times.
Western blot analysis
Exponential phase cells were washed by PBS twice and added with RIPA buffer, then collected using a cell scraper. Cell lysates were vibrated 10s every 5min for 30 min at 0°C and centrifuged for 10 min (12,000 rpm, 4°C), and then the supernatants were transferred into clean EP tubes. Protein concentration was quantified using a BCA Protein Assay Kit according to the manufacturer's instructions (Beyotime, China). The supernatants (10μg protein) were subjected to SDS-PAGE gel, after which the proteins were transferred to PVDF membranes (Millipore, USA), which were then blocked with 5% non-fat dried milk for 2 hours at room temperature. The membranes were then probed with primary antibodies for Cry1 (ab104736, Abcam), Akt1 (sc-1618, Santa cruz), p-Akt (4060, CST), MDM2 (sc-965, Santa cruz), p-MDM2 (35215, CST), P53 (sc-126, Santa cruz), P21 (2947, CST), Cdk2 (sc-163, Santa cruz), Cyclin E (sc-247, Santa cruz), Cyclin A (sc-751, Santa cruz) and β-actin (a1978, Sigma) at 4°C overnight. The membranes were washed three times in TBST, and then incubated with goat anti-rabbit or goat anti-mouse IgG-horseradish peroxidase secondary antibody (7074, 4410, CST, USA) at 37°C for 2 h. The ECL Detection kit (Share-bio, China) was used for detection and photography. Images were read with a Fluor Chem E system (Proteinsinple, USA). The assays were performed in triplicate.
Quantitative real-time polymerase chain reation (qRT-PCR)
Total RNA was extracted from cells using RNAiso Plus (Takara, JPN). RNA concentration and quality were determined using a Tecan Infinity 200PRO multi-well plate reader (Tecan Ltd., Switzerland) to measure absorbance at 260 nm and 280 nm. The RNAs were reverse transcribed by cDNA synthesis at 37°C for 15 min and 85°C for 5s. The qRT-PCR primers for Cry1, Cry2, Per1, Per2, Per3, Clock, Bmal1, Dec1, Dec2, CK1ε, Rorα, Rev-Erbα, Npas2 and β-actin were searched from PrimerBank, and are listed in Table 2. The cDNA samples were subjected to PCR analysis using fast start universal SYBR green master rox (Takara, JPN). Amplifications were performed on an ABI 7500 Real-time PCR system. The optimal conditions were defined as follows: 95°C for 10 min, followed by 40 cycles at 95°C for 15s and at 55°C for 34s, and melting curve analysis at 95°C for 15s, at 55°C for 1 min, at 95°C for 15s, and at 60°C for 15s. The relative mRNA expression of the circadian clock genes was adjusted according to the expression of β-actin. The data were analyzed using the 2-ΔΔCt method. The assays were done in triplicate.
Primer sequences for clock genes
| Gene | Forward | Reverse |
|---|---|---|
| Cry1 | 5'-CTCCTCCAATGTGGGCATCAA-3' | 5'-CCACGAATCACAAACAGACGG-3' |
| Cry2 | 5'-TCCCAAGGCTGTTCAAGGAAT-3' | 5'-TGCATCCCGTTCTTTCCCAAA-3' |
| Per1 | 5'-AGTCCGTCTTCTGCCGTATCA-3' | 5'-AGCTTCGTAACCCGAATGGAT-3' |
| Per2 | 5'-GACATGAGACCAACGAAAACTGC-3' | 5'-AGGCTAAAGGTATCTGGACTCTG-3' |
| Per3 | 5'-GCAGAGGAAATTGGCGGACA-3' | 5'-GGTTTATTGCGTCTCTCCGAG-3' |
| Bmal1 | 5'-TGCAACGCAATGTCCAGGAA-3' | 5'-GGTGGCACCTCTTAATGTTTTCA-3' |
| Clock | 5'-TGCGAGGAACAATAGACCCAA-3' | 5'-ATGGCCTATGTGTGCGTTGTA-3' |
| Dec1 | 5'-GACGGGGAATAAAGCGGAGC-3' | 5'-CCGGTCACGTCTCTTTTTCTC-3' |
| Dec2 | 5'-AAGGAGCATGAAACGAGACGA-3' | 5'-CTCGGTTAAGGCGGTTAAAGC-3' |
| CK1ε | 5'-CGTGTGGGGAACAAGTACCG-3' | 5'-GATGTTGGCACCCAGGTAGAT-3' |
| Rorα | 5'-ACTCCTGTCCTCGTCAGAAGA-3' | 5'-CATCCCTACGGCAAGGCATTT-3' |
| Rev-Erbα | 5'-TGGACTCCAACAACAACACAG-3' | 5'-GCAAGGGCTTTTTCCGTCG-3' |
| Npas2 | 5'-CGTGTTGGAAAAGGTCATCGG-3' | 5'-TCCAGTCTTGCTGAATGTCAC-3' |
| β-actin | 5'-AAGGAGCCCCACGAGAAAAAT-3' | 5'-ACCGAACTTGCATTGATTCCAG-3' |
In vivo tumorigenicity assay
Osteosarcoma cells in logarithmic growth phase were selected from the control and Cry1-shRNA groups after transfection. These cells (106 cells) were inoculated into the subcutaneous tissues of 4-week-old nude mice, and there were 8 mice in each group. Daily life changes of nude mice were observed every day. Every 3d after inoculation, the length (a) and width (b) of trans-planted tumors were measured and recorded. According to the formula V = 0.5*a*b2, tumor growth curves of nude mice for all groups were obtained. After the experiment, nude mice were sacrificed and tumors were completely resected and weighed. Routine HE staining was then performed.
Statistical analysis
All analyses were performed through Statistical Package for Social Sciences (SPSS) 21.0 (IBM, Chicago IL, USA). Data were presented as the mean ± standard deviation (mean ± SD). Least significant difference (LSD-t) test was used for the comparison of data between two groups. Comparison of data among groups were calculated by One-Way Analysis of Variance (ANOVA). P<0.05 was considered statistically significant.
Results
Cry1 was downregulated in human osteosarcoma
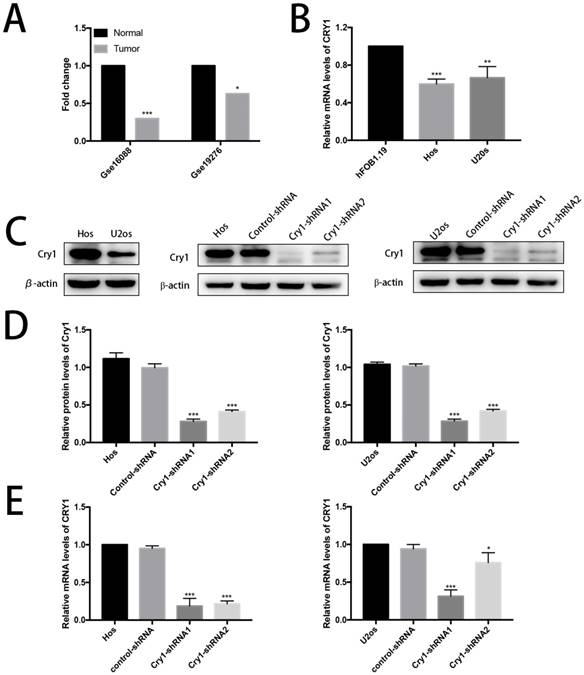
Data derived from Gse16088 and Gse19276 database showed low expression level of Cry1 in human osteosarcoma tissues (Fig. 1A). Then the relative mRNA expression level of Cry1 in human osteoblast cell line hFOB1.19 as well as in human osteosarcoma cell lines Hos and U2os were tested (Fig. 1B). The results showed lower expression levels in Hos and U2os cells (P<0.05).
Cry1 was downregulated in human osteosarcoma tissues and cells and the establishment of Cry1 knockdown Hos and U2os cells. A. The low expression level of Cry1 in human osteosarcoma tissues. B. Cry1 mRNA was highly expressed in human osteoblast cell line hFOB1.19, compared with Hos and U2os human osteosarcoma cell lines. C. Levels of Cry1 protein in the blank Hos and U2os cells, and Western Blot results of Cry1 silencing in the four groups. D. and E. Measurement of Cry1 silencing efficiency in protein and mRNA levels in the Hos and U2os cells. Values are expressed as the mean ± standard deviation. *P<0.05 vs. the control. **P<0.01 vs. the control. ***P<0.005 vs. the control.
Expression levels of Cry1 protein and mRNA in Hos and U2os cells
We first detected the expression level of Cry1 in Hos and U2os cells to investigate the function of Cry1 in human osteosarcoma. We established Cry1 silencing cell lines (Hos-Cry1-shRNA1 and U2os-Cry1-shRNA1) because Cry1 was highly expressed in both Hos and U2os cells, as well as the corresponding control-shRNA cell lines (Fig. 1C). Western blot data and qRT-PCR analysis showed the relative protein and mRNA levels of Cry1 normalized to the level of β-actin in the blank Hos and U2os cells, control-shRNA group and Cry1-shRNA1~2 groups (Fig. 1D, E). Both the mRNA and protein levels were most significantly decreased in Cry1-shRNA1 group in the two cell lines (P<0.05), that's why we chose this shRNA for the further use.
The effect of Cry1 knockdown on proliferation and migration in Hos and U2os cells in vitro
The CCK8 assay demonstrated that proliferation rate of Cry1-shRNA groups was higher than control-shRNA groups both in Hos and U2os cell lines (P<0.05). Flow cytometry analysis showed a higher proliferation index in osteosarcoma cells which express Cry1-shRNA (P<0.05). Moreover, Colony formation assay presented that the number of colonies were significantly increased after Cry1 silencing (P<0.05), consistent with the above experiments (Fig. 2A, B and C).
The effect of Cry1 knockdown on proliferation and migration in Hos and U2os cells in vitro. A. Cell viability was determined by the CCK8 assay. B. Flow cytometry profiles of proliferation among control-shRNA group and Cry1-shRNA group, and measured by proliferation index. C. Colony formation capability of osteosarcoma cells. D. Microscopy images of migrated cells passed through the transwell membrane and quantified by the number of migrated cell. E. Detection of migration rate of the osteosarcoma cell lines, quantify by the healing rate. Data are expressed as the mean ± standard deviation. *P<0.05 vs. the control. **P<0.01 vs. the control. ***P<0.005 vs. the control.
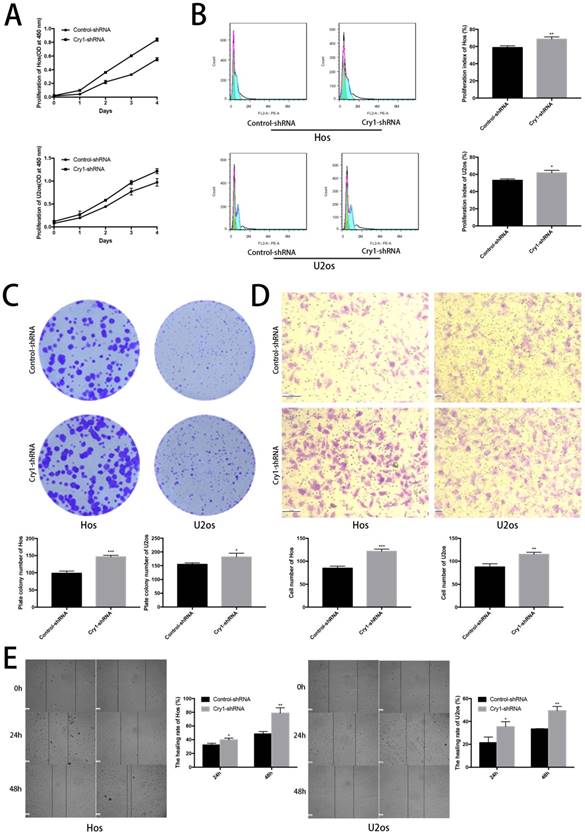
We then tested the effect of Cry1 knockdown on migration of osteosarcoma cells (Fig. 2D, E). The number of cells, which got through the transwell membrane, were significantly higher in Cry1-shRNA groups (P<0.05). Besides, the healing rate of osteosarcoma cells in Cry1-shRNA groups were higher than the control groups 24h and 48h after scratching (P<0.05). These data suggested that Cry1 silencing enhanced the proliferation and migration of osteosarcoma cells.
The effect of Cry1 knockdown on tumorigenesis in nude mice in vivo
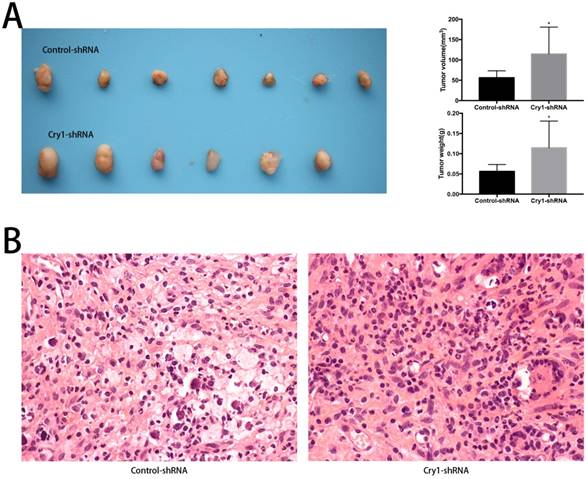
To determine the function of Cry1 in osteosarcoma growth in vivo, we performed animal assays with Hos cells expressing control-shRNA or Cry1-shRNA. Seven nude mice in the Control-shRNA group and six in the Cry1-shRNA group were survived and presented tumorigenesis. As shown in Figure 3A, tumor volume and weight were significantly higher form the nude mice in the Cry1-shRNA group (P<0.05). The HE staining of tumor slices showed as osteosarcoma tissue (Fig 3B).
The effect of Cry1 knockdown on tumorigenesis in nude mice in vivo. A. The condition of tumorigenesis of control-shRNA group and Cry1-shRNA group in vivo, and a higher average tumor volume and weight in the experimental group. B. HE staining of tumor tissues in the two groups respectively, observed under an optical microscope (400×). Data are expressed as the mean ± standard deviation. *P<0.05 vs. the control.
The effect of Cry1 knockdown on mRNA levels of clock genes in Hos and U2os cells
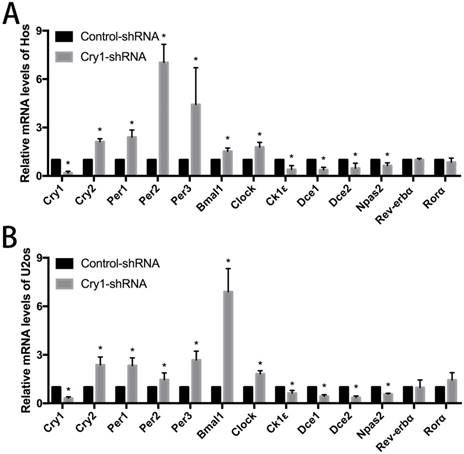
The results of qRT-PCR analysis indicated that after Cry1 knockdown, the mRNA expression levels of Cry2, Per1, Per2, Per3, Bmal1and Clock were significantly up-regulated (P<0.05). On the contrary, Dec1, Dec2, CK1ε and Npas2 were down-regulated significantly compared with the control-shRNA groups (P<0.05). In addition, there was no difference between the Cry1-shRNA groups and control-shRNA groups in the mRNA levels of Rev-Erbα and Rorα (P>0.05). All the above alterations of expression levels were consistent in the Hos and U2os cell lines (Fig 4).
The effect of Cry1 knockdown on mRNA levels of clock genes in Hos and U2os cells. A. and B. mRNA levels of Cry2, Per1, Per2, Per3, Bmal1 and Clock were upregulated, while Dec1, Dec2, CK1ε and Npas2 were downregulated. There were no differences in mRNA levels of Rev-Erbα and Rorα. Data are expressed as the mean ± standard deviation. *P<0.05 vs. the control.
Cry1 knockdown activated the Akt/P53/p21 signaling
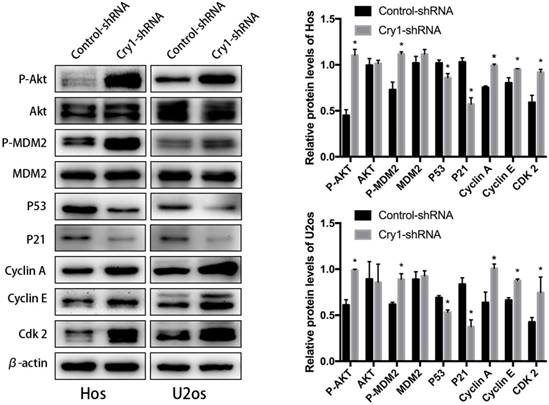
In order to identify the exact mechanism of Cry1 silencing regulates proliferation and migration of osteosarcoma cells, we detected the changes in expression levels of Akt/P53/p21 signaling, as well as its downstream molecules. As shown in the Figure 5, Cry1 knockdown activates the protein level of phosphorylated Akt (p-Akt) and MDM2 (p-MDM2), and inhibited P53 and P21 expression (P<0.05), while there was no notable difference in expression levels of Akt and MDM2 between Cry1-shRNA groups and control-shRNA groups. What's more, the downstream molecules Cyclin A, Cyclin E and Cdk 2 were significantly up-regulated in Cry1-shRNA groups (P<0.05).
Cry1 knockdown activated the Akt/P53/p21 signaling. Analysis of indicated proteins in osteosarcoma cells after Cry1 knockdown. *P<0.05 vs. the control.
Blocking Akt inhibited progression of Hos and U2os cells. To further strengthen our results, we treated the Cry1-shRNA groups with the Akt inhibitor MK-2206 and detected the proteins of Akt/P53/p21 signaling (Fig. 6A). MK-2206 reversed the activation of p-Akt and p-MDM2 after Cry1 silencing and the inhibition of Akt (P<0.05). All the changes were identical in the two cell lines.
Proliferation and migration of Hos and U2os cells after inhibiting the Akt/P53/p21 signaling. A. Analysis of indicated proteins in Cry1 silencing osteosarcoma cells after MK-2206 treatment. Data are expressed as the mean ± standard deviation. B. and C. Results of CCK8 assay and colony formation assay shown that enhanced proliferation of the Cry1-shRNA cells was blocked after Akt inhibition. D. and E. Results of transwell assay and scratching assay demonstrated inhibited migration ability of Cry1 silencing osteosarcoma cells. Data are expressed as the mean ± standard deviation. *P<0.05 vs. the control.
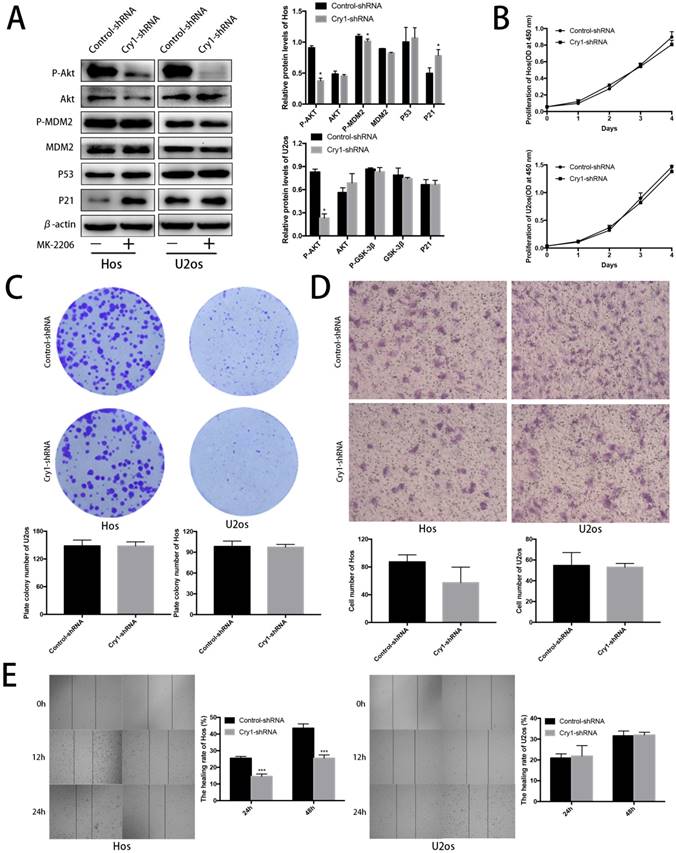
After MK-2206 treatment, we performed the CCK8 assay, colony formation assay, transwell assay and scratching test again to declare the function of Akt/P53/p21 signaling in the proliferation and migration of osteosarcoma cells. Our data demonstrated that the enhancement of proliferation and migration by Cry1 knockdown were notably blocked (P<0.05) after the addition of MK-2206 at 5μg/μL in Hos and 10μg/μL in U2os for 48h (Fig. 6B-E).
Akt was negatively phosphorylated along with Cry1 expression improvement. Blank Hos cells were transfected with Cry1-shRNA1 plasmid at a concentration gradient of 0, 0.25, 0.5, 1, 2, 4 µg/ml to test and verify the relationship between Cry and Akt. We found p-Akt increased following Cry1 expression decline, which indicated the loss of Cry1 is highly associated with the activation of Akt in osteosarcoma cells (Fig. 7A).
Further evidences to prove Cry1 promotes progression of osteosarcoma in an Akt-dependant manner in Hos cells. A. The P-Akt was upregulated after Cry1 knockdown in gradient. B. The P-Akt was downregulated when Cry1 silencing Hos cells was introduced into Cry1-cDNA. C-F. The proliferation and migration was inhibited after Cry1 overexpression. Data are expressed as the mean ± standard deviation. *P<0.05 vs. the control.
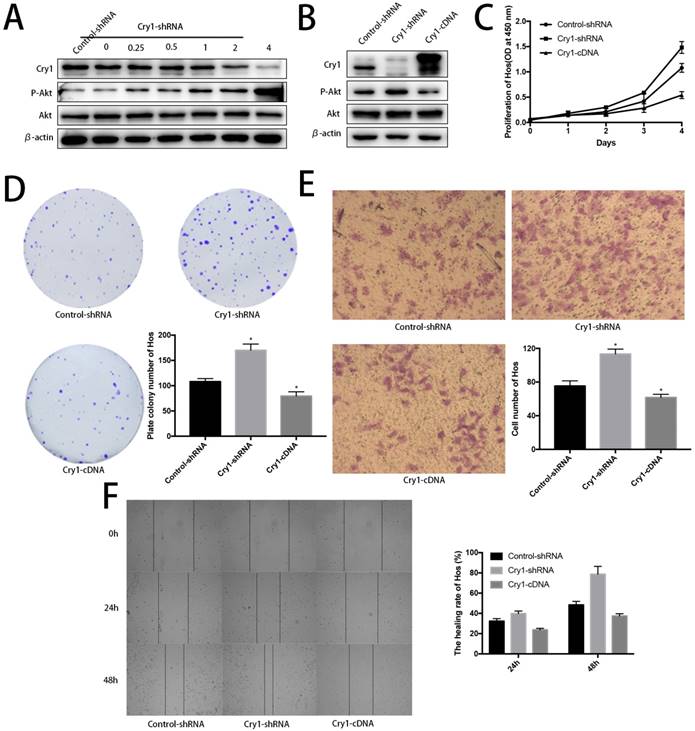
Cry1 overexpression decreased phosphorylated Akt and inhibited proliferation and migration of osteosarcoma cells. To further strengthen our findings, we infected Hos Cry1-knockdown cells with lentivirus which containing nonsense mutation Cry1-cDNA (HBLV-Cry1-3*flag-GFP-Neomycin) to set Cry1 expression level back and detected phosphorylation of Akt was inhibited due to Cry1 overexpression, which agree with our above results (Fig. 7B). Moreover, Cry1-overexpression cells exhibited significantly inhibitory effect on Hos cell proliferation and migration compared with control cells (Fig. 7C-F).
Discussion
Previous researches have confirmed that the dysregulation of Cry1 correlates with the occurrence and progression of many types of cancer[14, 15, 19]. In this study, we firstly investigated the function of Cry1 in the proliferation and migration of osteosarcoma cells by silencing Cry1in vitro. Then carcinogenesis assay in nude mice was performed and supported our findings from in vitro experiments. Our results revealed that Cry1 knockdown promoted tumorigenesis and development of osteosarcoma cells, which is similar to those articles that reported about other types of tumors[20-23].
It is also reported that clock gene network comprises of three feedback loops[24, 25]. Besides the canonical feedback loop, the second feedback loop involves hetero- or homodimers formed by Dec1 and Dec2, which are activated by Bmal1/Clock complex and then translocate into nucleus to suppress the expression of Bmal1/Clock heterodimers competitively. Rev-Erbα and Rorα are activated by Bmal1/Clock complex similarly and then exert negative or positive influence on Bmal1 transcription, which known as the third feedback loop.
Based on the above-mentioned feedback loops, we found decreased Crys/Pers heterodimeric complex after Cry1 knockdown resulted in transcriptional activation of Bmal1/Clock complex. Consequently, expression of transcriptional repressors including Cry2, Per1, Per2 and Per3 was promoted by Bmal1/Clock complex in turn. However, regardless of the alteration of members in the canonical feedback loop matched our deduction, the mRNA levels of Dec1, Dec2 were decreased and no remarkable changes were detected of Rev-Erbα and Rorα. Therefore, we hypothesized that the regulatory function of circadian feedback loops in cancer cells may differ from normal cells because of altered genetic backgrounds. We further speculated that the canonical feedback loop exerts the same influence in both cancer or normal calls as the central circuit, but there may be other genes or mechanisms regulate the circadian clock network in cancer cells. Moreover, transcription of CK1ε and Npas2 were found reduced in osteosarcoma cells, the former accelerates the degradation of Pers and its down-regulation may explain the up-regulation of Pers from a side; the later competes with Clock to form heterodimer with Bmal1 as the paralog of Clock, and increased transactivation of Clock may competitively inhibit the transcription of Npas2[26, 27]. Given that Cry1 regulates many downstream CCGs of cell cycle or cancer-related, alone with our next finding that Cry1 act as an important regulator in the clock gene network, may help understanding its role in osteosarcoma occurrence and progression.
Since we found that Cry1 affected proliferation and migration, as well as clock gene network in osteosarcoma cells, we analyzed common CCGs and found that Cry1 may function through Akt/P53/p21signaling. Akt, also named protein kinase B, is a Ser/Thr kinase which correlate with cancer cell proliferation by inducing cell survival and metastasis signals when activated[28]. It has been shown that P53 is a crucial tumor repressor and regulated by MDM2, which phosphorylated as activating form to induce P53 degradation by p-Akt[29]. Moreover, P53 acts as a transcriptional activator to promote expression of P21[30, 31]. As a suppressing regulator of cell cycle, P21 functions as inhibitor of Cdk2, which form Cyclin E/Cdk2 complex or Cyclin A/Cdk2 complex to control G1/S transition or the progression of S phase respectively[30]. In general, p-Akt activates MDM2 to repress P53, so the expression of P21 declines and then reduces blocking of Cyclin E/Cdk2 complex and Cyclin A/Cdk2 complex formation, facilitating proliferation of osteosarcoma cells consequently. What's more, it is reported that Akt and P53 play pivotal role in tumor migration. Our data confirmed the Akt/P53/p21signaling plays a central role in regulating osteosarcoma cells proliferation and migration. Combining our results, it suggests that Cry1 could affect the phosphorylation status of Akt, thus leading to the distinguished biological function of Cry1 in osteosarcoma cells. In addition, these results indicate Cry1 may be a promising prognostic predictor of osteosarcoma, and the Cry1-Akt axis a potential therapeutic target for osteosarcoma. However, the mechanism through which Cry1 downregulation affects Akt activity remains unclear.
In summary, Cry1 was characterized as a tumor suppressor and exerted its tumor suppressive activity through activation of Akt/P53/p21signaling in human osteosarcoma cells. Cry1 may serve as a prognostic predictor for osteosarcoma patients, and the Cry1-Akt axis is a potential therapeutic target for treating osteosarcoma. Moreover, our research prompts that the function of Cry1 on osteosarcoma is not only based on regulating downstream CCGs, such as the Akt/P53/p21signaling, but affect the many genes in the circadian clock network. So, further researches are needed to get insight into the exact mechanisms of circadian clock and its role in cancers.
Abbreviations
Cry1: Cryptochrome gene 1; CCG: Clock controlled genes; SCN: Clock controlled genes; Per: Period; Bmal1: Aryl Hydrocarbon Receptor Nuclear Translocator Lik2; Clock: Clock Circadian Regulato; Dec: Deleted in esophageal cancer; Rev-Erb: Nuclear receptor subfamily 1 group d member; Ror: RAR related orphan receptor; CK1: Casein Kinase 1 Epsilon; Npas2: Neuronal PAS Domain Protein 2; shRNA: Short hairpin RNA; Akt: AKT Serine/Threonine Kinase; MDM2: MDM2 Proto-Oncogene; Cdk2: Cyclin Dependent Kinase 2.
Acknowledgements
This work was supported by the key department of the Fifth People's Hospital of Shanghai (2017WYZDZK02); the key department of Minhang District (2017MWTZ02).
Competing Interests
The authors have declared that no competing interest exists.
References
1. Panda S, Antoch MP, Miller BH, Su AI, Schook AB, Straume M. et al. Coordinated transcription of key pathways in the mouse by the circadian clock. Cell. 2002;109:307-20
2. Liang X, FitzGerald GA. Timing the Microbes: The Circadian Rhythm of the Gut Microbiome. Journal of biological rhythms. 2017;32:505-15
3. Delaunay F, Laudet V. Circadian clock and microarrays: mammalian genome gets rhythm. Trends in genetics: TIG. 2002;18:595-7
4. Honma S, Kawamoto T, Takagi Y, Fujimoto K, Sato F, Noshiro M. et al. Dec1 and Dec2 are regulators of the mammalian molecular clock. Nature. 2002;419:841-4
5. Yang N, Williams J, Pekovic-Vaughan V, Wang P, Olabi S, McConnell J. et al. Cellular mechano-environment regulates the mammary circadian clock. Nature communications. 2017;8:14287
6. Preitner N, Damiola F, Lopez-Molina L, Zakany J, Duboule D, Albrecht U. et al. The orphan nuclear receptor REV-ERBalpha controls circadian transcription within the positive limb of the mammalian circadian oscillator. Cell. 2002;110:251-60
7. Shearman LP, Sriram S, Weaver DR, Maywood ES, Chaves I, Zheng B. et al. Interacting molecular loops in the mammalian circadian clock. Science (New York, NY). 2000;288:1013-9
8. Sotak M, Polidarova L, Ergang P, Sumova A, Pacha J. An association between clock genes and clock-controlled cell cycle genes in murine colorectal tumors. International journal of cancer. 2013;132:1032-41
9. Nagata C, Tamura T, Wada K, Konishi K, Goto Y, Nagao Y. et al. Sleep duration, nightshift work, and the timing of meals and urinary levels of 8-isoprostane and 6-sulfatoxymelatonin in Japanese women. Chronobiology international. 2017;34:1187-96
10. Truong T, Liquet B, Menegaux F, Plancoulaine S, Laurent-Puig P, Mulot C. et al. Breast cancer risk, nightwork, and circadian clock gene polymorphisms. Endocrine-related cancer. 2014;21:629-38
11. Filipski E, Delaunay F, King VM, Wu MW, Claustrat B, Grechez-Cassiau A. et al. Effects of chronic jet lag on tumor progression in mice. Cancer research. 2004;64:7879-85
12. Filipski E, King VM, Li X, Granda TG, Mormont MC, Liu X. et al. Host circadian clock as a control point in tumor progression. Journal of the National Cancer Institute. 2002;94:690-7
13. Gauger MA, Sancar A. Cryptochrome, circadian cycle, cell cycle checkpoints, and cancer. Cancer research. 2005;65:6828-34
14. Kelleher FC, Rao A, Maguire A. Circadian molecular clocks and cancer. Cancer letters. 2014;342:9-18
15. Habashy DM, Eissa DS, Aboelez MM. Cryptochrome-1 Gene Expression is a Reliable Prognostic Indicator in Egyptian Patients with Chronic Lymphocytic Leukemia: A Cohort Prospective Study. Turkish journal of haematology: official journal of Turkish Society of Haematology. 2017
16. Yu H, Meng X, Wu J, Pan C, Ying X, Zhou Y. et al. Cryptochrome 1 overexpression correlates with tumor progression and poor prognosis in patients with colorectal cancer. PloS one. 2013;8:e61679
17. Endo-Munoz L, Cumming A, Sommerville S, Dickinson I, Saunders NA. Osteosarcoma is characterised by reduced expression of markers of osteoclastogenesis and antigen presentation compared with normal bone. British journal of cancer. 2010;103:73-81
18. Paoloni M, Davis S, Lana S, Withrow S, Sangiorgi L, Picci P. et al. Canine tumor cross-species genomics uncovers targets linked to osteosarcoma progression. BMC genomics. 2009;10:625
19. Wang Y, Cheng Y, Yu G, Jia B, Hu Z, Zhang L. Expression of PER, CRY, and TIM genes for the pathological features of colorectal cancer patients. OncoTargets and therapy. 2016;9:1997-2005
20. Cadenas C, van de Sandt L, Edlund K, Lohr M, Hellwig B, Marchan R. et al. Loss of circadian clock gene expression is associated with tumor progression in breast cancer. Cell cycle (Georgetown, Tex). 2014;13:3282-91
21. Hu ML, Yeh KT, Lin PM, Hsu CM, Hsiao HH, Liu YC. et al. Deregulated expression of circadian clock genes in gastric cancer. BMC gastroenterology. 2014;14:67
22. Katamune C, Koyanagi S, Shiromizu S, Matsunaga N, Shimba S, Shibata S. et al. Different Roles of Negative and Positive Components of the Circadian Clock in Oncogene-induced Neoplastic Transformation. The Journal of biological chemistry. 2016;291:10541-50
23. Mazzoccoli G, Colangelo T, Panza A, Rubino R, De Cata A, Tiberio C. et al. Deregulated expression of cryptochrome genes in human colorectal cancer. Molecular cancer. 2016;15:6
24. Bunney BG, Li JZ, Walsh DM, Stein R, Vawter MP, Cartagena P. et al. Circadian dysregulation of clock genes: clues to rapid treatments in major depressive disorder. Molecular psychiatry. 2015;20:48-55
25. Lowrey PL, Takahashi JS. Mammalian circadian biology: elucidating genome-wide levels of temporal organization. Annual review of genomics and human genetics. 2004;5:407-41
26. Partonen T. Clock gene variants in mood and anxiety disorders. Journal of neural transmission (Vienna, Austria: 1996). 2012;119:1133-45
27. Spoelstra K, Wikelski M, Daan S, Loudon AS, Hau M. Natural selection against a circadian clock gene mutation in mice. Proceedings of the National Academy of Sciences of the United States of America. 2016;113:686-91
28. Risso G, Blaustein M, Pozzi B, Mammi P, Srebrow A. Akt/PKB: one kinase, many modifications. The Biochemical journal. 2015;468:203-14
29. Leszczynska KB, Foskolou IP, Abraham AG, Anbalagan S, Tellier C, Haider S. et al. Hypoxia-induced p53 modulates both apoptosis and radiosensitivity via AKT. The Journal of clinical investigation. 2015;125:2385-98
30. Abbas T, Dutta A. p21 in cancer: intricate networks and multiple activities. Nature reviews Cancer. 2009;9:400-14
31. Ignacio RMC, Dong YL, Kabir SM, Choi H, Lee ES, Wilson AJ. et al. CXCR2 is a negative regulator of p21 in p53-dependent and independent manner via Akt-mediated Mdm2 in ovarian cancer. Oncotarget. 2018;9:9751-65
Author contact
![]() Corresponding author: king1972com; Tel.: +86-180-2100-6917
Corresponding author: king1972com; Tel.: +86-180-2100-6917