Impact Factor ISSN: 1837-9664

 Global reach, higher impact
J Cancer 2018; 9(13):2327-2333. doi:10.7150/jca.25586 This issue Cite
Research Paper
A decision tree-based prediction model for fluorescence in situ hybridization HER2 gene status in HER2 immunohistochemistry-2+ breast cancers: a 2538-case multicenter study on consecutive surgical specimens
Libo Yang1,2, Zhang Zhang1* ![]() , Jiayuan Li3, Min Chen1, Jieliang Yang1, Jing Fu4, Hong Bu1,2*
, Jiayuan Li3, Min Chen1, Jieliang Yang1, Jing Fu4, Hong Bu1,2* ![]() , Shaoxian Tang5, Yueping Liu6, Huixiang Li7, Xiaomei Li8, Fangping Xu9, Xiaodong Teng10, Yinghong Yang11, Yun Ma12, Shuangping Guo13, Jinfen Wang14, Deyu Guo15
, Shaoxian Tang5, Yueping Liu6, Huixiang Li7, Xiaomei Li8, Fangping Xu9, Xiaodong Teng10, Yinghong Yang11, Yun Ma12, Shuangping Guo13, Jinfen Wang14, Deyu Guo15
1. Department of Pathology, West China Hospital, Sichuan University, Chengdu, Sichuan Province, China.
2. Laboratory of Pathology, West China Hospital, Sichuan University, Chengdu, Sichuan Province, China.
3. Department of Epidemiology and Biostatistics, West China School of Public Health, Sichuan University, Chengdu, Sichuan Province, China.
4. Department of Pathology, Sichuan Academy of Medical Sciences & Sichuan Provincial People' s Hospital, Chengdu, Sichuan Province, China.
5. Department of Pathology, Shanghai Cancer Center, Fudan University, Shanghai, China.
6. Department of Pathology, The Fourth Hospital of Hebei Medical University, Shijiazhuang, Hebei Province, China.
7. Department of Pathology, the First Affiliated Hospital of Zhengzhou University, Zhengzhou, Henan Province, China.
8. Department of Pathology, Harbin Medical University Cancer Hospital, Harbin, Heilongjiang Province, China.
9. Department of Pathology and Laboratory Medicine, Guangdong General Hospital, Guangdong Academy of Medical Sciences, Guangzhou, Guangdong Province, China.
10. Department of Pathology, First Affiliated Hospital, School of Medicine, Zhejiang University, Hangzhou, Zhejiang Province, China.
11. Department of Pathology, Fujian Medical University Union Hospital, Fuzhou, Fujian Province, China.
12. Department of Pathology, Affiliated Tumor Hospital, Guangxi Medical University, Nanning, Guangxi Province, China.
13. Department of Pathology, Xijing Hospital, the Air Force Military Medical University, Xi'an, Shanxi Province, China.
14. Department of Pathology, Shanxi Cancer Hospital, Taiyuan, Shanxi Province, China.
15. Institute of Pathology and Southwest Cancer Center, Southwest Hospital, Third Military Medical University, Chongqing, China.
* Both Zhang Zhang and Hong Bu equally contributed to this article for correspondence
Received 2018-2-17; Accepted 2018-4-18; Published 2018-6-6
Abstract
Objective: To investigate the proportion of HER2 gene amplifications and the association between the HER2-IHC-staining pattern and gene status in IHC-2+ breast cancers according to 2013 American Society of Clinical Oncology (ASCO)/College of American Pathologists (CAP) guidelines.
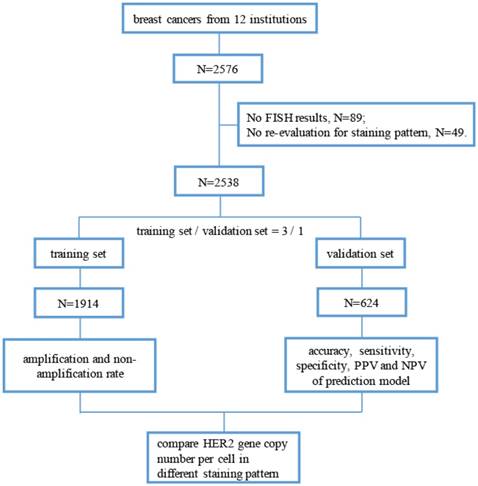
Methods: We retrospectively analyzed and re-evaluated the IHC-staining pattern of 2538 IHC-2+ surgical specimens of breast cancer from November 2014 to October 2015 in 12 institutions. All cases used for building a prediction model of HER2 gene amplification according to the IHC-staining pattern and were randomly divided into a training set (n = 1914) or validation set (n = 624).
Results: The overall HER2 fluorescence in situ hybridization (FISH) amplification, non-amplification and equivocation rates in HER2 IHC-2+ cases were 17.8%, 76.2% and 6.0%, respectively. In the training set, cases that had ≤ 10% of cells with intense, complete and circumferential membrane staining or had > 85% of cells with complete membrane staining of any staining intensity tended to be HER2 gene amplified (77.0% and 60.5%, respectively). And cases with weak and incomplete membrane staining had the lowest amplification rate of 6.1%. The prediction model was constructed based on IHC-staining pattern in the training set and validated using a validation set. The positive and negative prediction values were 51.6% and 79.2%, respectively, in the validation set. Moreover, the HER2 copy number per cell was much higher in cases with amplification-associated staining patterns (7.84 and 8.75) than in cases with non-amplification-associated staining patterns (2.97 to 4.41, P < 0.05).
Conclusions: In HER2 IHC-2+ breast cancers, the staining pattern is associated with the HER2 gene status. This finding is compatible with recommendations of 2013 ASCO/CAP guidelines.
Keywords: Breast Cancer, HER2, Immunohistochemistry, Fluorescence in situ hybridization
Background
Human epidermal growth factor receptor-2 (HER2; also named HER2/neu or ERBB2) is localized to chromosome 17q21 and encodes a transmembrane tyrosine kinase receptor [1]. Since HER2 was discovered in 1984 [2], and its prognostic value in breast cancers was reported in 1987 [3], this gene has been thoroughly studied and implicated in the diagnosis, therapy and prognosis of breast cancers. After the detection of HER2 overexpression and/or amplification, breast cancer patients are recommended to receive HER2-targeted therapy, such as trastuzumab and pertuzumab. Several studies have confirmed that HER2 expression has an inverse relationship with prognosis [1, 4]. However, only HER2-positive breast cancers can benefit from HER2-targeted therapy, and patients who receive targeted therapy show higher disease-free survival and overall survival than those who do not [5, 6].
Accurate evaluation of the HER2 status is mainly based on immunohistochemistry (IHC) and/or fluorescence in situ hybridization (FISH) by pathologists. Through IHC assays, the expression levels of HER2 protein are classified into 0, 1+, 2+ and 3+ based on American Society of Clinical Oncology (ASCO)/College of American Pathologists (CAP) guidelines [7, 8]. Breast cancers with HER2 expression levels of 0 and 1+ are HER2-negative, 2+ are HER2-equivocal and 3+ are HER2-positive. Based on ASCO/CAP 2007 guidelines [7], HER2 IHC-2+ breast cancers comprise up to 17% of newly diagnosed cases [9, 10]. However, with the update to the ASCO/CAP 2013 guidelines [8], the cut-off value between HER2 IHC-2+ and HER2 IHC-3+ tumors is down to 10%, which suggests that more breast cancers are HER2 IHC-3+. Additionally, the guidelines define > 10% of tumor cells with an incomplete, weak membrane or moderate staining as HER2 IHC-2+, which leads to a higher proportion of HER2 IHC-2+ tumors [11].
Approximately 90% HER2 overexpression breast cancers are caused by gene amplification [12]. FISH directly reflects HER2 gene copy numbers, and is thus considered the “golden standard”. However, it is more time-consuming and more expensive than IHC method. Thus, FISH is typically used for HER2-IHC-2+ breast cancers to identify gene-amplified cases. And the change of cut-off value in HER2/CEP-17 ratio, which is 2.0 in ASCO/CAP 2013 guidelines [8] and 2.2 in 2007 guidelines [7], is likely to lead to a higher proportion of gene-amplified cases in HER2 IHC-2+ tumors [13].
Moreover, along with the increased incidence rate of breast cancer in China and other areas worldwide [14, 15], the number of HER2 IHC-2+ tumors will also increase. Although there is an increasing need for FISH and the complexity of the IHC staining patterns in HER2 IHC-2+ cases, which differ in intensity (weak, moderate or intense), integrity (complete or incomplete) and percentage, little is known about the relationship between FISH results and different IHC staining patterns in HER2 IHC-2+ cases.
To investigate the proportion of HER2 gene amplifications and the association between the HER2-IHC-staining pattern and gene amplification in IHC-2+ breast cancers, we designed a multicenter study including over 2,000 HER2 IHC-2+ consecutive surgical specimens based on ASCO/CAP 2013 guidelines [8].
Materials and Methods
1. Patient population
This retrospective, multicenter study included patients who received routine surgical excision of breast invasive ductal carcinoma between November 2014 and October 2015 from 12 institutions in China. The revised guideline for HER2 detection for Chinese breast cancers according to ASCO/CAP 2013 guidelines [8] was published in April 2014, and it was immediately accepted and applied in daily work nationwide. Thus, we selected this time period to begin our study. The pathology departments in these institutions passed “Pathology Quality Control Centre (PQCC)” of National Health and Family Planning Commission certification. And external quality assessment system of HER2-IHC in breast cancers is a major project of the PQCC which lasts for about seven years, aimed to assess the consistency and accuracy of HER2-IHC staining and interpretation in different pathology departments. All breast cancers included in this study were HER2 IHC-2+ cases, and the gene status was detected through FISH. The definition of HER2 IHC-2+ cases is based on the ASCO/CAP 2013 guidelines [8]. By the way, we excluded invasive micropapillary carcinoma in this study because of its unique staining pattern [16, 17]. The study profile is illustrated in Figure 1.
Flow chart of this study. (FISH, fluorescence in situ hybridization; PPV, positive prediction value; NPV, negative prediction value).
2. IHC and FISH
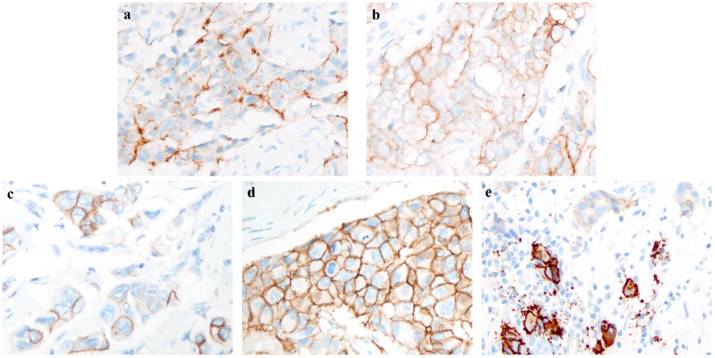
All participating institutions used Ventana anti-HER2/neu (4B5, rabbit monoclonal antibody, Ventana Medical Systems) for HER2-IHC staining. The cases included in this study were re-evaluated on the percentage of staining intensity and membrane integrity by two experienced pathologists. The re-evaluation of percentage in the IHC staining model was focused on invasive ductal carcinoma with higher intensity in the entire slide. Different staining intensities with complete or incomplete membrane integrity are shown in Figure 2.
Example of different intensity and integrity in immunohistochemistry (IHC) staining pattern. a. Weak and incomplete membrane staining; b. weak and complete membrane staining; c. moderate and incomplete membrane staining; d. moderate and complete membrane staining; e. intense, complete and circumferential membrane staining. (a-e, original magnification: ×400).
Dual-color HER2 FISH probe kits were used in the present study, and all kits were certificated by the China Food and Drug Administration (CFDA), Food and Drug Administration (FDA) and/or Council of Europe (CE). If there was HER2 genetic heterogeneity, then the tumor regions with higher HER2/CEP17 ratios and/or HER2 copy numbers were considered in the final interpretation.
3. Statistical analyses
The re-evaluation of the IHC staining pattern was primarily based on zones with higher intensity. To reveal the association between the staining pattern and the FISH test results, we used a decision tree-based prediction model, which can automatically calculate and classify characteristics with specific endpoints. To generate a more precise prediction model, we added more cases into the training set. Subsequently, all cases in the present study were randomly divided into training sets (n = 1914) and validation sets (n = 624). The ratio of the number of cases in the training set to that in the validation set was 3:1, and the prediction model was calculated based on training set data. Then, we used this prediction model in the validation group. According to ASCO/CAP 2013 guidelines [8], tumor cells within 10% intense, complete and circumferential membrane staining were also classified as HER2 IHC-2+ cases. We regarded these special tumors as having an independent staining pattern. Based on results from a decision tree-based prediction model, we divided all cases into six different categories according to different staining patterns, and differences in the HER2 copy numbers among these categories were calculated by Student-Newman-Keuls (SNK). Continuous variables are presented as the means ± standard deviation (SD). The two-sided significance level was set at P < 0.05.
Result
1. Profile of HER2 IHC-2+ staining pattern
After excluding cases with no re-evaluation data of staining pattern or FISH results, 2538 HER2 IHC-2+ breast cancer cases were included in the present study. The overall HER2 FISH amplification rate in participating institutions was 17.8% (ranging from 9.0% to 37.0%). Moreover, the HER2 FISH equivocation rate was 6.0% (ranging from 2.6% to 10.6%), and the non-amplification rate was 76.2% (ranging from 59.8% to 88.4%). An overview of the re-evaluation of the IHC staining pattern is shown in Table 1. A total of 103 (4.1%) cases had complete and circumferential membrane staining that was intense and within 10% of the cells. In addition, 604 (23.8%) cases showed complete membrane staining, which had weak or moderate staining intensities. However, more cases (72.1%) had incomplete membrane staining. For staining intensity, 856 (33.8%) cases with weak staining and 1579 (62.2%) cases with moderate staining were observed. The distribution of the staining pattern in the training and validation sets is also shown in Table 1, and the differences in the membrane integrity, staining intensity and percentage between the two sets were not statistically significant (P > 0.05). The different staining patterns of HER2 IHC-2+ cases were shown in Figure 2.
Profile of immunohistochemistry (IHC) staining pattern in all cases and cases in the training/validation set.
| Weak (n, %) | Moderate (n, %) | Strong (n, %) | Total (n, 100%) | ||||
|---|---|---|---|---|---|---|---|
| 10-50% | 50%-100% | 10-50% | 50%-100% | 0-10% | |||
| complete | 60 (11.5) | 54 (16.2) | 159 (23.2) | 331 (37.0) | 103 (100) | 707 (27.9) | |
| All Case | incomplete | 462 (88.5) | 280 (83.8) | 526 (76.8) | 563 (63.0) | -- | 1831 (72.1) |
| Total | 522 (20.6) | 334 (13.2) | 685 (27.0) | 894 (35.2) | 103 (4.1) | 2538 (100) | |
| complete | 45 (11.6) | 36 (14.5) | 111 (20.9) | 249 (37.1) | 73 (100) | 514 (26.9) | |
| Training Set | incomplete | 344 (88.4) | 213 (85.5) | 421 (79.1) | 422 (62.9) | -- | 1400 (73.1) |
| Total | 389 (20.3) | 249 (13.1) | 532 (27.8) | 671 (35.1) | 73 (3.8) | 1914 (100) | |
| complete | 15 (11.3) | 18 (21.2) | 48 (31.4) | 82 (36.8) | 30 (100) | 193 (30.9) | |
| Validation Set | incomplete | 118 (88.7) | 67 (78.8) | 105 (68.6) | 141 (63.2) | -- | 431 (69.1) |
| Total | 133 (21.3) | 85 (13.6) | 153 (24.5) | 223 (35.7) | 30 (4.8) | 624 (100) | |
2. Prediction of FISH results in the training and validation sets
In the training set, we used a decision-tree method to model, in which the staining pattern was associated with the FISH results. As shown in Figure 3, the cases in the training set were divided into six groups according to membrane integrity, staining intensity and percentage. In this prediction model, no group was associated with equivocal HER2 FISH cases. However, four of the six groups were associated with HER2 FISH non-amplification cases, and two of the six groups were associated with amplification cases. In particular, cases with ≤ 10% of cells with intense, complete and circumferential membrane staining tended to show amplification results, and 57 of the 74 (77.0%) cases in this pattern were detected to have HER2 amplification. Moreover, cases that had > 85% cells with complete membrane staining had 60.5% (49/81) amplification rates.
Decision-tree based prediction model of HER2 gene status and details on the number and ratio of different fluorescence in situ hybridization (FISH) results.
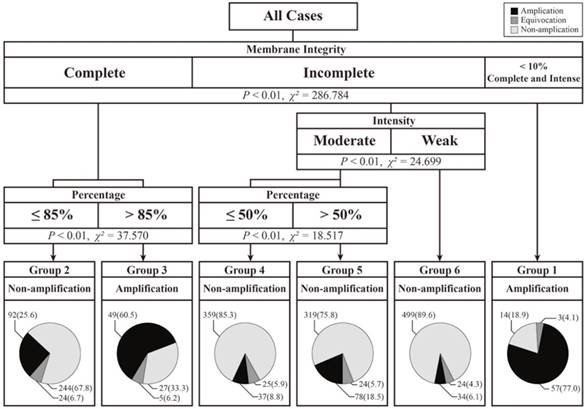
Except for above 155 cases, remaining 1759 cases were classified into non-amplification groups. The non-amplification rate in these four nodes ranged from 67.8% to 89.6%. Although cases with weak and incomplete membrane staining had the highest non-amplification rate of 89.6%, 34 of the 557 (6.1%) cases had amplification FISH results. Among these 34 cases, 23 cases had HER2 copy numbers ≥ 6.0, and 11 cases had HER2/CEP-17 ratios ≥ 2.0 but HER2 copy numbers < 6.0.
Next, we applied this model to the validation set. The predicted and actual FISH results are shown in Table 2. In this set, the accuracy, sensitivity, specificity, and positive and negative prediction values were 76.4, 30.2, 94.5, 51.6 and 79.2%, respectively.
Predicted and actual fluorescence in situ hybridization (FISH) results.
| Actual FISH Results | Predicted FISH Results | Total | ||
|---|---|---|---|---|
| Non-amplification | Equivocation | Amplification | ||
| Non-amplification | 445 | 0 | 26 | 471 |
| Equivocation | 43 | 0 | 4 | 47 |
| Amplification | 74 | 0 | 32 | 106 |
| Total | 562 | 0 | 62 | 624 |
3. HER2 copy number per cell in different staining patterns
Based on results from the decision-tree method, 2538 cases could be divided into six groups according to membrane integrity, staining intensity and percentage. The lowest HER2 copy number per cell (2.97 ± 1.67) was observed in cases that had ≤ 50% of cells with moderate and incomplete membrane staining. Cases that had ≤ 10% of cells with intense, complete and circumferential membrane staining had the highest HER2 copy numbers per cell (8.75 ± 5.72). The means and SD of the HER2 copy number per cell in these groups are shown in Figure 4.
HER2 gene copy number per cell in different staining patterns
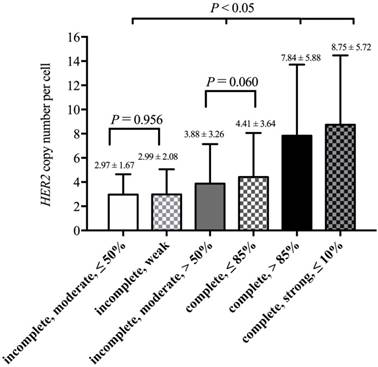
Then, we used SNK to calculate the differences among these groups (Figure 4). There was no significant difference between “incomplete, moderate, ≤ 50%” and “incomplete, weak” (P = 0.956), and there was also no difference between “incomplete, moderate, > 50%” and “complete, ≤ 85%” (P = 0.060). The four groups above could be observed as two separate categories, and two groups in one category showed no differences in the HER2 copy number per cell. Thus, these six groups could be divided into four categories. For HER2 copy number per cell, there were significant differences between every two categories (P < 0.05, Figure 4).
Discussion
After ASCO/CAP 2013 guidelines were published, several studies had reported amplification rates of IHC-2+ cases ranging from 15.1% to 30.6% based on this revised guideline [18-21]. However, these studies were single-center and did not focus on IHC-2+ cases. Thus, the new cut-off value of HER2-IHC and FISH test in ASCO/CAP 2013 guidelines demonstrates a need for more large-scale and multi-center studies focusing on the HER2 IHC-2+ proportion in breast cancers and FISH-amplification rate in HER2 IHC-2+ breast cancers. Herein, we conducted a multicenter, large-scale study on HER2 IHC-2+ consecutive surgical specimens. Institutions participating in this study were distributed in China, and each facility was a region representative. Overall, the HER2 amplification rate was 17.8%, ranging from 9.6% to 37.0%. Ten of the twelve (83.3%) institutions had amplification rates ranging from 10% to 30%.
There are few studies on the amplification rates in different staining patterns for HER2 IHC-2+ cases. Onguru et al. [19] reported the amplification rates in different percentages of moderate, complete/incomplete membrane staining. For 124 IHC-2+ cases in their study, the amplification rate in tumors, which had > 50% of cells with moderate complete/incomplete membrane staining, was 54.5% (12/22). This value was much higher than that observed (26.2%, 234/893) in the validation set in this study. Except for differences in amplification rates, the previous study showed that the amplification rates increased with increasing staining percentage (<10%, 10-50% and >50%) from 14.3% and 25.4% to 54.5% in the same staining intensity. The same phenomenon was also observed in the present study. With the same integrity and/or intensity, higher percentages had higher amplification rates (Figure 3; Group 2 vs. Group 3, 25.6% vs. 60.5%; Group 4 vs. Group 5, 8.8% vs. 18.5%). These facts show that cases with a higher proportion of stained cells are more likely to have HER2 gene amplification.
In this study, we constructed a prediction model based on staining patterns for gene amplification. And every cut-off value was produced automatically. From the prediction model, membrane integrity should be considered first. In cases that had cells with complete membrane staining, percentage was more important than staining intensity, and the higher percentage (> 85%) tended to be gene amplified. In contrast, cases containing cells with incomplete membrane staining were associated with non-amplified FISH test results, regardless of staining intensity and percentage. For all cases in this study, the HER2 gene amplification rate in tumors with complete membrane staining was 37.3% (264/707), which was much higher than that for tumors with incomplete membrane staining (10.3%; 189/1831).
In the training set, the highest amplification rate (77.0%) was in cases that had ≤ 10% of cells with intense, complete and circumferential membrane staining (Group 1). The lowest amplification rate (6.1%) was observed in cases with incomplete and weak staining (Group 6). Moreover, these cases had the highest non-amplification rate (89.6%). We found that the staining pattern in cases with the highest amplification rate was close to the definition of IHC-3+, which had cells with intense, complete and circumferential membrane staining [8]. Instead, the staining pattern in cases with the lowest amplification rate was closer to the definition of IHC-1+, indicating cells with faint/barely and incomplete membrane staining [8]. Some studies reported amplification rates in IHC-3+ cases ranging from 83.3% to 92.9% [18, 20, 21] and in IHC-1+ cases ranging from 2.9% to 4.1% [18, 20]. In the 2013 revised guidelines [8], the evaluation of the IHC staining model was changed along with the cut-off value of FISH. However, based on either the 2007 guidelines [7] or the 2013 revised guidelines [8], there was discordance between IHC and FISH in IHC-1+ and 3+ cases [18, 20, 22, 23]. This phenomenon suggests that HER2 protein overexpression can occur without gene amplification and vice versa [24]. The possible reason for this finding is that breast cancers with mutations in the HER2 gene may be IHC-negative but gene-amplified [25, 26].
From the above findings, we found that the HER2 IHC staining model was associated with the FISH test results to some extent. In the 2013 revised guidelines [8], the HER2 gene status was determined by not only the HER2/CEP17 ratio but also the HER2 copy number per cell. Lim et al. [20] reported an increase in the HER2 copy number per cell from IHC-negative to IHC-positive cases, and the CEP17 copy numbers showed no significant changes among different IHC groups. Although the CEP17 copy numbers were more stable among different breast cancers, it could be useful to estimate aneuploidy and make FISH test results more reliable. Thus, we used the FISH test results to generate a prediction model, and we compared the mean HER2 copy number per cell among decision-tree-based staining groups. Cases that had over 85% cells with complete membrane staining (Group 3) or had ≤ 10% cells with intense, complete and circumferential membrane staining (Group 1) were predicted to be HER2 gene-amplified. Those cases also had a higher HER2 copy number per cell than that of other cases, which were predicted as non-amplification cases (P < 0.05). As expected, the Group 1 with the highest amplification rate had the highest HER2 copy number per cell, and the Group 6 and Group 4 with lower amplification rates had lower HER2 copy numbers per cell.
In conclusion, we conducted a multicenter study to evaluate HER2 gene status in HER2 IHC-2+ breast cancers and constructed a decision-tree model to evaluate the relationship between the IHC staining pattern and the FISH results. These results show that the IHC staining pattern is also associated with HER2 gene status in HER2 IHC-2+ breast cancers. And it is compatible with recommendations of 2013 ASCO/CAP guidelines. If there were amplified FISH test results in cases with weak and incomplete staining pattern or non-amplified FISH test results in cases with ≤ 10% cells with intense, complete and circumferential membrane staining, pathologists should check IHC and FISH test results over again. Moreover, with increasing amplification rate in each staining pattern, the HER2 copy number per cell also increased.
Acknowledgements
The authors wish to thank the research coordinators and cooperating pathologists of the twelve institutions for data collection.
Grant support
National Natural Science Foundation of China (Grant No. 81702599).
Competing Interests
The authors have declared that no competing interest exists.
References
1. Ross JS, Slodkowska EA, Symmans WF, Pusztai L, Ravdin PM, Hortobagyi GN. The HER-2 receptor and breast cancer: ten years of targeted anti-HER-2 therapy and personalized medicine. Oncologist. 2009;14:320-68
2. Schechter AL, Stern DF, Vaidyanathan L, Decker SJ, Drebin JA, Greene MI, Weinberg RA. The neu oncogene: an erb-B-related gene encoding a 185,000-Mr tumour antigen. Nature. 1984;312:513-6
3. Slamon DJ, Clark GM, Wong SG, Levin WJ, Ullrich A, McGuire WL. Human breast cancer: correlation of relapse and survival with amplification of the HER-2/neu oncogene. Science. 1987;235:177-82
4. Andrulis IL, Bull SB, Blackstein ME, Sutherland D, Mak C, Sidlofsky S, Pritzker KP, Hartwick RW, Hanna W, Lickley L. et al. neu/erbB-2 amplification identifies a poor-prognosis group of women with node-negative breast cancer. Toronto Breast Cancer Study Group. J Clin Oncol. 1998;16:1340-9
5. Shah S, Chen B. Testing for HER2 in Breast Cancer: A Continuing Evolution. Patholog Res Int. 2010;2011:903202
6. Murphy CG, Modi S. HER2 breast cancer therapies: a review. Biologics. 2009;3:289-301
7. Wolff AC, Hammond ME, Schwartz JN, Hagerty KL, Allred DC, Cote RJ, Dowsett M, Fitzgibbons PL, Hanna WM, Langer A. et al. American Society of Clinical Oncology/College of American Pathologists guideline recommendations for human epidermal growth factor receptor 2 testing in breast cancer. J Clin Oncol. 2007;25:118-45
8. Wolff AC, Hammond ME, Hicks DG, Dowsett M, McShane LM, Allison KH, Allred DC, Bartlett JM, Bilous M, Fitzgibbons P. et al. Recommendations for human epidermal growth factor receptor 2 testing in breast cancer: American Society of Clinical Oncology/College of American Pathologists clinical practice guideline update. J Clin Oncol. 2013;31:3997-4013
9. Atkinson R, Mollerup J, Laenkholm AV, Verardo M, Hawes D, Commins D, Engvad B, Correa A, Ehlers CC, Nielsen KV Effects of the change in cutoff values for human epidermal growth factor receptor 2 status by immunohistochemistry, fluorescence in situ hybridization. a study comparing conventional brightfield microscopy, image analysis-assisted microscopy, and interobserver variation. Arch Pathol Lab Med. 2011;135:1010-6
10. Niikura N, Tomotaki A, Miyata H, Iwamoto T, Kawai M, Anan K, Hayashi N, Aogi K, Ishida T, Masuoka H. et al. Changes in tumor expression of HER2 and hormone receptors status after neoadjuvant chemotherapy in 21,755 patients from the Japanese breast cancer registry. Ann Oncol. 2016;27:480-7
11. Tchrakian N, Flanagan L, Harford J, Gannon JM, Quinn CM. New ASCO/CAP guideline recommendations for HER2 testing increase the proportion of reflex in situ hybridization tests and of HER2 positive breast cancers. Virchows Arch. 2016;468:207-11
12. Krishnamurti U, Silverman JF. HER2 in breast cancer: a review and update. Adv Anat Pathol. 2014;21:100-7
13. Fan YS, Casas CE, Peng J, Watkins M, Fan L, Chapman J, Ikpatt OF, Gomez C, Zhao W, Reis IM. HER2 FISH classification of equivocal HER2 IHC breast cancers with use of the 2013 ASCO/CAP practice guideline. Breast Cancer Res Treat. 2016;155:457-62
14. Siegel RL, Miller KD, Jemal A. Cancer Statistics, 2017. CA Cancer J Clin. 2017;67:7-30
15. Chen W, Zheng R, Baade PD, Zhang S, Zeng H, Bray F, Jemal A, Yu XQ, He J. Cancer statistics in China, 2015. CA Cancer J Clin. 2016;66:115-32
16. Yang W, Wei B, Chen M, Bu H. [Evaluation of immunohistochemistry HER2 results interpretation in invasive micropapillary carcinoma of the breast]. Zhonghua Bing Li Xue Za Zhi. 2015;44:48-52
17. Stewart RL, Caron JE, Gulbahce EH, Factor RE, Geiersbach KB, Downs-Kelly E. HER2 immunohistochemical and fluorescence in situ hybridization discordances in invasive breast carcinoma with micropapillary features. Mod Pathol. 2017;30:1561-6
18. Solomon JP, Dell'Aquila M, Fadare O, Hasteh F. Her2/neu Status Determination in Breast Cancer: A Single Institutional Experience Using a Dual-Testing Approach With Immunohistochemistry and Fluorescence In Situ Hybridization. Am J Clin Pathol. 2017;147:432-7
19. Onguru O, Zhang PJ. The relation between percentage of immunostained cells and amplification status in breast cancers with equivocal result for Her2 immunohistochemistry. Pathol Res Pract. 2016;212:381-4
20. Lim TH, Lim AS, Thike AA, Tien SL, Tan PH. Implications of the Updated 2013 American Society of Clinical Oncology/College of American Pathologists Guideline Recommendations on Human Epidermal Growth Factor Receptor 2 Gene Testing Using Immunohistochemistry and Fluorescence In Situ Hybridization for Breast Cancer. Arch Pathol Lab Med. 2016;140:140-7
21. Gheybi MK, Baradaran A, Mohajeri MR, Ostovar A, Hajalikhani P, Farrokhi S. Validity of immunohistochemistry method in predicting HER-2 gene status and association of clinicopathological variables with it in invasive breast cancer patients. APMIS. 2016;124:365-71
22. Seelig S. Fluorescence in situ hybridization versus immunohistochemistry: importance of clinical outcome. J Clin Oncol. 1999;17:3690-2
23. Apple SK, Lowe AC, Rao PN, Shintaku IP, Moatamed NA. Comparison of fluorescent in situ hybridization HER-2/neu results on core needle biopsy and excisional biopsy in primary breast cancer. Mod Pathol. 2009;22:1151-9
24. Pauletti G, Dandekar S, Rong H, Ramos L, Peng H, Seshadri R, Slamon DJ. Assessment of methods for tissue-based detection of the HER-2/neu alteration in human breast cancer: a direct comparison of fluorescence in situ hybridization and immunohistochemistry. J Clin Oncol. 2000;18:3651-64
25. Ross JS, Gay LM, Wang K, Ali SM, Chumsri S, Elvin JA, Bose R, Vergilio JA, Suh J, Yelensky R. et al. Nonamplification ERBB2 genomic alterations in 5605 cases of recurrent and metastatic breast cancer: An emerging opportunity for anti-HER2 targeted therapies. Cancer. 2016;122:2654-62
26. Chmielecki J, Ross JS, Wang K, Frampton GM, Palmer GA, Ali SM, Palma N, Morosini D, Miller VA, Yelensky R. et al. Oncogenic alterations in ERBB2/HER2 represent potential therapeutic targets across tumors from diverse anatomic sites of origin. Oncologist. 2015;20:7-12
Author contact
![]() Corresponding authors: Zhang Zhang, M.D., Ph.D. Department of Pathology, West China Hospital, Sichuan University, Chengdu, Sichuan Province, China. zhangzhang714com and Hong Bu, M.D., Ph.D. Department of Pathology and Laboratory of Pathology, West China Hospital, Sichuan University, Chengdu, Sichuan Province, China. hongbuedu.cn.
Corresponding authors: Zhang Zhang, M.D., Ph.D. Department of Pathology, West China Hospital, Sichuan University, Chengdu, Sichuan Province, China. zhangzhang714com and Hong Bu, M.D., Ph.D. Department of Pathology and Laboratory of Pathology, West China Hospital, Sichuan University, Chengdu, Sichuan Province, China. hongbuedu.cn.