Impact Factor ISSN: 1837-9664

 Global reach, higher impact
J Cancer 2018; 9(12):2098-2106. doi:10.7150/jca.24445 This issue Cite
Research Paper
A Nomogram for Distinction and Potential Prediction of Liver Metastasis in Breast Cancer Patients
Zhenhai Lin1*, Shican Yan2*, Jieyun Zhang 3*, Qi Pan1 ![]()
1. Department of Hepatic Surgery, Fudan University Shanghai Cancer Center; Department of Oncology, Shanghai Medical College, Fudan University, Shanghai 200032, P.R. China
2. Department of General Surgery, Huashan Hospital; Shanghai Medical College, Fudan University, Shanghai 200040, P.R. China
3. Department of Medical Oncology, Fudan University Shanghai Cancer Center; Department of Oncology, Shanghai Medical College, Fudan University, Shanghai 200032, P.R. China
*These authors contributed equally to this work.
Received 2017-12-19; Accepted 2018-5-7; Published 2018-5-25
Abstract
Liver metastasis from breast cancer has poor prognosis. We aimed at developing a reliable tool for making a distinction and prediction for liver metastasis in breast cancer patients, thus helping clinical diagnosis and treatment. In this study, totally 6238 patients from SEER database with known distant metastasis status and clinicopathologic variables were enrolled and divided randomly into training and validating groups. Logistic regression was used to screen variables and a nomogram was constructed. After multivariate logistic regression, sex, histology type, N stage, grade, age, ER, PR, HER2 status as significant variables for constructing the nomogram. The nomogram for distinguishing and predicting liver metastasis in breast cancer passed the calibration and validation steps and the areas under the receiver operating characteristic curve of the training set and the validation set were 0.6602 and 0.6511 respectively. Our nomogram is a reliable and robust tool for the distinction and prediction of liver metastasis in breast cancer patients, thus helping better choose medical examinations and optimize therapeutic regimen under the cooperation among medical oncologists and surgeons.
Keywords: liver metastasis, breast cancer, nomogram, SEER
Introduction
Breast cancer was the leading cancer type for females in US and worldwide which ranked the second in contributing to cancer death in women [1, 2]. Approximately more than 30% of breast cancer patients would present with distant non-nodal metastases [3]. Breast cancer liver metastases (BCLM) are frequent in the clinical course of breast cancer and the liver represents the third most frequent site for breast cancer metastases [4], however, BCLM are considered most lethal compared with other sites of metastases (e.g., the lung, bone, or brain), with 5-year survival rates of only 3.8-12 % (median survival, 4-21 months) [5] and treatment options are usually restricted to palliative systemic therapy [6]. Also, liver metastases are more likely to develop in patients with subtypes like ER/PR-negative in which hormonal therapy is rarely successful [4]. Moreover, Liver metastases may present asymptomatically during a metastatic screen and the survival time is only 4-8 months for breast cancer patients if liver metastasis status was ignored [7, 8]. In fact, all breast cancer patients were in the risk of liver metastasis so it is also important for clinicians to figure out whether the patient have a tendency to have liver metastasis, to take precautions and work out a treatment strategy in the cooperation among medical oncologists and surgeons from both the departments of breast and liver cancer.
On the other hand, as is well known, breast cancer is a heterogeneous disease which is characterized by diverse histopathologic and molecular features that are associated with distinct clinical outcomes [4]. There have been reports that pathological and biological parameters could be used for predicting individual overall survival or recurrence in breast cancer patients [9, 10]. We hypothesized that liver metastasis could also be distinguished with clinicopathological variables. In this study, we have two objectives. The primary objective was to pick out significant variables and find high risk factors related to liver metastasis. The secondary objective was to construct a predictive model with these variables which could help distinguish liver metastasis and look into its correlation with survival. A well-developed clinical nomogram is a popular decision-tool, which can be used to predict the outcome of an individual, bringing benefits to both clinicians and patients [11]. Thus, we screened and picked out breast cancer patients with distant organ metastasis from Surveillance, Epidemiology, and End Results (SEER) database and created a nomogram with significant variables which proved reliable for quantifying the risk for liver metastasis. Also, the likelihood of whether a patient had a higher risk of liver metastasis could also be used as an independent predicting factor for survival outcomes. Aiding with this tool, clinicians might be able to assess the risk of liver metastasis in breast cancer patients, thus choosing appropriate medical examinations to diagnose and optimized therapeutic regimen to treat.
Methods
Data source and inclusion criteria
We used SEER data released in April 15th, 2016 which covers approximately 30% of U.S. population and includes cases from 18 population-based registries (1973-2013) with routinely collected patient demographics, primary tumor site, tumor morphology, stage at diagnosis and follow-up for vital status. The data from SEER does not need informed patient consent and no case identifying information is provided by the SEER cancer registries. The inclusion criteria for selecting cases were as follows: primary malignant breast cancer patients who had distant metastasis (M1 stage) at diagnosis during 2010 to 2013. Some patients had more than one organ affected, but altogether we selected 6238 patients in model construction after ruling out those whose liver involvement condition was not available.
Nomogram construction and validation
We extracted the following variables into this research: T, N stage (derived AJCC stage group 7th edition, 2010), sex, race, histologic type, grade, ER status, PR status, HER2 status, Age at diagnosis, tumor size and marital status. We did a raw logistic regression in all patients and picked out significant variables. We analyzed and releveled some of the variables taking into account the data size, variable performance and frequency of occurrence in clinical manifestation. Histological type was categorized as duct carcinoma and lobular carcinoma or others. We combined grade IV and grade III together to optimize the model. Patients whose ER, PR or HER2 status is unknown or ER or PR in borderline were discarded. Moreover, we reassigned patients into size groups as less than 20 millimeters, between 20 and 50 millimeters, more than 50 millimeters. The outcome variable was liver metastasis and the study aimed at distinguishing liver involvement from other remote metastasis patients and predicting liver metastasis possibility when remote metastasis occurred.
Afterwards, we randomly divided all these patients into 1:1 training and validating groups. the training and validation groups were both made up of metastasis patients and a small portion of them had liver involvement. Multivariable logistic regression was performed in training group to distinguish liver metastasis and all the variables selected above were significant (P<0.05). The fitness of the model was assessed by the Hosmer and Lemeshow test. If P>0.05 (assuming α = 0.05), we conclude that the logistic regression model is a good fit [12]. Then we constructed a nomogram with each predictor assigned to a point whose value ranging from 0 to 100 and the most significant predictor sex was identified as the reference. The other factors were then assigned based on their proportion to the reference axis.
Evaluating nomogram performance
We validated the model both internally in training group and externally in validating group. First, a calibration method with bootstrapping was utilized internally to illustrate the association between the actual probability and the predicted probability. We have a calibration plot in which apparent, bias-corrected and ideal curves was demonstrated presented with bootstrapping samples. The external method was carried out in validating group by calculating AUC, the area under the receiver operating characteristic (ROC) curve [13]. The training group also had the receiver operation characteristic curve plotted. DeLong method was then performed and there was no significant difference between ROC curves in training and validating group [14]. Calibration and ROC curves was demonstrated in results part.
Other statistical methodologies
Demographic patient baseline characteristics were compared among the marital status groups with χ2 test and Wilcoxon-Mann-Whitney test. Kaplan-Meier curves were plotted and Log rank (Mantel-Cox) test was applied to compare the OS in between the groups. We utilized multivariable Cox regression models to analyze the relationship between the prognostic factors and survival outcomes. Overall survival (OS) was defined from the date of diagnosis to the date of death, with death of any cause treated as event. As to survival months, any follow-up beyond the study cutoff will be ignored, i.e., if the date of last contact is later than the study cutoff date, the study cutoff date would be treated as date of last contact. And December 31, 2013 was the cut-off date in this study. All of these statistical methods were performed by IBM SPSS Statistics, version 20 (SPSS Inc, Chicago, IL, USA) or R software version 3.2.1 (http://www.r-project.org) [15-18]. All P values were two-sided and statistical significance was set at P<0.05. All confidence intervals (CIs) were stated at the 95% confidence level.
Results
Demographic baseline characteristics
According to the inclusion criteria mentioned in methods, we obtained 6238 patients with distant metastasis from SEER database. In this study, all patients' liver metastasis status at diagnosis was known. Kaplan-Meier curve in Fig 1 demonstrated the significant survival difference between patients with or without liver metastasis.
Kaplan-Meier curves for metastatic patients with or without liver metastasis (P < 0.001)
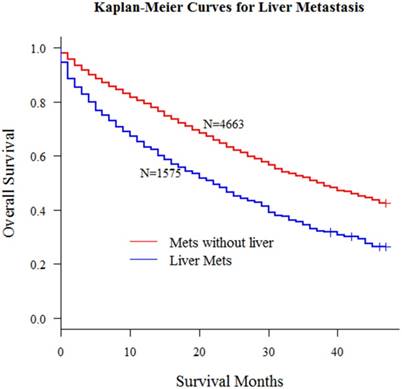
Table 1 showed the clinicopathologic characteristics of all patients. There were two columns in this table which corresponded to patients who had liver metastasis or not. We did Pearson Chi-square test in this table and the result told that for different metastatic sites, there was significant difference in patients for variables including sex (P = 0.006), grade (P<0.001), histology (P<0.001), N stage (P<0.001), estrogen receptor (ER) status (P<0.001), progesterone receptor (PR) status (P<0.001), human epidermal growth factor receptor 2 (HER2) status (P<0.001), race (P=0.018). As for age, we compared the mean values between the groups and utilized ANOVA (analysis of variance) which presented significant P value (<0.001) as well. The significant presentation implied that it is possible to predict the possibility of liver metastasis when a patient's clinicopathologic characteristics were clearly given. We could summarize some interesting findings from this table. For example, patients who had breast cancer metastasized to liver were comparatively younger than others and this was consistent with the regression and nomogram model in the discussion below.
Clinicopathological variables for patients with four metastatic types
| Liver Metastasis | Chi-square | P value | ||
|---|---|---|---|---|
| Variables | Yes | No | ||
| Age (Mean) | 57.99 | 60.78 | 45.609* | <0.001 |
| Sex | ||||
| Female | 1566 | 4595 | 7.596 | 0.006 |
| Male | 9 | 68 | ||
| Grade | ||||
| I | 73 | 395 | 82.01 | <0.001 |
| II | 549 | 2031 | ||
| III | 943 | 2203 | ||
| IV | 10 | 34 | ||
| Laterality | ||||
| Left | 818 | 2391 | 0.206 | 0.65 |
| Right | 757 | 2272 | ||
| Histology | ||||
| Duct | 1403 | 3827 | 42.676 | <0.001 |
| Lobular | 172 | 836 | ||
| T | ||||
| T1 | 223 | 664 | 2.377 | 0.667 |
| T2 | 584 | 1787 | ||
| T3 | 311 | 884 | ||
| T4 | 457 | 1324 | ||
| N | ||||
| N0 | 363 | 1066 | 22.239 | <0.001 |
| N1 | 774 | 2074 | ||
| N2 | 221 | 649 | ||
| N3 | 217 | 874 | ||
| Size | ||||
| 20- | 263 | 791 | 3.892 | 0.143 |
| 20-50 | 728 | 2268 | ||
| 50+ | 584 | 1604 | ||
| ER Status | ||||
| Negative | 553 | 982 | 125.304 | <0.001 |
| Positive | 1022 | 3681 | ||
| PR Status | ||||
| Negative | 798 | 1589 | 137.168 | <0.001 |
| Positive | 777 | 3074 | ||
| HER2 Status | ||||
| Borderline | 42 | 130 | 204.004 | <0.001 |
| Negative | 924 | 3570 | ||
| Positive | 609 | 963 | ||
| Race | ||||
| Black | 300 | 746 | 8.005 | 0.018 |
| Others | 124 | 366 | ||
| White | 1151 | 3551 | ||
| Marital Status | ||||
| Married | 719 | 2081 | 0.559 | 0.756 |
| Unmarried | 776 | 2348 | ||
*ANNOVA F-Value
Multivariate logistic regression results
We performed a raw logistic regression model with all variables from Table 1. Coefficients, standard errors, P values for each was calculated and documented in Table 2. Then we picked out significant variables including age, sex, histological type, N stage, grade, ER status, PR status and HER2 status. Afterwards, 1:1 randomly assigned training and validating groups was divided and we put these significant variables into another logistic model in the training group. It turned out that all variables selected presented with significant P value. Speaking of coefficients, sex was the most significant predictor, much more significant than any other. N0 and N1 stages had P values below 0.0001, N2 had P value 0.0004. HER2 positive also had P value below 0.0001. Age was another highly significant predictor whose P value was 0.0005. Comparatively, ER status and grade performed a little worse but still had P value below 0.05. This was the fundamental step for model construction for a well fitted regression model leaded to a useful and reliable predicting nomogram.
Raw logistic regression results for all variables
| Variables | Coefficient | Std. Error | P value |
|---|---|---|---|
| Sex | |||
| Male | -0.7699 | 0.287 | 0.0334 |
| Female | Reference | ||
| Histology | |||
| Lobular | -0.2669 | 0.362 | 0.005 |
| Duct | Reference | ||
| T | |||
| T1 | 0.2263 | 0.2071 | 0.2744 |
| T2 | 0.0888 | 0.1109 | 0.4233 |
| T3 | -0.0387 | 0.0981 | 0.6929 |
| T4 | Reference | ||
| N | |||
| N0 | 0.522 | 0.1045 | <0.0001 |
| N1 | 0.4861 | 0.0904 | <0.0001 |
| N2 | 0.3601 | 0.1124 | 0.0014 |
| N3 | Reference | ||
| Grade | |||
| I | -0.135 | 0.1397 | 0.3341 |
| II | Reference | ||
| III | 0.1968 | 0.0678 | 0.0037 |
| IV | -0.1457 | 0.3732 | 0.6963 |
| ER Status | |||
| Positive | -0.2744 | 0.0877 | 0.0018 |
| Negative | Reference | ||
| PR Status | |||
| Positive | -0.3081 | 0.0814 | 0.0002 |
| Negative | Reference | ||
| HER2 Recode | |||
| Borderline | -0.4871 | 0.1888 | 0.0099 |
| Negative | -0.6962 | 0.0668 | <0.0001 |
| Positive | Reference | ||
| Age | |||
| Plus 1 | -0.0105 | 0.0022 | <0.0001 |
| Size | |||
| 50+ | 0.3031 | 0.2017 | 0.133 |
| 20-50 | 0.0892 | 0.2137 | 0.6763 |
| 20- | Reference | ||
| Race | |||
| Others | -0.1379 | 0.1297 | 0.2879 |
| White | -0.0919 | 0.0811 | 0.2574 |
| Black | Reference | ||
| Marital Status | |||
| Married | 0.0487 | 0.0643 | 0.4491 |
| Unknown | -0.0003 | 0.1408 | 0.9984 |
| Unmarried | Reference |
Nomogram construction and validation
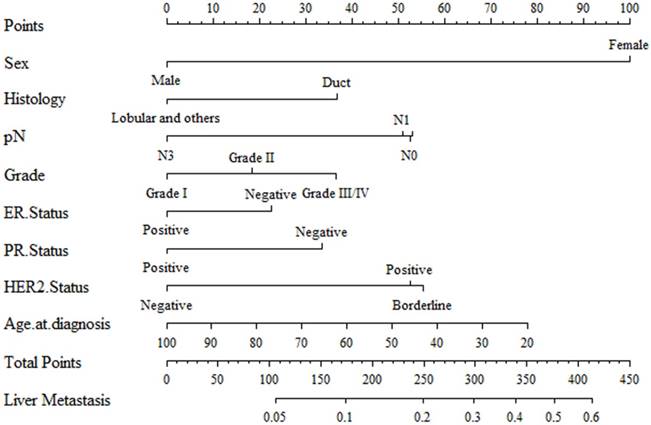
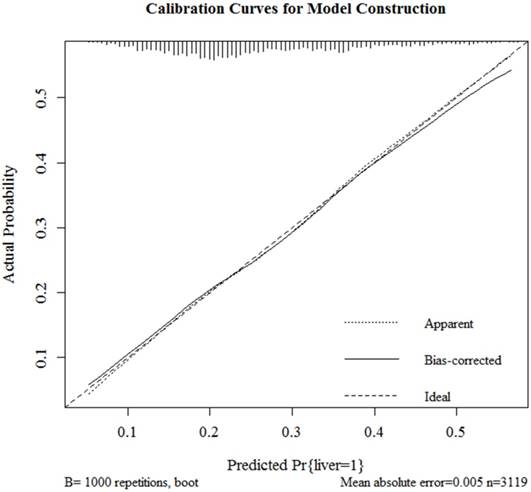
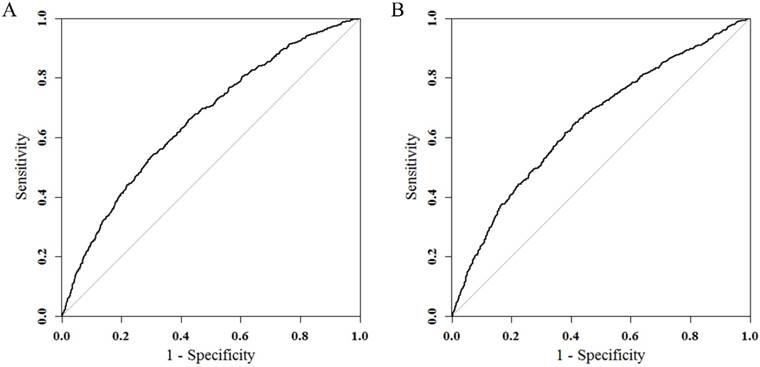
Results of logistic regression model in Table 3 were utilized to construct a nomogram (Fig 2). Sex, the variable which had the largest coefficients absolute value was set as reference whose scale range was from 0 to 100. Each predictor had its factors with points and marks on its line according to the scale above. From this nomogram, total points would be summed and then be converted to the probability for liver metastasis as there were parallel lines below the fig whose scales had linear relationship with each other. The Hosmer and Lemeshow test told the P value was 0.6679 indicating the model was well fitted. Then we did the calibration of the nomogram internally with bootstrap sampling for 1000 times and Fig 3 was plotted with Apparent, bias-corrected and ideal curves demonstrated. The bias-corrected curve was close to the ideal curve which fall along the 45-degree line and so was the apparent curve. All these told us that the nomogram fitted very well internally. Then, we plotted the receiver operating characteristic (ROC) both internally and externally in the training and validating set (Fig 4). The calibration method was carried out in validating group by compute the area under the ROC curve (AUC). In the training set, the AUC was 0.6602 (95%CI = 0.6385-0.6819) and in the validation set the AUC was 0.6511 (95%CI = 0.6286-0.6736). There was no significant difference in AUC between the training group and the validating group (P=0.5676). This result meant that our nomogram model well fitted both the randomly assigned training and validating group and there was no difference in utilization of the model between the training and validating groups.
Final Logistic Regression for significant variables
| Variables | Coefficient | Std. Error | P value |
|---|---|---|---|
| Sex | |||
| Male | -1.0868 | 0.5332 | 0.0415 |
| Female | Reference | ||
| Histology | |||
| Lobular | -0.3994 | 0.1394 | 0.0042 |
| Duct | Reference | ||
| N | |||
| N0 | 0.5725 | 0.1457 | <0.0001 |
| N1 | 0.5549 | 0.1301 | <0.0001 |
| N2 | 0.5762 | 0.1617 | 0.0004 |
| N3 | Reference | ||
| Grade | |||
| I | -0.3981 | 0.2007 | 0.0474 |
| II | -0.198 | 0.0948 | 0.0367 |
| III/IV | Reference | ||
| ER Status | |||
| Positive | 0.2468 | 0.123 | 0.0448 |
| Negative | Reference | ||
| PR Status | |||
| Positive | 0.366 | 0.1138 | 0.0013 |
| Negative | Reference | ||
| HER2 Recode | |||
| Unknown | 0.0306 | 0.2414 | 0.8991 |
| Positive | -0.571 | 0.0949 | <0.0001 |
| Negative | Reference | ||
| Age | |||
| Plus 1 | -0.0106 | 0.0031 | 0.0005 |
A nomogram for distinction and prediction of liver metastasis for breast cancer patients. Instructions for use of the nomogram: First, assign the points of each characteristic of the patient by drawing a vertical line from that variable to the points scale. Then, sum all the points and draw a vertical line from the total points scale to liver metastasis axis to obtain the probability.
Internal calibration curves for probability of liver metastasis nomogram construction (Bootstrap = 1000 repetitions).
ROC curves in training (A) and validating groups (B) for validating nomogram model. In the training set, the AUC was 0.6602 (95%CI = 0.6385-0.6819) and in the validation set the AUC was 0.6511 (95%CI = 0.6286-0.6736).
Liver metastasis probability and survival outcome
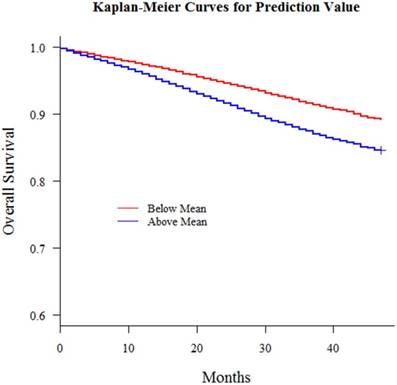
With this nomogram, we roughly predicted the possibility and distinguish liver metastasis patients merely with simple clinicopathologic variables in patients who already had remote metastasis. Then we extend the model out to all breast cancer patients amounting to 196468 who had no remote metastasis at diagnosis from 2010 to 2013 in consideration of the fact that early metastasis might miss diagnosis and a patient might develop metastasis shortly afterwards. Also, we had an interesting finding that there was a correlation between this liver metastasis risk and survival outcomes and patients with higher liver involvement risk had worse survival outcomes (Fig 5). For all 196468 patients, we defined the risk as a new variable and put this variable into a multiple variable cox regression model together with the other clinicopathologic variables including surgery, radiotherapy, race and marital status. This comprehensive liver metastasis risk was one of the most significant independent variables in predicting survival outcome. We could see in Table 4 that this variable was better than variables radiotherapy, marital status and race. Since marital status, race and radiotherapy had been reported as independent prognosis predictors for breast cancer, this comprehensive liver metastasis risk could play a part as well. Then we categorized the patients into groups whose comprehensive liver metastasis risk was above or below average and then plotted Kaplan-Meier curves to demonstrate its influence on survival outcomes and there was significant difference between the survival curves of the two groups (P<0.001). All these results implied the influence of this comprehensive liver metastasis risk could be used as a prognosis predictor. Those patients who had a potentially higher involvement risk had a worse survival outcome.
Kaplan-Meier curves for all breast cancer patients with predicted liver metastasis possibility above or below mean (P < 0.001)
Cox regression model results for all breast cancer patients with predicted liver metastatic possibility
| Variables | Coefficient | Std. Error | P value |
|---|---|---|---|
| Marital Status | |||
| Unmarried | 0.5858 | 0.0193 | <0.0001 |
| Married | Reference | ||
| Surgery | |||
| No | Reference | ||
| Unknown | -0.5822 | 0.0798 | <0.0001 |
| Yes | -1.3718 | 0.0273 | <0.0001 |
| Radiotherapy | |||
| No | Reference | ||
| Unknown | -0.2865 | 0.0513 | <0.0001 |
| Yes | -0.6118 | 0.0208 | <0.0001 |
| Race | |||
| Black | Reference | ||
| Others | -0.6424 | 0.0444 | <0.0001 |
| White | -0.2019 | 0.0249 | <0.0001 |
| M | |||
| M0 | Reference | ||
| M1 | 1.468 | 0.0276 | <0.0001 |
| Liver Mets Prediction | 0.7513 | 0.0881 | <0.0001 |
Discussion
For liver metastases from breast cancer, the chances of a cure are nil and there is little hope of long-term survivors after non-surgical management alone even though there are remarkable advances in personalized drug therapy according to tumor phenotype [19]. Palliation is the primary goal for those patients but surgical approaches including liver resection allow good quality prolonged survival though in selective groups [20]. TACE (trans-arterial chemoembolization), chemotherapy and endocrine- or HER2-targeted therapy also get involved in the management of diseases [21-24]. Multidisciplinary team, group composed of members with varied but complimentary experience, qualifications, and skills that contribute to treatment including surgeons and medical oncologists is necessarily needed.
In this study, we put forward the idea for the first time that patients with liver metastasis might have particular clinicopathologic characteristics which could in turn distinguish themselves from those who had no liver metastasis and the variables could be used in a risk model for liver metastasis. For breast cancer liver metastases was on the intersection of different departments and researchers had not collected enough clinical samples in a uniform standard for a long time. Thanks to SEER database who released its collected data in with records of distant metastases types for all patients, we could be able to analyze the relationship between liver metastasis and mere clinicopathologic variables and construct a nomogram based on logistic regression which proved reliable in following calibration and validation.
We firstly screened all available variables and discarded those which were of no significance in multivariate logistic regression. Then we randomized the population into 1:1 training and validating group and nomogram was constructed in training group with remaining variables all of which also showed significance (P<0.05) in this optimized logistic regression model. Then the nomogram passed calibration and validation step. After bootstrapping method for 1000 repetitions, Fig 3 presented the apparent and bias-corrected curve which both well fitted the diagonal ideal line. The receiver operating characteristics (ROC) were plotted (Fig 4) with calibration method carried out by computing areas under the receiver operating characteristic curve (AUC). In the training set, the AUC was 0.6602 (95%CI = 0.6385-0.6819) and in the validation set the AUC was 0.6511 (95%CI = 0.6286-0.6736). There was no significant difference in AUC between the training group and the validating group (p=0.5676). Thus, we concluded that our nomogram model reliable and its predicting ability robust. Since it was the first time that SEER database recorded patients with their metastasis condition, the logistic regression model and nomogram could be improved with larger number of samples added on in the future.
Also, we extended this model to those patients who had no metastasis at diagnosis because early metastasis might miss diagnosis and a patient might develop metastasis shortly afterwards, we could still try to predict the risk of liver involvement if metastasis occurred later on because the clinicopathological factors remain stable in progression of the disease. As one result of the study, patients with a higher liver involvement possibility when metastasis happened has worse survival outcomes and this risk also shows significant predictive effects in multiple Cox regression model. In a word, this model could show the risk of liver involvement, and if it gives a high probability, we might recommend the patient to take close inspection of the liver, such as regular B-ultrasonography or MRI.
Intriguing facts on the relationship between clinicopathologic factors and liver metastasis could be drawn out from this nomogram. A man was almost unlikely to have liver metastasis compared to a woman but we could not rule out the possibility for still 9 men had their tumor metastasized to liver in Table 1. Duct carcinoma, accounting for over 80% in all breast cancer patients, consisted of infiltrating duct carcinoma, intraductal carcinoma, noninfiltrating, comedocarcinoma and so forth and was in positive correlation with liver metastasis. N0, N1, N2 patients were more likely to develop liver metastasis than N3 patients, which is controversial to common sense. Previously, it has been reported that there was significant correlation between histological grade and multiple liver metastasis [25]. And in this study, we found that a low differentiated cancer is safer but grade III and IV were at a higher risk. Catharina B et al had published that patient Patients with HER2 overexpressing subtype had an increased risk for the development of visceral-only metastasis [26]. Molnár IA et al concluded that HER2 positive tumors carried a higher risk for distant metastases and HER2 positive had lung and liver as the most frequent second metastatic sites [27]. Kennecke H. et al reported that HER2-positive subtypes had a significantly higher rate of brain, liver, and lung metastases [28]. In our study, we discovered that ER negative, PR negative and HER2 positive were significant predictors and this finding was also in accord with statements by Gerratana L et al that HER2 overexpressing subtypes metastasize most likely to the liver and by Kast K et al that triple negative patients frequently presented with visceral metastases only at first presentation [29-31] In a conclusion, triple negative subtypes were more likely to develop visceral metastasis but HER2 positive with ER and PR double negative patients were more likely to have liver metastasis. Catharina B et al also argued that age at primary diagnosis, the nodal status and tumor size had no influence for visceral metastasis [26]. Moreover, Purushotham A found there is a surprising inverse relationship between age at diagnosis and distant metastasis in breast cancer [32]. Even so, we found age at diagnosis could be used to distinguish liver metastasis and others. It was a significant predicting factor, e.g. from the nomogram a 20-year-old girl turned more likely to have liver metastasis than a 90-year old grandma. As for nodal status, we noticed that N3 patients were less likely to have liver metastasis. Also, Catharina B et al argued tumor size had no influence for visceral metastasis [26]. Though larger tumor size was considered predictive of a slightly higher incidence of central nervous system (CNS) involvement [33], this variable tumor size had nothing to do in distinguishing liver metastasis from others.
This idea of constructing a nomogram and distinguishing and predicting metastasis status for a cancer disease was novel. We also hoped that this idea could be further carried out, extended and improved in further clinical work and research. Inevitably, this study had its limitations and this nomogram still had a lot of space to improve. With data volume increasing and the development other studies such as BRENDA [34], researchers could get larger population and more complete information for clinicopathologic variables. SEER database did not record characteristics such as occupation, education and family history. Also, we only knew the metastasis status at diagnosis and if we did know the metastasis status later on, we might be able to further prove its predictive efficacy. Last but not least, what we did was a retrospective analysis and the hypotheses raised remained to be proven in further investigation with larger data volume and advanced follow-up system.
This nomogram was constructed with all breast cancer patients whose metastasis status known. We could distinguish liver metastasis if metastasis incidence occurred. Also, all breast cancer patients had these clinicopathologic characteristics and they might have missed the diagnosis or develop metastasis shortly afterwards, hence, for those who had not been found with distant metastasis at diagnosis, this model could also be applied in predicting the risk which help decide whether to take a close watch on the liver, even though the following-up data for the patients has not been obtained yet and this hypothesis would be further validated in the long run. Because cancer metastasis is like the sword of Damocles. Moreover, we found that all patients who potentially had higher liver metastasis risk according to our nomogram had worse survival outcomes both in Kaplan-Meier curve and from cox regression model. This risk obtained was a significant factor in affecting survival. All these were consistent with our hypothesis that this model might be able to perform well in all patients, not merely in those with distant metastasis. This nomogram could be used as a supportive graphic tool in breast cancer which helps clinicians to distinguish, assess and evaluate the risk of liver involvement with clinicopathological factors and decided whether to pay more attention to liver in the course of disease.
Acknowledgements
The authors gratefully acknowledge the efforts of the Surveillance, Epidemiology, and End Results (SEER) Program tumor registries for the establishment and management of the database.
This work was sponsored by grants from the National Natural Science Foundation of China (81602100) and Natural Science Foundation of Shanghai (12ZR1406200).
Competing Interests
The authors have declared that no competing interest exists.
References
1. Ferlay J SI, Ervik M, Dikshit R, Eser S, Mathers C, Rebelo M, Parkin DM, Forman D, Bray F, v1.0 G. Cancer Incidence and Mortality Worldwide: IARC CancerBase No. 11. Lyon, France: International Agency for Research on Cancer. 2013
2. DeSantis C, Siegel R, Bandi P, Jemal A. Breast cancer statistics, 2011. CA Cancer J Clin. 2011;61:409-18
3. Siegel R, Naishadham D, Jemal A. Cancer statistics, 2012. CA Cancer J Clin. 2012;62:10-29
4. Tabariès S, Siegel PM. Breast Cancer Liver Metastasis. In: (ed.) Brodt P. Liver Metastasis: Biology and Clinical Management. Dordrecht: Springer Netherlands. 2011 p. 273-303
5. Ruiz A, Wicherts DA, Sebagh M, Giacchetti S, Castro-Benitez C, van Hillegersberg R. et al. Predictive Profile-Nomogram for Liver Resection for Breast Cancer Metastases: An Aggressive Approach with Promising Results. Ann Surg Oncol. 2017;24:535-45
6. van Walsum GA, de Ridder JA, Verhoef C, Bosscha K, van Gulik TM, Hesselink EJ. et al. Resection of liver metastases in patients with breast cancer: survival and prognostic factors. Eur J Surg Oncol. 2012;38:910-7
7. Wyld L, Gutteridge E, Pinder SE, James JJ, Chan SY, Cheung KL. et al. Prognostic factors for patients with hepatic metastases from breast cancer. Br J Cancer. 2003;89:284-90
8. Adam R, Aloia T, Krissat J, Bralet MP, Paule B, Giacchetti S. et al. Is liver resection justified for patients with hepatic metastases from breast cancer? Ann Surg. 2006;244:897-907 discussion -8
9. Matsuda N, Hayashi N, Ohde S, Yagata H, Kajiura Y, Yoshida A. et al. A nomogram for predicting locoregional recurrence in primary breast cancer patients who received breast-conserving surgery after neoadjuvant chemotherapy. Journal of surgical oncology. 2014;109:764-9
10. Mazouni C, Bonnier P, Romain S, Martin PM. A nomogram predicting the probability of primary breast cancer survival at 2- and 5-years using pathological and biological tumor parameters. Journal of surgical oncology. 2011;103:746-50
11. Liu RZ, Zhao ZR, Ng CS. Statistical modelling for thoracic surgery using a nomogram based on logistic regression. J Thorac Dis. 2016;8:E731-6
12. Hosmer DW, Hosmer T, Le Cessie S, Lemeshow S. A comparison of goodness-of-fit tests for the logistic regression model. Stat Med. 1997;16:965-80
13. Hanley JA, McNeil BJ. The meaning and use of the area under a receiver operating characteristic (ROC) curve. Radiology. 1982;143:29-36
14. DeLong ER, DeLong DM, Clarke-Pearson DL. Comparing the areas under two or more correlated receiver operating characteristic curves: a nonparametric approach. Biometrics. 1988;44:837-45
15. Team RC. R: A language and environment for statistical computing.: R Foundation for Statistical Computing, Vienna, Austria. URL. 2016
16. Jr FEH. rms: Regression Modeling Strategies. R package version 5.1-0. 2017
17. Robin X, Turck N, Hainard A, Tiberti N, Lisacek F, Sanchez JC. et al. pROC: an open-source package for R and S+ to analyze and compare ROC curves. BMC Bioinformatics. 2011;12:77
18. Subhash R. Lele JLKaPS. ResourceSelection: Resource Selection (Probability) Functions for Use-Availability Data. R package version 0.3-1. 2017
19. Golse N, Adam R. Liver Metastases From Breast Cancer: What Role for Surgery? Indications and Results. Clin Breast Cancer. 2017;17:256-65
20. Li XP, Meng ZQ, Guo WJ, Li J. Treatment for liver metastases from breast cancer: results and prognostic factors. World J Gastroenterol. 2005;11:3782-7
21. Damian S, Tessari A, Capri G, Mariani P, Bianchi GV, Mariani G. et al. Hepatic trans-arterial chemoembolization (TACE) in metastatic breast cancer. Journal of Clinical Oncology. 2013;31:e12017-e
22. Vogl TJ, Naguib NN, Nour-Eldin NE, Eichler K, Zangos S, Gruber-Rouh T. Transarterial chemoembolization (TACE) with mitomycin C and gemcitabine for liver metastases in breast cancer. Eur Radiol. 2010;20:173-80
23. Suzuki Y, Saito Y, Terao M, Terada M, Morioka T, Tsuda B. et al. Trastuzumab and chemotherapy after the treatment failure of lapatinib for HER2-positive metastatic breast cancer. Tokai J Exp Clin Med. 2010;35:148-51
24. Hortobagyi GN. Trastuzumab in the treatment of breast cancer. N Engl J Med. 2005;353:1734-6
25. Porter GJ, Evans AJ, Pinder SE, James JJ, Cornford EC, Burrell HC. et al. Patterns of metastatic breast carcinoma: influence of tumour histological grade. Clin Radiol. 2004;59:1094-8
26. Bartmann C, Diessner J, Blettner M, Hausler S, Janni W, Kreienberg R. et al. Factors influencing the development of visceral metastasis of breast cancer: A retrospective multi-center study. Breast. 2017;31:66-75
27. Molnar IA, Molnar BA, Vizkeleti L, Fekete K, Tamas J, Deak P. et al. Breast carcinoma subtypes show different patterns of metastatic behavior. Virchows Arch. 2017;470:275-83
28. Kennecke H, Yerushalmi R, Woods R, Cheang MC, Voduc D, Speers CH. et al. Metastatic behavior of breast cancer subtypes. J Clin Oncol. 2010;28:3271-7
29. Gerratana L, Fanotto V, Bonotto M, Bolzonello S, Minisini AM, Fasola G. et al. Pattern of metastasis and outcome in patients with breast cancer. Clin Exp Metastasis. 2015;32:125-33
30. Kast K, Link T, Friedrich K, Petzold A, Niedostatek A, Schoffer O. et al. Impact of breast cancer subtypes and patterns of metastasis on outcome. Breast Cancer Res Treat. 2015;150:621-9
31. Soni A, Ren Z, Hameed O, Chanda D, Morgan CJ, Siegal GP. et al. Breast cancer subtypes predispose the site of distant metastases. Am J Clin Pathol. 2015;143:471-8
32. Purushotham A, Shamil E, Cariati M, Agbaje O, Muhidin A, Gillett C. et al. Age at diagnosis and distant metastasis in breast cancer-a surprising inverse relationship. Eur J Cancer. 2014;50:1697-705
33. Pestalozzi BC, Zahrieh D, Price KN, Holmberg SB, Lindtner J, Collins J. et al. Identifying breast cancer patients at risk for Central Nervous System (CNS) metastases in trials of the International Breast Cancer Study Group (IBCSG). Ann Oncol. 2006;17:935-44
34. Wöckel A, Kurzeder C, Varga D, Wischnewsky MB, Kreienberg R. BRENDA: Breast Cancer Care under evidence-based Guidelines. Ein Projekt aus der Versorgungsforschung. Senologie - Zeitschrift für Mammadiagnostik und -therapie. 2010;7:A194
Author contact
![]() Corresponding author: Qi Pan, Department of Hepatic Surgery, Fudan University Shanghai Cancer Center, Address: Dong'an Rd 270, Shanghai 200032, China. E-mail: drpanqicom; Tel: +86-21-18121299777.
Corresponding author: Qi Pan, Department of Hepatic Surgery, Fudan University Shanghai Cancer Center, Address: Dong'an Rd 270, Shanghai 200032, China. E-mail: drpanqicom; Tel: +86-21-18121299777.