Impact Factor ISSN: 1837-9664

 Global reach, higher impact
J Cancer 2018; 9(8):1448-1454. doi:10.7150/jca.23566 This issue Cite
Research Paper
Genetic Variants Within MTORC1 Genes Predict Gastric Cancer Prognosis in Chinese Populations
Wenji Xue1,2 *, Mengyun Wang3*, Li Zhang1, Jianchun Gu1, Xueru Zhu1, Yiwei Wang1, Ruifen Wang4, Lifeng Wang4, Weiye Wang5, Xue-Feng Wang6,7, Jia-Wei Mei6,7, Leizhen Zheng1 ![]() , Mei-Ling Zhu1
, Mei-Ling Zhu1 ![]()
1. Department of Oncology, Xinhua Hospital, School of Medicine, Shanghai Jiao Tong University, Shanghai, 200092, China
2. Department of Radiation Oncology, Sun Yat-Sen University Cancer Center, State Key Laboratory of Oncology in South China, Collaborative Innovation Center for Cancer Medicine, Guangzhou, 510060, China
3. Cancer Institute, Collaborative Innovation Center for Cancer Medicine, Fudan University Shanghai Cancer Center, Shanghai, 200032, China
4. Department of Pathology, Xinhua Hospital, School of Medicine, Shanghai Jiao Tong University, Shanghai, 200092, China
5. MOE-Shanghai Key Lab of Children's Environmental Health, Xinhua Hospital affiliated to Shanghai Jiao Tong University School of Medicine, Shanghai, 200092, China
6. Department of General Surgery, Xinhua Hospital, School of Medicine, Shanghai Jiao Tong University, Shanghai, 200092, China
7. Institute of Biliary Tract Disease, Xinhua Hospital, School of Medicine, Shanghai JiaoTong University, Shanghai, 200092, China
* These authors contributed equally to this paper.
Received 2017-10-30; Accepted 2018-1-27; Published 2018-4-6
Abstract
Objective: Mammalian target of rapamycin complex 1 (mTORC1) plays an important role in maintaining proper cellular functions in gastric cancer (GC). Previous studies demonstrated genetic variants within mTORC1 genes were associated with GC risk. However, no studies reported the associations between genetic variants within mTORC1 genes and GC prognosis. Herein, we firstly assessed the associations of genetic variants of mTORC1 genes with overall survival (OS) of GC in Chinese populations.
Methods: We genotyped eight single nucleotide polymorphisms (SNPs) in mTORC1 genes (i.e., rs2536 T>C and rs1883965 G>A for mTOR, rs3160 T>C and rs26865 A>G for MLST8, rs3751934 C>A, rs1062935 T>C, rs3751932 T>C and rs12602885 G>A for RPTOR) by the TaqMan method in 197 Chinese GC patients who had surgical resection in Xinhua Hospital. We conducted Kaplan-Meier survival plots and Cox hazards regression analysis to explore the associations of these SNPs with OS.
Results: The single-locus analysis indicated that RPTOR rs1062935 T>C was associated with an increased risk of poor GC prognosis (CC vs. TT/TC: adjusted Hazard ratio (HR) = 1.71, 95% confidence interval (CI) = 1.04-2.82). The combined analysis of all eight SNPs showed that patients with more than three risk genotypes significantly increased risk of death (adjusted HR = 2.44, 95% CI = 1.30-4.58), when compared to those with three or less risk genotypes.
Conclusions: Our findings indicated that genetic variants within mTORC1 genes may predict GC prognosis in Chinese populations. The results need to be validated in future studies with larger sample sizes.
Keywords: mTORC1, genetic variants, gastric cancer, clinical outcome
Introduction
Gastric cancer (GC) is the fifth most common type of cancer worldwide with 950,000 new cases diagnosed and more than 720,000 deaths occurred in 2012 1,2. GC is particularly prevalent in China with morbidity and mortality ranking 2nd after lung cancer, posing severe threat to mankind3. Although many therapeutic strategies are applied to GC, the prognosis is still poor. So far, there are few methods recognized for predicting clinical outcomes of GC. Although tumor-node-metastasis (TNM) staging has been regarded as an important predictor of the prognosis, the fact that patients with the same TNM staging having different prognoses suggests genetic variants between individuals may play an important role4, 5. Therefore, identifying novel genetic biomarkers for GC prognosis has the vital clinical significance. Single nucleotide polymorphisms (SNPs), one of most common type of genetic variants among individuals, play a vital role in GC development, invasion, and prognosis5-8. Therefore, we speculated that SNPs may be valuable as biomarkers for GC prognosis.
The mammalian target of rapamycin (mTOR) signaling pathway is involved in cell growth regulation, proliferation and metabolism. Deregulation of the pathway commonly exists in most of human cancers9-11. There are two different forms of mTOR in mammalian cells: mTOR complex 1 (mTORC1) and mTORC2. In particular, mTORC1 is a central regulator of the mTOR pathway that contains mTOR, mammalian lethal with sec-13 protein 8 (MLST8) and the regulatory-associated protein of mTOR (RPTOR), and this pathway is sensitive to rapamycin inhibition12. The upstream signaling pathways of mTORC1 include phosphoinositide 3-kinase (PI3K)/AKT pathway and Ras/MAPK pathway. The eIF4E binding protein 1 (4E-BP1) and ribosomal protein S6 kinases (S6K1) are the main downstream elements of mTORC113. The main functions of mTORC1 include supporting cell growth, proliferation, cell metabolism and angiogenesis14-16. Previous studies have shown the activation of PI3K/AKT/mTOR signaling pathway has an effect on the prognosis for GC patients17-19. In addition, it was demonstrated that genetic variants within mTORC1 genes were associated with esophageal cancer and GC risk20, 21.
There are few published studies that have addressed the role of genetic variants in mTORC1 genes in GC prognosis. Considering the mTORC1 plays an important role in the development of GC, we evaluated the associations between potential functional SNPs in mTORC1 genes and GC prognosis in Chinese populations. Additionally, as we know, GC is a complex genetic disease, so we tried to explore the joint effects of multiple SNPs on GC prognosis.
Materials and Methods
Study population
A total of 197 GC patients who underwent a surgical resection were recruited from Xin Hua Hospital affiliated to Shanghai Jiaotong University School of Medicine (Shanghai, China) between April 2010 and December 2012. All patients were newly diagnosed with gastric adenocarcinoma confirmed by histopathological examinations. None of these patients had chemotherapy or radiotherapy prior to surgery. Paraffin-embedded tissues of patients were available. The information of clinical and pathological data, such as age, sex, tumor size, differentiation, depth of invasion and drinking status, were acquired by patients' medical records. The stage of GC was evaluated according to the tumor-node-metastasis (TNM) classification of the American Joint Commission on Cancer (AJCC) in 2010 (the 7th edition). All the patients were followed up through the outpatient service and telephone calls. The last time of follow-up was December 2015. The survival time was defined as the time between the date of surgical operation and the date of the last contact or cancer-related death. This study was approved by the Medical Ethics Committee of the hospital.
SNP selection and Genotyping
Eight SNPs were selected as described previously20. In brief, we searched the NCBI dbSNP database (http://www.ncbi.nlm.nih.gov/), HapMap database (http://www.hapmap.org) and SNPinfo (http://snpinfo.niehs.nih.gov/) to choose potentially functional SNPs of interest. The selection criteria were as follows: 1) minor allele frequency (MAF) reported in HapMap was ≥ 5% in Chinese Han, Beijing (CHB); 2) located in the regulatory region of genes; 3) affecting the function of transcription factor binding site (TFBS) or the microRNA binding site; 4) the linkage disequilibrium (LD) coefficient r2 was less than 0.8. Finally, we identified eight SNPs (rs2536 T>C and rs1883965 G>A for mTOR, rs3160 T>C and rs26865 A>G for MLST8, rs3751934 C>A, rs1062935 T>C, rs3751932 T>C and rs12602885 G>A for RPTOR) for the study. Among them, five SNPs (rs2536 T>C, rs3160 T>C, rs1062935 T>C, rs3751934 C>A, rs3751932 T>C) located in the 3'-untranslated region (3'UTR) may affect the miRNA binding site function. For the remaining three SNPs, rs1883965 G>A located in the intron region, rs26865 A>G located in the 5' near gene, rs12602885 G>A located in the 5'-untranslated region (5'UTR) and all of them may affect the TFBS function.
Genomic DNA was extracted from paraffin embedded tissues using TIANamp FFPE DNA kit (TIANGEN, Beijing, China). The TaqMan SNP genotyping method based on 384-well ABI 7900HT Real-time PCR System (Applied Biosystems, Foster City, CA, USA) was performed. The genotypes were independently analyzed by two persons (XueWJ and ZhuXR) using SDS Software 2.4 (Applied Biosystems, Foster City, CA, USA). For quality control, two random samples and two blank controls using double distilled water instead of DNA were repeated and the results were 100% concordant.
Statistical Analysis
Median survival time (MST) was used to estimate the time point when 50% studied patients died, and mean survival time was a statement about the observed time. When MST could not be calculated, mean survival time would be provided. Survival rates were determined using the Kaplan-Meier plots. Log-rank test was used to compare survival times across clinical features and different SNPs. HR and CIs were calculated by univariate and multivariate Cox hazards regression analyses for evaluating the factors of influencing survival time. The value of P < 0.05 was considered statistically significant. All analyses were performed with SAS software (version 9.1; SAS Institute, Cary, NC).
Results
Clinical characteristics of the study population
A total of 197 gastric adenocarcinoma patients were included in the study. Among them, 129 (65.5%) were males and 68 (34.5%) were females. The median age was of 63 years (range, 25 to 88 years). According to the National Comprehensive Cancer Network (NCCN) clinical practice guideline, about 50% patients with Stage II or III received either cisplatin-containing regimen, taxel-containing regimen, 5-fluorouracil (5-FU)-containing regimen or a similar regimen in which 5-FU was replaced by tegafur/gimeracil/oteracil (S-1) as the adjuvant chemotherapy after surgery. During the follow-up period, 85 patients died from GC and three patients were lost to follow-up.
As shown in Table 1, patients with tumor size > 4cm, T3 or T4 invasion, Stage III/IV, vascular, lymphatic vessel and perineural invasion, chemotherapy were obviously at higher risk of death compared with those with tumor size ≤ 4cm, T1/T2 invasion, Stage I or II, without vascular, lymphatic vessel and perineural invasion, non-chemotherapy (adjusted P = 0.029, 0.017, < 0.001, < 0.001, 0.036, respectively). None of the other characteristics were associated with OS.
Clinical characteristics of gastric cancer patients
Variable | Patients N=197 (%) | Deaths N=85 (%) | MST (months) | Log-rank P | HR (95% CI) univariate | P value | HR (95% CI) multivariate | P value2 |
|---|---|---|---|---|---|---|---|---|
| Age (years) | ||||||||
| ≤65 | 113 (57.4) | 41 (48.2) | 42.551 | 0.014 | 1.00 | 0.016 | 1.00 | 0.493 |
| >65 | 84 (42.6) | 44 (51.8) | 40.00 | 1.69 (1.11-2.59) | 1.21 (0.70-2.08) | |||
| Sex | ||||||||
| Male | 129 (65.5) | 57 (67.1) | 56.53 | 0.568 | 1.00 | 0.568 | 1.00 | 0.065 |
| Female | 68 (34.5) | 28 (32.9) | 35.001 | 0.88 (0.56-1.38) | 0.64 (0.39-1.03) | |||
| Drinking status | ||||||||
| No | 173 (87.8) | 77 (90.6) | 38.971 | 0.266 | 1.00 | 0.270 | 1.00 | 0.549 |
| Yes | 24 (12.2) | 8 (9.4) | 44.241 | 0.66 (0.32-1.38) | 0.79 (0.37-1.70) | |||
| Tumor size (cm) | ||||||||
| ≤ 4 | 113 (57.4) | 35 (41.2) | 42.881 | <0.001 | 1.00 | <0.001 | 1.00 | 0.029 |
| > 4 | 84 (42.6) | 50 (58.8) | 35.10 | 2.33 (1.51-3.59) | 1.70 (1.06-2.74) | |||
| Tumor site | ||||||||
| Cardia | 21 (10.7) | 11 (12.9) | 40.30 | 0.312 | 1.00 | 0.314 | 1.00 | 0.158 |
| Non-cardia | 176 (89.3) | 74 (87.1) | 40.341 | 0.72 (0.38-1.36) | 0.62 (0.32-1.20) | |||
| Tumor differentiation | ||||||||
| Well/Moderate | 47 (23.9) | 17 (20.0) | 42.231 | 0.200 | 1.00 | 0.203 | 1.00 | 0.427 |
| Poor | 150 (76.1) | 68 (80.0) | 56.53 | 1.41 (0.83-2.41) | 0.80 (0.45-1.40) | |||
| Depth of invasion | ||||||||
| T1/T2 | 66 (33.5) | 7 (8.2) | 50.871 | <0.001 | 1.00 | <0.001 | 1.00 | 0.017 |
| T3/T4 | 131 (66.5) | 78 (91.8) | 33.27 | 7.71 (3.55-16.72) | 3.25 (1.23-8.58) | |||
| Lymph node metastasis | ||||||||
| N0 | 72 (36.5) | 15 (17.6) | 35.241 | <0.001 | 1.00 | <0.001 | 1.00 | 0.911 |
| N1/N2/N3 | 125 (63.5) | 70 (82.4) | 38.53 | 3.23 (1.85-5.64) | 0.94 (0.33-2.73) | |||
| Distant metastasis | ||||||||
| M0 | 193 (98.0) | 81 (95.3) | 40.311 | <0.001 | 1.00 | 0.001 | 1.00 | 0.271 |
| M1 | 4 (2.0) | 4 (4.7) | 11.30 | 5.26 (1.90-14.62) | 1.87 (0.61-5.68) | |||
| TNM stage | ||||||||
| I/II | 97 (49.2) | 20 (23.5) | 47.071 | <0.001 | 1.00 | <0.001 | 1.00 | <0.001 |
| III/IV | 100 (50.8) | 65 (76.5) | 23.55 | 4.27 (2.58-7.07) | 3.63 (2.08-6.34) | |||
| Vascular/Lymphatic vessel/Perineural invasion | ||||||||
| No | 152 (77.2) | 53 (62.4) | 43.691 | <0.001 | 1.00 | <0.001 | 1.00 | <0.001 |
| Yes | 45 (22.8) | 32 (37.6) | 18.17 | 3.05 (1.95-4.76) | 2.44 (1.51-3.94) | |||
| Chemotherapy | ||||||||
| No | 95 (48.2) | 42 (49.4) | 51.27 | 0.408 | 1.00 | 0.408 | 1.00 | 0.036 |
| Yes | 102 (51.8) | 43 (50.6) | 41.201 | 0.84 (0.55-1.28) | 0.55 (0.31-0.96) | |||
Abbreviations: MST, median survival time; HR, hazard ratio; CI, confidence interval.
1 Mean survival time was provided when MST could not be calculated.
2 Adjusted for age, sex, drinking status, tumor size, tumor site, tumor differentiation, TNM stage, vascular/lymphatic vessel/perineural invasion, chemotherapy.
Associations between mTORC1 SNPs and OS of GC patients
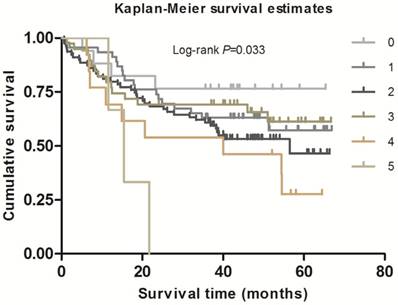
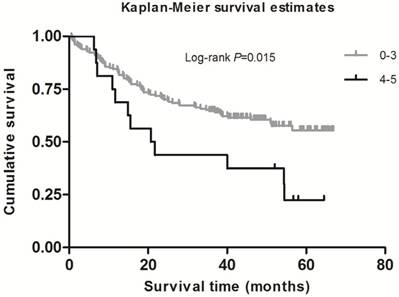
As shown in Table 2, in the single-locus analysis, we observed that RPTOR rs1062935 T>C was significantly associated with an increased risk of poor GC prognosis (CC vs. TT/TC: adjusted HR = 1.71, 95% CI = 1.04-2.82, adjusted P = 0.033). However, these risk associations were not observed for other individual SNPs. In the combined analysis of all at-risk SNPs whose HR value was relatively high, we found that patients with more than three risk genotypes exhibited increased risk of death, compared to those with three or less risk genotypes (adjusted HR=2.44, 95% CI=1.30-4.58). Furthermore, a joint effect on the risk of GC death was in a risk-genotype dose-response manner, as evidenced by a significantly increased risk with an increasing number of observed risk genotypes (adjusted HR = 1.82, 95% CI = 0.61-5.46 for one risk genotype; adjusted HR = 2.71, 95% CI = 0.96-7.68 for two risk genotypes; adjusted HR = 2.31, 95% CI = 0.74-7.20 for three risk genotypes; adjusted HR = 4.69, 95% CI = 1.42-15.52 for four risk genotypes; adjusted HR = 9.53, 95% CI = 2.00-45.49 for five risk genotypes; Ptrend = 0.002). As shown in Figure 1 and 2, Kaplan-Meier survival plots indicated cumulative risks for GC death associated with the presence of more than one through five risk genotypes (Log-rank P = 0.033, 0.015, respectively).
Correlations between different genotypes of genes in mTORC1 pathway and gastric cancer patients' survival
SNP's genes | Genotypes | Patients (N=197) | Deaths (N=85) | MST (months) | Log-rank P | HR (95%CI) univariate | P value | HR (95%CI) multivariate | P value2 |
|---|---|---|---|---|---|---|---|---|---|
| mTOR rs1883965 | GG | 167 | 72 | 39.731 | 0.995 | 1.00 | 0.995 | 1.00 | 0.270 |
| (G wild type) | GA | 30 | 13 | 34.331 | 1.00 (0.56-1.81) | 1.41 (0.77-2.58) | |||
| mTOR rs2536 | TT | 161 | 67 | 40.551 | 0.470 | 1.00 | 1.00 | ||
| (T wild type) | TC | 32 | 17 | 34.50 | 1.35 (0.79-2.31) | 0.265 | 1.34 (0.74-2.42) | 0.332 | |
| CC | 4 | 1 | 6.231 | 0.64 (0.09-4.61) | 0.658 | 1.26 (0.17-9.37) | 0.818 | ||
| TC/CC | 36 | 18 | 36.93 | 1.28 (0.76-2.15) | 0.361 | 1.34 (0.75-2.37) | 0.325 | ||
| TT/TC | 193 | 84 | 39.671 | 0.616 | 1.00 | 1.00 | |||
| CC | 4 | 1 | 6.231 | 0.61 (0.08-4.36) | 0.620 | 1.20 (0.16-8.87) | 0.858 | ||
| MLST8 rs26865 | AA | 56 | 21 | 56.53 | 0.344 | 1.00 | 1.00 | ||
| (A wild type) | AG | 68 | 33 | 54.43 | 1.49 (0.86-2.58) | 0.151 | 1.47 (0.83-2.58) | 0.184 | |
| GG | 73 | 31 | 33.421 | 1.22 (0.70-2.12) | 0.487 | 1.08 (0.60-1.94) | 0.802 | ||
| AG/GG | 141 | 64 | 37.061 | 1.35 (0.82-2.20) | 0.238 | 1.27 (0.75-2.12) | 0.375 | ||
| AA/AG | 124 | 54 | 56.53 | 0.897 | 1.00 | 1.00 | |||
| GG | 73 | 31 | 33.421 | 0.97 (0.62-1.51) | 0.897 | 0.86 (0.54-1.37) | 0.516 | ||
| MLST8 rs3160 | TT | 51 | 26 | 51.27 | 0.335 | 1.00 | 1.00 | ||
| (T wild type) | TC | 88 | 39 | 54.50 | 0.88 (0.54-1.45) | 0.616 | 1.02 (0.60-1.74) | 0.930 | |
| CC | 58 | 20 | 31.801 | 0.65 (0.36-1.17) | 0.149 | 0.69 (0.37-1.28) | 0.236 | ||
| TC/CC | 146 | 59 | 38.981 | 0.79 (0.50-1.25) | 0.307 | 0.88 (0.54-1.44) | 0.610 | ||
| TT/TC | 139 | 65 | 54.50 | 0.167 | 1.00 | 1.00 | |||
| CC | 58 | 20 | 31.801 | 0.70 (0.43-1.16) | 0.169 | 0.68 (0.40-1.15) | 0.150 | ||
| RPTOR rs1062935 | TT | 48 | 18 | 42.851 | 0.431 | 1.00 | 1.00 | ||
| (T wild type) | TC | 101 | 42 | 36.471 | 1.20 (0.69-2.08) | 0.527 | 0.85 (0.46-1.55) | 0.588 | |
| CC | 48 | 25 | 54.43 | 1.48 (0.81-2.72) | 0.204 | 1.53 (0.81-2.89) | 0.186 | ||
| TC/CC | 149 | 67 | 37.731 | 1.29 (0.77-2.17) | 0.341 | 1.06 (0.61-1.85) | 0.842 | ||
| TT/TC | 149 | 60 | 40.511 | 0.253 | 1.00 | 1.00 | |||
| CC | 48 | 25 | 54.43 | 1.31 (0.82-2.09) | 0.254 | 1.71 (1.04-2.82) | 0.033 | ||
| RPTOR rs12602885 | GG | 100 | 42 | 39.20 | 0.495 | 1.00 | 1.00 | ||
| (G wild type) | GA | 79 | 32 | 38.161 | 0.95 (0.60-1.50) | 0.812 | 0.78 (0.48-1.28) | 0.331 | |
| AA | 18 | 11 | 46.65 | 1.42 (0.73-2.76) | 0.303 | 1.21 (0.61-2.43) | 0.584 | ||
| GA/AA | 97 | 43 | 54.50 | 1.03 (0.68-1.58) | 0.878 | 0.87 (0.56-1.37) | 0.548 | ||
| GG/GA | 179 | 74 | 40.011 | 0.245 | 1.00 | 1.00 | |||
| AA | 18 | 11 | 46.65 | 1.45 (0.77-2.74) | 0.248 | 1.34 (0.79-2.61) | 0.385 | ||
| RPTOR rs3751932 | TT | 144 | 65 | 37.731 | 0.626 | 1.00 | 1.00 | ||
| (T wild type) | TC | 40 | 14 | 35.671 | 0.75 (0.42-1.34) | 0.336 | 0.83 (0.46-1.50) | 0.539 | |
| CC | 13 | 6 | 56.53 | 0.93 (0.40-2.15) | 0.871 | 1.43 (0.60-3.39) | 0.420 | ||
| TC/CC | 53 | 20 | 56.53 | 0.80 (0.48-1.32) | 0.381 | 0.95 (0.57-1.59) | 0.850 | ||
| TT/TC | 184 | 79 | 38.431 | 0.976 | 1.00 | 1.00 | |||
| CC | 13 | 6 | 56.53 | 0.99 (0.43-2.27) | 0.976 | 1.47 (0.62-3.48) | 0.377 | ||
| RPTOR rs3751934 | AA | 51 | 24 | 54.43 | 0.393 | 1.00 | 1.00 | ||
| (A wild type) | AC | 59 | 21 | 29.721 | 0.69 (0.38-1.25) | 0.220 | 0.74 (0.41-1.36) | 0.333 | |
| CC | 87 | 40 | 56.53 | 0.96 (0.58-1.59) | 0.865 | 0.93 (0.55-1.58) | 0.786 | ||
| AC/CC | 146 | 61 | 40.201 | 0.85 (0.53-1.36) | 0.488 | 0.85 (0.52-1.40) | 0.529 | ||
| AA/AC | 110 | 45 | 39.431 | 0.506 | 1.00 | 1.00 | |||
| CC | 87 | 40 | 56.53 | 1.16 (0.75-1.77) | 0.507 | 1.08 (0.70-1.68) | 0.720 | ||
| No. of at-risk genotypes3 | |||||||||
| 0 | 17 | 4 | 20.571 | 0.033 | 1.00 | 1.00 | |||
| 1 | 46 | 18 | 38.851 | 1.67 (0.57-4.95) | 0.351 | 1.82 (0.61-5.46) | 0.283 | ||
| 2 | 79 | 37 | 56.53 | 2.23(0.80-6.27) | 0.127 | 2.71 (0.96-7.68) | 0.061 | ||
| 3 | 39 | 14 | 38.051 | 1.57 (0.52-4.78) | 0.424 | 2.31 (0.74-7.20) | 0.147 | ||
| 4 | 13 | 9 | 40.00 | 3.28 (1.01-10.67) | 0.049 | 4.69 (1.42-15.52) | 0.011 | ||
| 5 | 3 | 3 | 15.50 | 7.46 (1.65-33.65) | 0.009 | 9.53 (2.00-45.49) | 0.005 | ||
| Trend | 0.033 | 0.002 | |||||||
| Dichotomized groups | |||||||||
| 0-3 | 181 | 73 | 40.601 | 0.015 | 1.00 | 1.00 | |||
| 4-5 | 16 | 12 | 21.20 | 2.11 (1.14-3.88) | 0.017 | 2.44 (1.30-4.58) | 0.006 | ||
Abbreviations: MST, median survival time; HR, hazard ratio; CI, confidence interval.
1 Mean survival time was provided when MST could not be calculated.
2 Adjusted for age, sex, drinking status, tumor size, tumor site, tumor differentiation, TNM stage, vascular/lymphatic vessel/perineural invasion, chemotherapy.
3 The risk genotypes used for the calculation were mTOR rs1883965 GA + rs2536 TC/CC, MLST8 rs26865 AG + rs3160 TC, RPTOR rs1062935 TT/TC + rs12602885 GG/GA + rs3751932 TT/TC + rs3751934 AA/AC.
Survival plot of GC patients with different No. of at-risk genotypes.
Survival plot of GC patients with No. of at-risk genotypes less than or equal to 3 and greater than 3.
Discussion
In the study, we firstly evaluated the effects of eight SNPs within three mTORC1 genes on survival of GC patients. We found that RPTOR rs1062935 CC variant increased risk of GC death, as well as patients with more than three risk genotypes, when compared to those with three or less risk genotypes.
MTORC1 plays a vital role in the mTOR signaling pathway and mTOR, MLST8 and RPTOR are the three major components of mTORC1. MTOR is a 289 kDa and evolutionarily conserved serine/threonine kinase which belongs to PI3K-related kinase family22. One study indicated that mTOR played an important role in regulating developmental and metabolic processes23, while inhibiting mTOR might extend lifespan in animals24. MLST8, also known as GbetaL, is essential in activating the mTOR kinase. Except for directly stabilizing the active site of mTOR, MLST8 may be associated with other cellular proteins. Knockdown of MLST8 inhibits tumor growth and invasiveness in some human cancers25-27. RPTOR, located at chromosome 17q25.3, acts as a scaffold role to recruit substrates to the mTOR kinase, thereby regulating the activity of mTOR28, 29. The deletion of RPTOR remarkably impaired acute myeloid leukemia (AML) progression through analyzing AML mouse models30.
The mTORC1 signaling pathway involves in an increasing number of human diseases, such as diabetes, obesity, autoimmune disorders and cancers31. Some studies investigated the associations of genetic variants in mTORC1 pathway genes with susceptibility and survival of different cancers. For example, Chen M et al. identified that four SNPs (rs11653499, rs7211818, rs7212142 and rs9674559) in RPTOR were associated with an increased risk of bladder cancer32, and He J et al. found that mTOR rs1883965 A variant genotypes were associated with an increased GC risk21. Although Zhu J et al. did not find main effects of five SNPs located in PIK3R1 and mTOR with esophageal cancer risk using their own data, meta-analysis identified mTOR rs2295080 associated with cancer risk and the same effect occurred among subjects with one-to-three risk genotypes in further combined analysis. They also found the gene-environment interactions in esophageal carcinogenesis33. Similar to our results, their findings further validated the importance of genetic variations as well as mTOR signaling pathway on the development of cancer. It also reminds us gene-environment interactions may play a key role in determining clinical outcomes. A meta-analysis revealed mTOR rs11121704 TT was associated with poor clinical outcome, including death, metastasis and resistance to chemotherapy in patients with lung and esophageal cancer34. Piao Y et al. found two SNPs in mTOR and AKT genes increased GC susceptibility in the subgroups of man, H. pylori-negative individuals, and one SNP in AKT gene associated with lymph node metastasis but not with the survival in 203 cases35. Although researchers investigated different SNPs in different genes from different perspectives, and produced the final results differently, published results and ours both supported the hypothesis that SNPs in mTOR signaling pathway have positive effects on GC risk and prognosis.
Some studies have indicated that clinical pathological characteristics and adjuvant therapy would affect overall survival, however, the phenomenon that not all patients with the same situations have the same survival time suggests genetic variations may also insert one foot. Several publications have showed the associations between the two in kinds of cancers which were further proved not to be illusions from the biological aspect. Even if no genetic main effects existed for bulks of SNPs, according to several studies, we believed SNPs of interest might collectively confer and modulate cancer outcome.
Our study could not find main effect for some SNPs which may clash with other studies. The reasons may be the limitations existing in our study. We observed that the combined effect of genetic variants in mTORC1 genes on a poorer survival of GC. We have the excuses to believe the situation is common that the effect of each SNP we studied is relatively weak. When multi-SNPs were combined, they jointly present a much stronger effect than any single SNP36. Previous genetic association studies also showed that human complex traits can be influenced by the cumulative effects of multiple common SNPs, each with small individual effect and little predictive value37. But beyond that, the relatively small sample sizes may provide limited statistical power to detect the week effect of single SNP on GC survival.
We need be caution when drawing a conclusion because some limitations exist in our study. Firstly, the sample size was relatively small, especially for the low MAF of two SNPs (rs1882965 and rs2536), so we could not have enough power to calculate weak effects of genetic variants on clinical outcomes. Secondly, only eight SNPs were included in our study, some important genetic variants may be neglected. Thirdly, this is a retrospective study with inherent defects which may introduce selection bias or information bias. Finally, functional mechanisms underlying genetic variants influence on clinical outcomes could not be elucidated, which may confuse us it is a real association or just an illusion, although some studies have shown mTOR SNPs might affect gene expression, or modulating transcriptional activity, miRNA binding and splicing36.
In conclusion, our findings demonstrate that genetic variants in mTORC1 genes may influence GC prognosis in Chinese populations. Further studies with larger sample size, more rigorous and prospective studies are required to confirm our findings.
Abbreviations
mTORC1: mammalian target of rapamycin complex 1; GC: gastric cancer; OS: overall survival; SNP: single nucleotide polymorphism; HR: hazard ratio; CI: confidence interval; TNM: tumor-node-metastasis; MLST8: mammalian lethal with sec-13 protein 8; RPTOR: the regulatory-associated protein of MTOR; PI3K: phosphoinositide 3-kinase; 4E-BP1: eIF4E binding protein 1; S6K1: ribosomal protein S6 kinases; AJCC: American Joint Commission on Cancer; MAF: minor allele frequency; CHB: Chinese Han, Beijing; TFBS: transcription factor binding site; LD: linkage disequilibrium; 3'UTR: 3'-untranslated region; 5'UTR: 5'-untranslated region; MST: median survival time; AML: acute myeloid leukemia.
Acknowledgements
This study was supported by funding from the Science and Technology Commission of Shanghai Municipality, China (Grant No.15ZR1427700), Shanghai Municipal Commission of Health and Family Planning (Grant No. 201540271) and China-Canada Joint Effort Program (Grant No. 2014DFG31460). We thank Dr. Qingyi Wei from Duke University Medical Center for his assistance in scientific editing and Ming Jia from Fudan University for his technical support.
Competing Interests
The authors have declared that no competing interest exists.
References
1. International Agency for Research on Cancer. GLOBOCAN 2012: Estimated Cancer Incidence, Mortality and Prevalence Worldwide in 2012. http://globocan.iarc.fr/Pages/fact_sheets_population.aspx
2. Torre LA, Bray F, Siegel RL. et al. Global cancer statistics, 2012. CA Cancer J Clin. 2015;65:87-108
3. Chen W, Zheng R, Baade PD. et al. Cancer statistics in China, 2015. CA Cancer J Clin. 2016;66:115-32
4. Vogiatzi P, Vindigni C, Roviello F. et al. Deciphering the underlying genetic and epigenetic events leading to gastric carcinogenesis. J Cell Physiol. 2007;211:287-95
5. Ma G, Gu D, Lv C. et al. Genetic variant in 8q24 is associated with prognosis for gastric cancer in a Chinese population. J Gastroenterol Hepatol. 2015;30:689-95
6. Ghoshal U, Tripathi S, Kumar S. et al. Genetic polymorphism of cytochrome P450 (CYP) 1A1, CYP1A2, and CYP2E1 genes modulate susceptibility to gastric cancer in patients with Helicobacter pylori infection. Gastric Cancer. 2014;17:226-34
7. García-González MA, Bujanda L, Quintero E. et al. Association of PSCA rs2294008 gene variants with poor prognosis and increased susceptibility to gastric cancer and decreased risk of duodenal ulcer disease. Int J Cancer. 2015;137:1362-73
8. Zhang G, Gu D, Zhao Q. et al. Genetic variation in C12orf51 is associated with prognosis of intestinal-type gastric cancer in a Chinese population. Biomed Pharmacother. 2015;69:133-8
9. Sabatini DM. mTOR and cancer: insights into a complex relationship. Nat Rev Cancer. 2006;6:729-34
10. Guertin DA, Sabatini DM. Defining the role of mTOR in cancer. Cancer Cell. 2007;12:9-22
11. Cantor JR, Sabatini DM. Cancer cell metabolism: one hallmark, many faces. Cancer Discov. 2012;2:881-98
12. Yang Q, Guan KL. Expanding mTOR signaling. Cell Res. 2007;17:666-81
13. Xu K, Liu P, Wei W. mTOR signaling in tumorigenesis. Biochim Biophys Acta. 2014;1846:638-54
14. Fingar DC, Richardson CJ, Tee AR. et al. mTOR controls cell cycle progression through its cell growth effectors S6K1 and 4E-BP1/eukaryotic translation initiation factor 4E. Mol Cell Biol. 2004;24:200-16
15. Edinger AL, Thompson CB. Akt maintains cell size and survival by increasing mTOR-dependent nutrient uptake. Mol Biol Cell. 2002;13:2276-88
16. Patel PH, Chadalavada RS, Chaganti RS. et al. Targeting von Hippel-Lindau pathway in renal cell carcinoma. Clin Cancer Res. 2006;12:7215-20
17. Murakami D, Tsujitani S, Osaki T. et al. Expression of phosphorylated Akt (pAkt) in gastric carcinoma predicts prognosis and efficacy of chemotherapy. Gastric Cancer. 2007;10:45-51
18. Tapia O, Riquelme I, Leal P. et al. The PI3K/AKT/mTOR pathway is activated in gastric cancer with potential prognostic and predictive significance. Virchows Arch. 2014;465:25-33
19. Ying J, Xu Q, Liu B. et al. The expression of the PI3K/AKT/mTOR pathway in gastric cancer and its role in gastric cancer prognosis. Onco Targets Ther. 2015;8:2427-33
20. Zhu ML, Yu H, Shi TY. et al. Polymorphisms in mTORC1 genes modulate risk of esophageal squamous cell carcinoma in eastern Chinese populations. J Thorac Oncol. 2013;8:788-95
21. He J, Wang MY, Qiu LX. et al. Genetic variations of mTORC1 genes and risk of gastric cancer in an Eastern Chinese population. Mol Carcinog. 2013;52(Suppl 1):E70-9
22. Brown EJ, Albers MW, Shin TB. et al. A mammalian protein targeted by G1-arresting rapamycin-receptor complex. Nature. 1994;369:756-8
23. Risson V, Mazelin L, Roceri M. et al. Muscle inactivation of mTOR causes metabolic and dystrophin defects leading to severe myopathy. J Cell Biol. 2009;187:859-74
24. Wu JJ, Liu J, Chen EB. et al. Increased mammalian lifespan and a segmental and tissue-specific slowing of aging after genetic reduction of mTOR expression. Cell Rep. 2013;4:913-20
25. Yang H, Rudge DG, Koos JD. et al. mTOR kinase structure, mechanism and regulation. Nature. 2013;497:217-223
26. Kim DH, Sarbassov DD, Ali SM. et al. GbetaL, a positive regulator of the rapamycin-sensitive pathway required for the nutrient-sensitive interaction between raptor and mTOR. Mol Cell. 2003;11:895-904
27. Kakumoto K, Ikeda J, Okada M. et al. mLST8 Promotes mTOR-Mediated Tumor Progression. Plos One. 2015;10:e0119015
28. Hara K, Maruki Y, Long X. et al. Raptor, a binding partner of target of rapamycin (TOR), mediates TOR action. Cell. 2002;110:177-189
29. Kim DH, Sarbassov DD, Ali SM. et al. mTOR interacts with raptor to form a nutrient-sensitive complex that signals to the cell growth machinery. Cell. 2002;110:163-175
30. Hoshii T, Tadokoro Y, Naka K. et al. mTORC1 is essential for leukemia propagation but not stem cell self-renewal. J Clin Invest. 2012;122:2114-29
31. Perl A. mTOR activation is a biomarker and a central pathway to autoimmune disorders, cancer, obesity, and aging. Ann N Y Acad Sci. 2015;1346:33-44
32. Chen M, Cassidy A, Gu J. et al. Genetic variations in PI3K-AKT-mTOR pathway and bladder cancer risk. Carcinogenesis. 2009;30:2047-52
33. Zhu J, Wang M, Zhu M. et al. Associations of PI3KR1 and mTOR Polymorphisms with Esophageal Squamous Cell Carcinoma Risk and Gene-Environment Interactions in Eastern Chinese Populations. Sci Rep. 2015;5:8250
34. Shao J, Li Y, Zhao P. et al. Association of mTOR polymorphisms with cancer risk and clinical outcomes: a meta-analysis. Plos One. 2014;9:e97085
35. Piao Y, Li Y, Xu Q. et al. Association of MTOR and AKT Gene Polymorphisms with Susceptibility and Survival of Gastric Cancer. PLoS One. 2015;10:e0136447
36. Li Q, Gu C, Zhu Y. et al. Polymorphisms in the mTOR gene and risk of sporadic prostate cancer in an Eastern Chinese population. PLoS One. 2013;8:e71968
37. Manolio TA. Genomewide association studies and assessment of the risk of disease. N Engl J Med. 2010;363:166-76
Author contact
![]() Corresponding authors: Mei-Ling Zhu, Department of Oncology, Xinhua Hospital, School of Medicine, Shanghai Jiao Tong University, Shanghai, 200092, China. Email: zhumeilingcom.cn; Leizhen Zheng, Department of Oncology, Xinhua Hospital, School of Medicine, Shanghai Jiao Tong University, Shanghai, 200092, China. Email: zhengleizhencom.cn.
Corresponding authors: Mei-Ling Zhu, Department of Oncology, Xinhua Hospital, School of Medicine, Shanghai Jiao Tong University, Shanghai, 200092, China. Email: zhumeilingcom.cn; Leizhen Zheng, Department of Oncology, Xinhua Hospital, School of Medicine, Shanghai Jiao Tong University, Shanghai, 200092, China. Email: zhengleizhencom.cn.