Impact Factor ISSN: 1837-9664

 Global reach, higher impact
J Cancer 2018; 9(1):1-12. doi:10.7150/jca.21747 This issue Cite
Research Paper
Aminoacylase 3 Is a New Potential Marker and Therapeutic Target in Hepatocellular Carcinoma
Kirill Tsirulnikov1, Sergio Duarte2, Anamika Ray3,4, Nakul Datta3, Ali Zarrinpar3,5, Lin Hwang6, Kym Faull6,7, Alexander Pushkin1 ![]() , Ira Kurtz1,7
, Ira Kurtz1,7 ![]()
1. Division of Nephrology, Department of Medicine, D. Geffen School of Medicine, University of California at Los Angeles, Los Angeles, CA, USA;
2. Dumont-UCLA Transplant Center, D. Geffen School of Medicine, University of California at Los Angeles, Los Angeles, CA, USA;
3. Department of Surgery, D. Geffen School of Medicine, University of California at Los Angeles, Los Angeles, CA, USA;
4. Current address: InnoSense LLC, Torrance, CA, USA;
5. Current address: Division of Transplantation and Hepatobiliary Surgery, Department of Surgery, College of Medicine, University of Florida, Gainesville, FL, USA;
6. Pasarow Mass Spectrometry Laboratory, Semel Institute for Neuroscience and Human Behavior, David Geffen School of Medicine, University of California at Los Angeles, Los Angeles, CA, USA;
7. Brain Research Institute, University of California at Los Angeles, Los Angeles, CA, USA.
Received 2017-7-3; Accepted 2017-10-10; Published 2018-1-1
Abstract
Ras proteins (HRas, KRas and NRas) are common oncogenes that require membrane association for activation. Previous approaches to block/inhibit Ras membrane association were unsuccessful for cancer treatment in human clinical studies. In the present study we utilized a new approach to decrease Ras membrane association in hepatocellular carcinoma (HCC) cell lines via inhibition of an enzyme aminoacylase 3 (AA3; EC 3.5.1.114). AA3 expression was significantly elevated in the livers of HCC patients and HCC cell lines. Treatment of HepG2 cells with AA3 inhibitors, and HepG2 and HuH7 with AA3 siRNA significantly decreased Ras membrane association and was toxic to these HCC cell lines. AA3 inhibitors also increased the levels of N-acetylfarnesylcysteine (NAFC) and N-acetylgeranylgeranylcysteine (NAGGC) in HepG2 and Huh7 cell lines. We hypothesized that AA3 deacetylates NAFC and NAGGC, and generated farnesylcysteine (FC) and geranylgeranylcysteine (GGC) that are used in HCC cells for the regeneration of farnesylpyrophosphate and geranylgeranylpyrophosphate providing the prenyl (farnesyl or geranylgeranyl) group for Ras prenylation required for Ras membrane association. This was confirmed experimentally where purified human AA3 was capable of efficiently deacetylating NAFC and NAGGC. Our findings suggest that AA3 inhibition may be an effective approach in the therapy of HCC and that elevated AA3 expression in HCC is potentially an important diagnostic marker.
Keywords: hepatocellular carcinoma, Ras prenylation, aminoacylase 3.
Introduction
Ras proteins are small GTPases and key regulators of diverse signal transduction pathways controlling cell growth, differentiation and apoptosis. They are also common oncogenes mutated in ~20% of all cancers [1-16]. Upregulation of Ras via its overexpression and the downregulation of physiological inhibitors of Ras have been observed in various cancers including hepatocellular carcinoma (HCC), the third leading cause of cancer-related death worldwide and the primary cause of death in patients with liver cirrhosis [17-21]. Ras proteins become active after their membrane association initiated by transfer of a prenyl, farnesyl (F) or geranylgeranyl (GG), group from F-pyrophosphate (F-PP) or GG-pyrophosphate (GG-PP) mediated by F-transferase (FTase) or GG-transferase (GGTase) respectively [9, 11, 22-24]. Carboxymethylation of the C-terminal prenylcysteine residue mediated by isoprenylcysteine carboxymethyltransferase (ICMT) completes the membrane association process of KRas, whereas HRas and NRas are further palmytoylated prior to membrane association. Ras proteins bind GTP with picomolar affinity that makes it difficult to block this process with inhibitors. Targeting Ras activity or Ras downstream effector signaling cascades in cancer therapy has been largely unsuccessful [6, 13, 14]. In addition, inhibition of the Ras prenylation enzymes (FTase or GGTase) individually was ineffective, while the simultaneous inhibition of both enzymes was toxic [6, 13, 14].
Given the lack of success of FTase and GGTase inhibition in blocking Ras membrane association, we chose a different approach to decrease Ras prenylation mediated by FTase and GGTase by decreasing the intracellular level of F-PP and GG-PP. Both F-PP and GG-PP are known to be synthesized in the mevalonate pathway [25-27]. Suppression of this pathway via inhibition of a key enzyme, 3-hydroxy-3-methyl-glutaryl-coenzyme A reductase, demonstrated antitumor activity although paradoxical stimulation of tumor activity was also reported [28]. The latter is not surprising given that Ras prenylation is normally required for apoptosis signaling that plays a role in tumor cell elimination [2-6]. A number of functionally important proteins also require prenylation for their activation [25,26]. We hypothesized that in addition to the mevalonate pathway, another pathway functions that may generate F-PP and GG-PP from FC and GGC released during catabolism of the prenylated Ras and other prenylated proteins. We propose that this pathway is controlled by N-acetyltransferases that acetylate excessive amounts FC and GGC generating N-acetyl-FC (NAFC) and N-acetyl-GGC (NAGGC) which cannot be used for the F-PP and GG-PP synthesis. In addition, NAFC and NAGGC can decrease Ras membrane association via inhibition of ICMT [29].
Our experiments demonstrated that the enzyme aminoacylase 3 (AA3; EC 3.5.1.114) is upregulated in livers of HCC patients and HCC cell lines. AA3 deacetylates NAFC and NAGGC thereby recovering FC and GGC for F-PP and GG-PP formation in the proposed pathway. Increased AA3 expression in HCC represents a new potentially important adjunct in diagnosis. Moreover, the finding that AA3 inhibition is toxic to HCC cell lines but not normal hepatocytes confirms the importance of its enzymatic role in HCC survival.
Materials and Methods
Cell lines
Human HCC cell lines HuH1, HuH7, JHH5, JHH7, HLE, HLF, and HepG2 were obtained from ATCC (Manassas, VA). The well-characterized HepG2 cell line was used in all experiments. The HuH7 cell line was also used in experiments to ensure the data was not specific only to the HepG2 cells. Plated primary hepatocytes were obtained from Corning Life Sciences (Woburn, MA). HCC cell lines were cultured in DMEM medium containing 10% fetal bovine serum (FBS) and 1% penicillin-streptomycin (Life Technologies, Grand Island, NY) at 37°C and 5% CO2. Primary hepatocytes were maintained in Williams Medium E with supplements (Corning Life Sciences) at 37°C and 5% CO2.
Measurement of AA3 and prenylated Ras expression in HCC cell lines
Cultured HCC cells and primary hepatocytes were washed with PBS buffer, treated with 0.25% Trypsin-EDTA solution (Corning) and precipitated at 1,000 rpm for 5 min. For protein extraction, HCC cells were lysed on ice by vortexing every 5 min for 30 min in RIPA buffer containing 20 mM Tris-HCl (pH 7.5), 150 mM NaCl, 5 mM EDTA, 1% Triton X-100, 0.5% sodium deoxycholate, 0.1% SDS, and 1x Halt protease inhibitor cocktail (Thermo Scientific, Waltham, MA). Prenylated Ras and other membrane associated proteins were extracted from HCC cells using a Mem-PER Plus Kit (Thermo Scientific) according to the manufacturer's protocol. Protein extracts were resolved on 4-15% SDS-polyacrilamide gels (Bio-Rad, Hercules, CA), and proteins were electrotransferred to Hybond PVDF membranes (GE Healthcare Life Sciences, Piscataway, NJ). Membranes were blocked with 5% non-fat dry milk (Bio-Rad) in PBST buffer (1x PBS with 0.05% Tween-20) followed by incubation with the primary antibody (1:1,000) for 1 h at room temperature. Our affinity purified polyclonal rabbit anti-human AA3 antibody HR-C1 [30] was used for detection of human AA3. The antibody, pre-incubated for 1 h at 37°C with 10 mg/ml purified recombinant human AA3, was used as a negative control. Rabbit polyclonal anti-Ras antibody 05-516, clone RAS10 (EMD Millipore, Gibbstown, NJ) was used for detection of human Ras. After incubation with primary antibodies, membranes were washed with PBST buffer and incubated 30 min with horseradish peroxidase (HRP) conjugated goat anti-rabbit IgG (Jackson ImmunoResearch, West Grove, PA) at 1:5,000 dilution, washed with PBST, and developed with an ECL Western Blotting Detection Reagent (GE Healthcare).
Protein concentration in the samples was determined using a Micro-BCA Protein Assay Kit (Thermo Scientific).
Immunohistochemistry
Normal human and HCC liver samples were obtained under an Institutional Review Board approved protocol (#12-000647). Samples were fixed in 10% buffered formalin and embedded in paraffin blocks from which 4 µm liver sections were transferred to slides. Slides were baked at 40°C overnight in incubator, dewaxed in xylene and hydrated through an alcohol gradient (100%, 95%, 90%, 70%) and double distilled H2O. For antigen retrieval, slides were incubated at ~95°C in 10 mM sodium citrate buffer, pH 6.0, for 20 min. The slides were then soaked in PBST and blocked with 1% goat serum (Vector labs, Burlingame, CA) in PBS for 1 h. The slides were next incubated for 1 h at 37°C with HR-C1 antibody diluted 1:100 in PBS. After washing in PBS, the slides were incubated at room temperature with a HRP conjugated secondary goat anti-rabbit antibody (Jackson Immunoresearch) diluted 1:100 in PBS. After rinsing in PBS, the slides were incubated with DAB peroxidase substrate solution (Vector Labs, Burlingame, CA) for 45 s. The slides were counterstained in hematoxylin for 5 min and washed in running tap water. Finally, the slides were dried overnight, soaked in xylene and mounted in Permount. Slides without primary antibody incubation were used as negative controls. AA3 labeling was evaluated in a semi-quantitative manner, wherein the relative staining intensity was defined as negative (-), minimal (+), moderate (++) and high (+++).
Expression and purification of human AA3
Human N-terminally 6His-tagged AA3 was expressed in E. coli and purified to homogeneity as described previously [31]. Purified human AA3 on denaturing SDS-PAGE showed a single band of ~35 kDa and was ~99% homogeneous.
Rat aminoacylase 1 (AA1)
Purified rat AA1 (EC 3.5.1.14) was purchased from (Sigma-Aldrich, St. Louis, MO).
Immunoaffinity purification of AA3 from HepG2 and HuH7 cells, and normal hepatocytes
Because extracts from HepG2 and HuH7 cells and hepatocytes contained compounds that interfered with AA3 activity measurement in the fluorescent assay [32], we performed partial purification of AA3. HepG2 and HuH7 cells collected from two 10-cm plates (2·107 cells) or equal number of normal hepatocytes were lysed on ice for 20 min in 0.5 ml of 50 mM Na-phosphate buffer, pH 7.5, containing 0.1% Triton X-100, and 1x Halt protease inhibitor cocktail (Thermo Scientific). After centrifugation at 18,000 g for 20 min, the supernatant was incubated at 4°C and constant rotation (5 rpm) for 1 h with our HR-C1 antibody immobilized on 10 µl protein A Sepharose 4B-CL beads (GE HealthCare). To immobilize the anti-AA3 antibody, 2.0 ml protein A Sepharose 4B-Cl beads were incubated at 4°C and rotated of 5 rpm for 1 h with 8 ml HR-C1 antibody (1 mg/ml) and washed 3 times with 50 mM sodium phosphate buffer.
AA3 activity fluorescent assay
AA3 activity was measured using a previously described fluorescence assay [32]. Human purified AA3 (1 µg), rat AA1 (1 µg) or immunoaffinity purified AA3 from HepG2 and HuH7 cells were assayed for 30 min at 37° in 300 µl of 50 mM sodium phosphate buffer, pH 7.5, containing 1 mM NAFC or NAGGC both from Cayman Chemical (Ann Arbor, MI). A 100 µl of the reaction mixture was then added to 1 ml of 50 mM sodium phosphate buffer containing 1 mM fluorescamine, and fluorescence was measured (390 nm excitation, 475 nm emission). In the control experiments, boiled human AA3 and rat AA1 were used. In other control experiments, immunoaffinity beads not incubated with HCC cell or hepatocyte extracts were used.
Mass spectrometry study of the AA3 mediated deacetylation of NAFC and NAGGC
To study the deacetylation of NAFC and NAGGC mediated by AA3, 50 µl aliquots from the reaction assays were injected onto an Agilent Eclipse Plus C18 reverse phase HPLC column equilibrated with 0.1% formic acid, and eluted with acetonitrile/0.1% formic acid gradient (0-90%, 20 min). The effluent from the column was passed to an Ionspray ion source connected to a triple quadrupole mass-spectrometer (MS) API III+ (PerkinElmer, Boston, MA). NAFC and NAGGC (Cayman Chemical) were used for MS calibration.
AA3 inhibitors
Our AA3 inhibitors [33] (Ki~1 µM) were used in HCC cell and normal hepatocyte assays, namely inhibitor 10: 2-phenyl-4H-1,3-benzothiazin-4-one (Specs, Hopkinton, RI) and inhibitor 11: 2-[(3-fluoro-4-methoxybenzyl)sulfanyl]-1-methyl-1H-benzimidazole-5-sulfonamide (Enamine, Monmouth Jct., NJ).
Generation of FC and GGC
To generate authentic FC and GGC for chromatographic and MS calibration, 1 mM NAFC and NAGGC purchased from Cayman Chemical were hydrolyzed with purified recombinant human AA3 (0.03 mg/ml) in 50 mM Tris-HCl, pH 7.5 for 3 h at 37°C. Then FC and GGC were purified by reverse phase HPLC, dried and their identity was confirmed by MS and MS/MS.
Levels of FC and NAFC in HUH-7 and HepG2 cells
HUH7 and HepG2 cells were seeded in 6-well plates at a density 250,000 cells per well in complete medium. The next day the medium was changed to 2 ml DMEM with 1% FBS containing a 10-20 µM AA3 inhibitor. After 24 h incubation, the medium was collected, concentrated 10 times on a vacuum concentrator; 10 µl aliquots were used for quantitation by LC/MS and LC/MS/MS-MRM. The cells were trypsinized, washed in PBS and centrifuged at 2,000 g for 10 min. The cell pellet was then lysed on ice in 50 µl of 20 mM Tris-HCl, pH 7.5, containing 1% dodecyl maltoside (DDM) and 1x protease inhibitor cocktail (Sigma/Aldrich). After centrifugation (14,000 g, 10 min) the supernatants were diluted 4 times with methanol and centrifuged (14,000 g,10 min), then the supernatants were diluted 10 times with water, and 10 µl aliquots were used for quantitation by LC/MS and LC/MS/MS-MRM as described above expect electrospray ionization was used with an Agilent 6460 triple quadrupole mass spectrometer.
Effect of AA3 inhibitors and siRNA on the membrane associated Ras in HCC cells
HepG2 cells were seeded in 6-well plates at a density 250,000 cells per well. Next day the cell medium was changed to DMEM, containing 1% FBS without or with AA3 inhibitors 10 and 11 (IC50 ~1 µM). 24 h later cells were collected, washed with PBS and the membrane associated Ras proteins were extracted as described above, resolved on SDS-PAGE, and detected with the anti-Ras antibody (EMD Millipore).
To study the effect of AA3 suppression on Ras membrane association, HepG2 and HuH7 cells seeded onto 6-well plates at the same density, were transfected with 50 pmol ACY3 (AA3) Silencer Select Pre-designed siRNA (Invitrogen, Grand Island, NY) using the Lipofectamine RNAiMAX reagent (Invitrogen) following the manufacturer protocol. Universal scrambled siRNA duplex (OriGene, Rockville, MD) was used as a negative control. After 48 h incubation, membrane associated proteins were extracted and membrane associated Ras was determined by immunoblotting as described above.
Toxicity of AA3 inhibitors and siRNA to HCC cell lines and primary hepatocytes
HepG2, HuH7, and primary hepatocytes were seeded in 96-well plates at a density 10,000 cells per well in complete medium. Next day medium was changed to DMEM containing 1% FBS and an AA3 inhibitor (3-50 µM). 24 h later cell viability was determined using the MTT (3-(4,5-dimethylthiazol-2-yl)-2,5-diphenyltetrazolium bromide) cell viability assay [34]. The cells were incubated during 4 h at 37°C with 150 µl fresh media containing 0.5 mg/ml MTT. Then 50 µl of 20% SDS in 25 mM HCl was added to each well, incubated for 4 h and the optical density at 570 nm was measured on a VMax Kinetic Microplate Reader (Molecular Devices, Sunnyvale, CA).
To study the effect of AA3 silencing, HepG2 and HUH7 cells seeded in 96-well plates were transfected with 2 pmol AA3 siRNA using the Lipofectamine RNAiMAX reagent as per the manufacturer protocol. Cell viability was measured in the MTT assay 48 h later as described.
Statistics
Experimental data are depicted as mean ± SEM. 3-8 studies were performed in each experimental protocol.
Results
Expression of AA3 in primary hepatocytes, HCC cell lines, normal and HCC livers
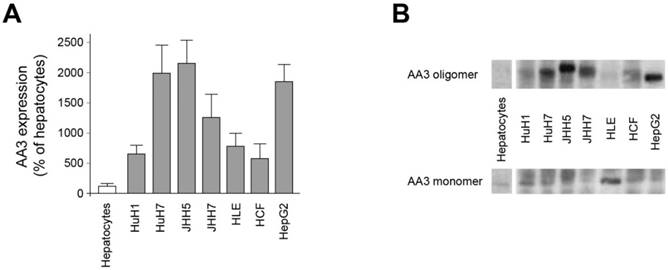
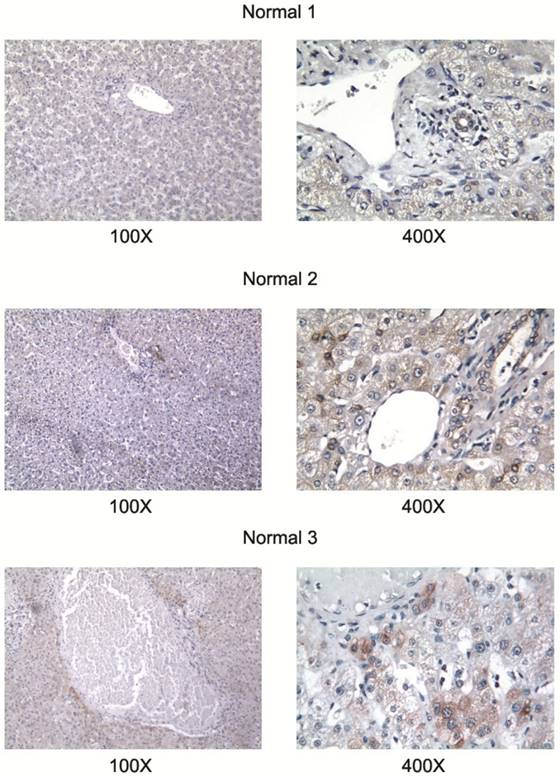
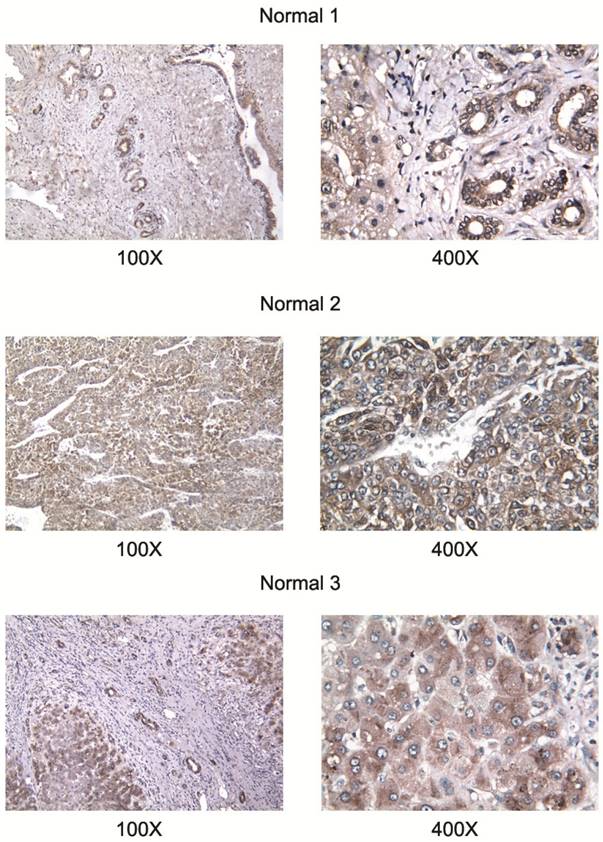
All studied HCC cell lines (HuH1, HuH7, JHH5, JHH7, HLE, HCF and HepG2) expressed AA3 (Figure 1). AA3 expression in the HCC cell lines was 5 to 20 times greater than in normal primary hepatocytes (Figure 1A). There were two AA3 bands of ~35 and 90-100 kDa (Figure 1B). The immunostaining was blocked by pre-incubation of HR-C1 antibody with purified human AA3. The higher mobility band corresponded to the AA3 monomer (~35 kDa) that has been reported to be expressed in normal mammalian kidney and liver [32, 35-38]. The ~90-100 kDa band was detected in most HCC cell lines but not in normal hepatocytes (Figure 1). We next studied the protein expression level of AA3 in normal liver and HCC livers. As shown in Figure 2, AA3 protein is expressed mostly in hepatocytes with weak expression in biliary epithelial cells (Figure 2). AA3 expression in normal liver was negative (-) to minimal (+), and was moderate (++) to high (+++) in HCC livers (Figure 3).
AA3 expression in normal hepatocytes and HCC cells lines. (A) AA3 relative expression levels in HCC cell lines in comparison with normal hepatocytes. Combined AA3 monomer and oligomer levels were used for calculations obtained in 3 independent experiments. (B) A representative AA3 immunoblot of normal hepatocytes and HCC cell lines. The HR-C1 antibody was used for human AA3 immunoblotting. Loading: 10 μg per lane.
AA3 expression in normal livers. The HR-C1 antibody was used for AA3 immunodetection.
AA3 expression in liver tumors of HCC patients. The HR-C1 antibody was used for AA3 immunodetection.
AA3 deacetylates NAFC and NAGGC
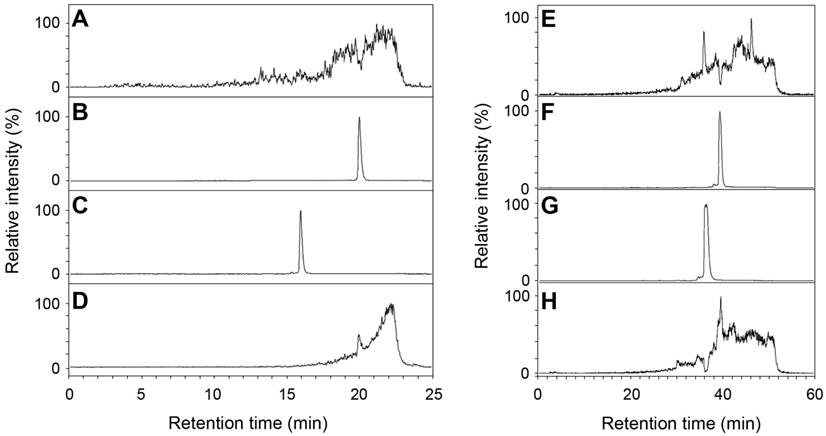
Human AA3 efficiently deacetylates NAFC (Figure 4A-D) and NAGGC (Figure 4E-H) generating FC and GGC respectively. Kinetic parameters for these substrates (Km: 0.025 and 0.14 mM; kcat: 2 and 7.2 s-1 for NAFC and NAGGC, respectively) are similar to the other AA3 substrates, N-acetylated aromatic amino acids and mercapturic acids [30-33, 38, 39].
Deacetylation of NAFC (A-D) and NAGCC (E-H) by human AA3. The reconstructed ion traces are the (M+H)+ ions from FC (m/z 326), NAFC (m/z 368), GGC (m/z 394) and NAGGC (m/z 436). Reconstructed ion chromatograms for m/z 326 (A, C), m/z 368 (B, D), m/z 394 (E, G) and m/z 436 (F, H). NAFC (A, B), NAFC + AA3 (C, D), NAGGC (E, F), and NAGGC + AA3 (G, H).
AA1 (EC 3.5.1.14), in addition to AA3, has been reported to deacetylate certain mercapturic acids [36], although the substrate specificity of AA1 differed from AA3 [30-33, 39]. Therefore, we determined whether AA1 deacetylates NAFC and NAGGC. In our experiments rat AA1 that has high sequence identity with human AA1 did not significantly deacetylate these mercapturates: the specific activity was less than 0.1% of the corresponding value of AA3 and therefore the exact activity value could not be estimated (Figure 5A).
(A) Human AA3 and rat AA1 deacelylation activities with NAFC and NAGGC as substrates. The activities were measured in the fluorescent assay (see methods). (B) Deacetylation activity with NAFC and NAGGC as substrates of immunoaffinity purified AA3 from HuH7 and HepG2 cells, and normal primary hepatocytes (Hep).
Since HCC cell lines express the ~90-100 kDa form that may change the ability of AA3 to deacetylate NAFC and NAGGC, we assayed (in the fluorescence assay) each of the mercapturates with AA3 immunoaffinity purified from HepG2 and HuH7 cells, and normal hepatocytes. AA3 from both cell lines deacetylated both mercapturates and N-acetyl-L-tyrosine with near similar specific activity (Figure 5B) whereas the deacetylation rate of the substrates by the sample from normal hepatocytes was significantly lower. The amount of ~35 kDa AA3 form was very similar and small in all samples whereas the amount of ~90-100 kDa AA3 form in both HepG2 and HuH7 cells was ~50 times greater than of ~35 kDa form and this form was not expressed in normal hepatocytes. The finding and the significantly greater AA3 activity of HCC samples indicates that the ~90-100 kDa AA3 form is catalytically active and deacetylates NAFC and NAGGS. Therefore, AA3 is likely responsible for the NAFC and NAGGC deacetylation in normal hepatocytes, and in HCC cell lines.
Effect of AA3 inhibitors on FC and NAFC levels in HCC cell lines
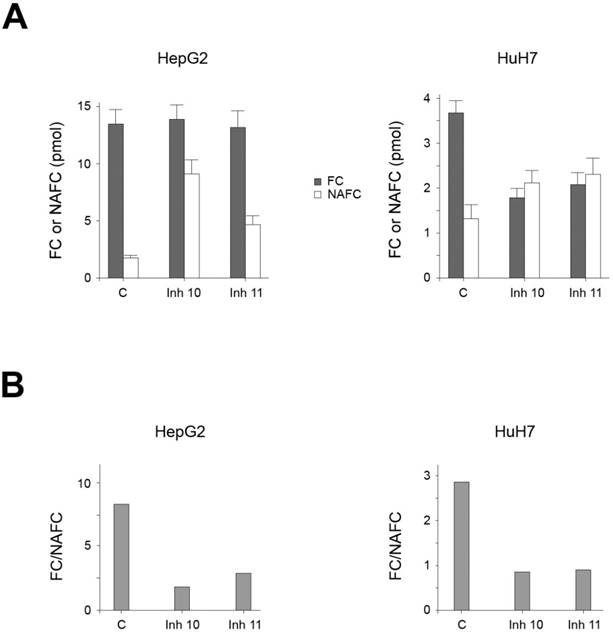
Our data suggest that AA3 deacetylates and therefore decreases the level of NAFC and NAGGC in HCC cells, and conversely AA3 inhibition should increase these levels. Accordingly, we measured NAFC and FC levels in HCC cells before and after treatment with AA3 inhibitors [33]. In untreated HepG2 and HuH7 cell lines, both FC and NAFC were detected. The FC level in both cell lines was significantly higher than NAFC (Figure 6). The FC level in HepG2 cells was higher than in HuH7 cells whereas the NAFC level in both cell lines was similar. Correspondingly the [FC]/[NAFC] ratio in HepG2 cells was slightly smaller (~2.6) then HepG2 cells (~3.7). Treatment with AA3 inhibitors 10 and 11 significantly increased the level of NAFC in both cell lines. The FC level was not significantly changed in HepG2 cell line, and in HuH7 cell lines decreased by approximately 50%. In the HepG2 cell line, the [FC]/[NAFC] ratio decreased from ~8.4 in untreated cells to ~1.6 and ~2.8 in cells treated with inhibitors 10 and 11 respectively. In HuH7 cells, the [FC]/[NAFC] ratio decreased from ~2.8 in untreated cells to ~0.85 and ~0.9 in cells treated with inhibitors 10 and 11 respectively. Therefore, the magnitude of changes in this ratio induced by inhibitors 10 and 11 in both cell lines was quite similar: 3.0-5.3 in HepG2 and 3.1-3.3 in HuH7 cells.
(A) FC and NAFC levels in HUH7 and HepG2 cells untreated (C: control) and treated with inhibitors (Inh) 10 and 11. (B) The effect of inhibitors 10 and 11 on the [FC]/[NAFC] ratio in HepG2 and HuH7 cell lines.
AA3 inhibitors and siRNA decrease membrane associated Ras in HepG2 cells
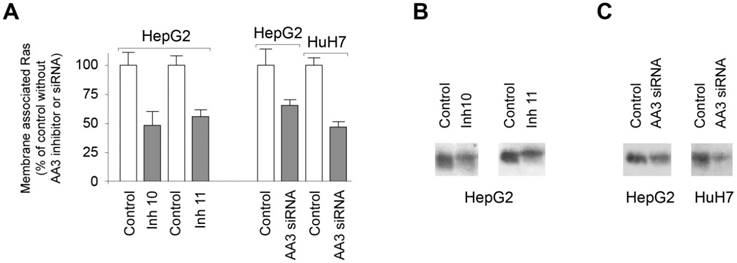
We next tested our prediction that AA3 inhibition as well as decreased AA3 synthesis should reduce Ras membrane association in HCC cells. Treatment of HepG2 cells with inhibitors 10 and 11 decreased levels of membrane associated Ras (Figure 7A, B). The level of the membrane associated Ras with inhibitors 10 and 11 was decreased to ~50% of control. Human AA3 siRNA also decreased levels of the membrane associated Ras in HepG2 and HUH7 cell lines (Figure 7A, B). The reduction was greater in HUH7 than HepG2 cells. The data indicated that AA3 inhibition or suppression of synthesis via RNA interference decreases the level of membrane associated Ras and therefore these treatments are toxic to HCC cells.
(A) Levels of the membrane associated Ras in HepG2 and HuH7 cells treated with AA3 inhibitors 10 (Inh 10) and 11 (Inh 11), and AA3 siRNA. Control: untreated HepG2 cells (in study effect of inhibitors) or HepG2 and HuH7 cells treated with universal scrambled siRNA duplex (in study effect of AA3 siRNA). (B) Levels of the membrane associated Ras in HepG2 cells treated with inhibitors 10 and 11. Loading: 20 μg per lane. (C) HepG2 and HUH7 cells treated with universal scrambled siRNA duplex (control) and AA3 siRNA. Loading: 20 μg per lane.
Effect of AA3 inhibitors and siRNA on the viability of HCC cell lines
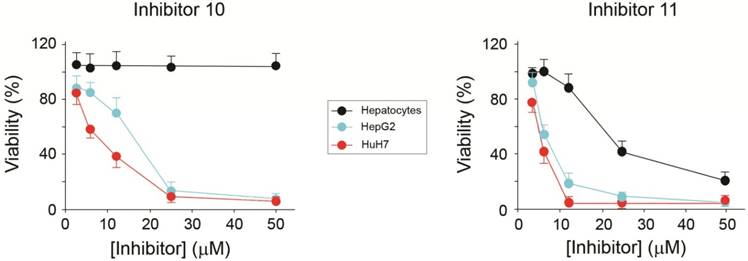
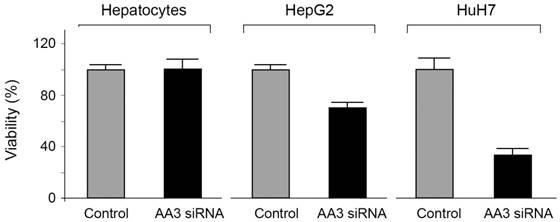
The viability of HCC cells in the presence of AA3 inhibitors was further studied. Inhibitors 10 and 11 were toxic to both HepG2 and HuH7 cell lines within the micromolar range (Figure 8). Importantly inhibitor 10 was not toxic to normal primary hepatocytes in 0-50 μM range, and inhibitor 11 was significantly less toxic to normal cells in comparison with HCC cell lines. Suppression of AA3 with siRNA was also toxic to both HepG2 and HuH7 cell lines and not toxic to normal hepatocytes (Figure 9) complementing the AA3 inhibition data (Figure 7). In total, our findings suggest that AA3 activity is more important for HCC cell survival than normal hepatocytes.
Effect of AA3 inhibitors 10 and 11 on the HepG2 and HuH7 cell viability.
Effect of AA3 siRNA on the viability of normal hepatocytes, HepG2 and HuH7 cells.
Discussion
Ras proteins are important mediators of signal transduction and potent oncogenes that have been long targets of anticancer therapy studies. Despite numerous efforts to generate approaches that block Ras activation in cancer, clinical studies using these approaches have failed.
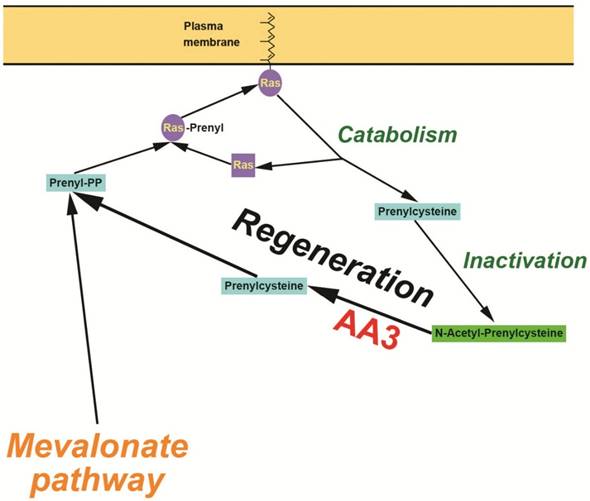
We report here a new method to suppress HCC cell growth via inhibition of Ras membrane association, the step critically required for their activation from inactive precursors. Contrary to the previous clinically unsuccessful efforts to directly inhibit FTase and GGTase [3-6, 12-15], our method decreases generation of the substrates of FTase and GGTase, F-PP and GG-PP, thereby impeding Ras membrane association (Figure 10). F-PP and GG-PP are normally synthesized in the mevalonate pathway [25-27]. Previous studies suggested that F-PP and GG-PP might be also generated from FC and GGC by an alternate pathway [40, 41]. Our data are compatible with the presence of an alternate pathway involved in the formation of prenylpyrophosphates from FC and GGC generated during catabolism of prenylated proteins. This pathway likely functions in normal cells, but is expected to play a significantly larger role in cancer cells in comparison with normal cells given the highly enhanced metabolism and catabolism of scavenging proteins (e.g. FC and GGC) formed in the catabolism of prenylated proteins to support their enhanced biosynthesis and growth rates [26, 27]. Based on the inhibition rate of Ras membrane association by AA3 siRNA (Figure 7), this route may provide as much as 50% of the total F-PP and GG-PP amounts used for Ras prenylation in HCC cells. Given that the efficacy of siRNA transfection is below 100%, the route may contribute even for more F-PP and GG-PP generation than the mevalonate pathway.
Hypothetical mechanism of the AA3 initiated regeneration of prenyl-PP in HCC cells.
An important finding of our study is the significantly elevated expression level of AA3 in HCC cell lines and tumors that may also be of diagnostic value in other the Ras dependent cancers. This finding together with what appears to be a cancer specific high molecular mass form of AA3 may be of diagnostic value. Currently it is not known at which step in hepatocyte tumor transformation AA3 expression is stimulated and what are the mechanisms involved in this process.
An additional interesting finding in our study is the ~90-100 kDa AA3 form that is significantly larger than the typical ~35 kDa AA3 form expressed in normal tissues [27, 30, 32, 33, 35-37, 39]. The larger form may be specific for tumors given that a similar size AA3 form has been reported in neuroblastoma [42]. Our data indicate that ~90-100 kDa AA3 form is functionally active and together with the normal ~35 kDa AA3 form mediates the deacetylation of NAFC and NAGGC. Although the functional significance of the ~90-100 kDa over the typical ~35 kDa AA3 form is currently unknown, it is possible that ~90-100 kDa AA3 form has more favorable kinetic characteristics, half-life or other properties to that support tumor cell growth in comparison with the normal AA3 form. Future studies are needed to determine at which stage of hepatocyte tumor transformation the larger AA3 form is expressed.
Abbreviations
AA3: Aminoacylase 3;
NAFC: N-acetylfarnesylcysteine;
NAGGC: N-acetylgeranylgeranylcysteine;
DMEM: Dulbecco's Modified Eagle Medium;
FBS: Fetal Bovine Serum;
FC: Farnesylcysteine;
F-PP: Farnesylpyrophosphate;
FTase: Farnesyltransferase;
GGC: Geranylgeranylcysteine;
GG-PP: Geranylpyrophosphate;
GGTase: Geranylgeranyltransferase;
HCC: hepacellular carcinoma;
IMCT: Isoprenylcysteine carboxymethyltransferase;
MTT: 3-(4,5-dimethylthiazol-2-yl)-2,5-diphenyltetrazolium bromide;
PBS: Phosphate buffered saline;
siRNA: Small Interfering RNA (siRNA).
Acknowledgements
This work was supported in part by the Ralph Block Family Research Fund, the Allan Smidt Charitable Fund, the Factor Family Foundation Chair in Nephrology, and an American College of Surgeons Research Fellowship.
Ethical approval
Human normal and HCC liver samples were obtained under an Institutional Review Board approved protocol (#12-000647) in accordance with the ethical standards of the Institutional Review Board and the 1964 Helsinki Declaration and its later amendments.
Competing Interests
Kirill Tsirulnikov, Alexander Pushkin and Ira Kurtz are inventors on the US Provisional Patent Application 62/288,086 titled “Inhibition of Aminoacylase 3 (AA3) in the Treatment of Cancer”.
References
1. Hobbs GA, Der CJ, Rossman KL. RAS isoforms and mutations in cancer at a glance. J Cell Sci. 2016;129:1287-92
2. Bos JL. Ras oncogenes in human cancer: a review. Cancer Res. 1989;49:4682-9
3. Zhang F, Cheong JK. The renewed battle against RAS-mutant cancers. Cell Mol Life Sci. 2016;73:1845-58
4. Ryan MB, Der CJ, Wang-Gillam A, Cox AD. Targeting RAS-mutant cancers: is ERK the key? Trends Cancer. 2015;1:183-98
5. McCormick F. K-Ras protein as a drug target. J Mol Med (Berl). 2016;94:253-8
6. Cox AD, Der CJ, Philips MR. Targeting RAS membrane association: back to the future for anti-RAS drug discovery? Clin Cancer Res. 2015;21:1819-27
7. Shaw RJ, Cantley RC. Ras, PI(3)K and mTOR signaling controls tumour cell growth. Nature. 2006;441:424-30
8. Campbell SL, Khosravi-Far R, Rossman KL. et al. Increasing complexity of Ras signaling. Oncogene. 1998;17:1395-413
9. Lowy DR, Willumsen BM. Function and regulation of Ras. Annu Rev Biochem. 1993;62:851-91
10. Chetty R, Govender D. Gene of the month: KRAS. J Clin Pathol. 2013;66:548-50
11. Konstantinopoulos PA, Karamouzis MV, Papavassiliou AG. Post-translational modifications and regulation of the RAS superfamily of GTPases as anticancer targets. Nat Rev Drug Discov. 2007;6:541-55
12. Cox AD, Fesik SW, Kimmelman AC. et al. Drugging the undruggable RAS: Mission possible? Nat Rev Drug Discov. 2014;13:828-51
13. McCormick F. KRAS as a therapeutic target. Clin Cancer Res. 2015;21:1797-801
14. Pasca di Magliano M, Logsdon CD. Roles for KRAS in pancreatic tumor development and progression. Gastroentherol. 2013;144:1220-9
15. Huang H, Daniluk J, Liu Y. et al. Oncogenic K-Ras requires activation for enhanced activity. Oncogene. 2014;33:532-5
16. Downward J. Targeting RAS signaling pathways in cancer therapy. Nat Rev Cancer. 2003;3:11-22
17. Teufel A, Staib F, Kanzler S. et al. Genetics of hepatocellular carcinoma. World J Gastroenterol. 2007;13:2271-82
18. Wong CM, Ng IO. Molecular pathogenesis of hepatocellular carcinoma. Liver Int. 2008;28:160-74
19. Villanueva A, Llovet JM. Targeted therapies for hepatocellular carcinoma. Gastroenterology. 2011;140:1410-26
20. Sangiovanni A, Del Ninno E, Fasani P. et al. Increased survival of cirrhotic patients with a hepatocellular carcinoma detected during surveillance. Gastroenterology. 2004;126:1005-14
21. El-Serag HB. Hepatocellular carcinoma. N Engl J Med. 2011;365:1118-27
22. Zhang FL, Casey PJ. Protein prenylation: molecular mechanisms and functional consequences. Annu Rev Biochem. 1996;65:241-69
23. Gao L, Liao J, Yang GY. CAAX-box protein, prenylation process and carcinogenesis. Am J Transl Res. 2009;1:312-25
24. Whyte DB, Kirschmeier P, Hockenberry TN. et al. K- and N-Ras are geranylgeranylated in cells treated with farnesyl protein transferase inhibitors. J Biol Chem. 1997;272:14459-64
25. Buhaescu I, Izzedine H. Mevalonate pathway: A review of clinical and therapeutical implications. Clin Biochem. 2007;40:575-84
26. Mullen PJ, Yu R, Longo J. et al. The interplay between cell signaling and the mevalonate pathway in cancer. Nat Rev Cancer. 2016;16:718-31
27. Boroughs LK, DeBerardinis RJ. Metabolic pathways promoting cancer cell survival and growth. Nat Cell Biol. 2015;17:351-9
28. Zhou YY, Zhu GQ, Wang Y. et al. Systematic review with network meta-analysis: statins and risk of hepatocellular carcinoma. Oncotarget. 2016;7:21753-62
29. Svensson AW, Casey PJ, Young SG. et al. Genetic and pharmacologic analyses of the role of Icmt in Ras membrane association and function. Methods Enzymol. 2006;407:144-59
30. Tsirulnikov K, Abuladze N, Newman D. et al. Mouse aminoacylase 3: A metalloenzyme activated by cobalt and nickel. Biochim Biophys Acta. 2009;1794:1049-57
31. Hsieh JM, Tsirulnikov K, Sawaya MR. et al. Structures of aminoacylase 3 in complex with acetylated substrates. Proc Nat Acad Sci USA. 2010;107:17962-67
32. Pushkin A, Carpenito G, Abuladze N. et al. Structural characterization, tissue distribution, and functional expression of murine aminoacylase III. Am J Physiol. 2004;286:C848-56
33. Tsirulnikov K, Abuladze N, Bragin A. et al. Inhibition of aminoacylase 3 protects rat brain cortex neuronal cells from the toxicity of 4-hydroxy-2-nonenal mercapturate and 4-hydroxy-2-nonenal. Toxicol Appl Pharmacol. 2012;263:303-14
34. Mosmann T. Rapid colorimetric assay for cellular growth and survival: application to proliferation and cytotoxicity assays. J Immunol Methods. 1983;65:55-63
35. Endo Y. N-acyl-l-aromatic amino acid deacylase in animal tissues. Biochim Biophys Acta. 1978;523:207-14
36. Suzuki S, Tateishi M. Purification and characterization of a rat liver enzyme catalyzing N-deacetylation of mercapturic acid conjugates. Drug Metab Dispos. 1981;9:573-7
37. Uttamsingh V, Anders MW. Acylase-catalyzed deacetylation of haloalkene-derived mercapturates. Chem Res Toxicol. 1999;12:937-42
38. Anders MW, Dekant W. Aminoacylases. Adv Pharmacol. 1994;27:431-48
39. Newman D, Abuladze N, Scholz K. et al. Specificity of aminoacylase III-mediated deacetylation of mercapturic acids. Drug Metab Dispos. 2007;35:43-50
40. Bentinger M, Grünler J, Peterson E. et al. Phosphorylation of farnesol in rat liver microsomes: properties of farnesol kinase and farnesyl phosphate kinase. Arch Biochem Biophys. 1998;353:191-8
41. Chung YT, Matkowskyj KA, Li H. et al. Overexpression and oncogenic function of aldo-keto reductase family 1B10 (AKR1B10) in pancreatic carcinoma. Mod Pathol. 2012;25:758-66
42. Long PM, Stradecki HM, Minturn JE. et al. Differential aminoacylase expression in neuroblastoma. Int J Cancer. 2011;129:1322-30
Author contact
![]() Corresponding authors: Alexander Pushkin, Department of Medicine, David Geffen School of Medicine, University of California at Los Angeles, 10833 Le Conte Avenue, 7-155 Factor Building, Los Angeles, CA 90095-1689, USA, email: apushkinucla.edu, phone: 1-310-206-6741; fax: 1-310-825-6309; Ira Kurtz, Department of Medicine, David Geffen School of Medicine, and Brain Research Institute, University of California at Los Angeles, 10833 Le Conte Avenue, 7-155 Factor Building, Los Angeles, CA 90095-1689, USA, email: ikurtzucla.edu, phone: 1-310-206-6741; fax: 1-310-825-6309
Corresponding authors: Alexander Pushkin, Department of Medicine, David Geffen School of Medicine, University of California at Los Angeles, 10833 Le Conte Avenue, 7-155 Factor Building, Los Angeles, CA 90095-1689, USA, email: apushkinucla.edu, phone: 1-310-206-6741; fax: 1-310-825-6309; Ira Kurtz, Department of Medicine, David Geffen School of Medicine, and Brain Research Institute, University of California at Los Angeles, 10833 Le Conte Avenue, 7-155 Factor Building, Los Angeles, CA 90095-1689, USA, email: ikurtzucla.edu, phone: 1-310-206-6741; fax: 1-310-825-6309