Impact Factor ISSN: 1837-9664

 Global reach, higher impact
J Cancer 2017; 8(19):4065-4074. doi:10.7150/jca.21401 This issue Cite
Research Paper
Proteomic analysis of lung metastases in a murine breast cancer model reveals divergent influence of CTSB and CTSL overexpression
Florian Christoph Sigloch1,2, Martina Tholen1,2,3,4, Alejandro Gomez-Auli1,2,3, Martin Lothar Biniossek1, Thomas Reinheckel1,5,6, Oliver Schilling1,5,6 ![]()
1. Institute of Molecular Medicine and Cell Research, Medical Faculty, University of Freiburg, D-79104 Freiburg, Germany
2. Faculty of Biology, University of Freiburg, D-79104 Freiburg, Germany
3. Spemann Graduate School of Biology and Medicine (SGBM), University of Freiburg, D-79104 Freiburg, Germany
4. Present address: Department of Pathology, Stanford University School of Medicine, 300 Pasteur Drive, Stanford, California 94305, United States
5. BIOSS Centre for Biological Signaling Studies, University of Freiburg, Freiburg, Germany
6. German Cancer Consortium (DKTK) and German Cancer Research Center (DKFZ), Heidelberg, Germany
Received 2017-6-9; Accepted 2017-8-9; Published 2017-10-23
Abstract
Studies in the MMTV-PyMT (PyMT) breast cancer mouse model have shown a strong influence of the lysosomal cysteine cathepsins B or L on lung metastasis formation. Transgenic expression of human CTSB (tgCTSB) or CTSL (tgCTSL) both led to similar metastatic phenotypes with increased metastatic burden in the PyMT mice. However, recent studies in other tumor models proved marked differences in effects of either cathepsin on the proteome composition. We sought to analyze and compare proteome changes in the metastatic proteome of PyMT mice expressing either tgCTSB or tgCTSL to evaluate similarities and differences in those models.
Performing an explorative, quantitative proteome comparison based on LC-MS/MS, we identified up to 3,000 proteins from murine lung metastases in three independent biological replicates per genotype. In both cases, when compared to wild-type (WT) mice, we noticed a pronounced impact of transgene cathepsin expression on the metastasis proteome. Highlights include increased moesin, integrin beta 1 and vinexin levels in the tgCTSB dataset and increased saposin and granulin levels in the tgCTSL dataset. Importantly, non-supervised hierarchical clustering clearly separated tgCTSB vs. tgCTSL induced proteome changes.
In summary, tgCTSB and tgCTSL both display a strong and distinct impact on proteome composition of lung macrometastases in the PyMT model. Our observations suggest that they impact malignant behavior in distinct ways, thus further emphasizing interest into their tumor-contextual functionality.
Introduction
The proteases cathepsin B (CTSB) and cathepsin L (CTSL) are well described to be highly expressed in many human cancer entities (reviewed in [1]). Both cathepsins are linked to poor outcome and have been proposed as independent tumor markers in breast cancer [2], lung squamous cell carcinoma [3], pancreatic adenocarcinoma [4] and ovarian cancer [5]. CTSB and CTSL are predominantly localized in the lysosome, but are also commonly secreted in the extracellular environment [6], where they interact with proteins of the plasma membrane [7,8]. Despite their pH optimum in the acidic range [9,10], a growing body of evidence supports extracellular activity of CTSB and CTSL, which is facilitated by binding to glycosaminoglycans [11,12]. We recently reported that CTSB influences ADAM-10-dependent shedding independent of its proteolytic activity [13].
The impact of cysteine cathepsins on overall tumor phenotype and metastasis formation has been analyzed in different murine mouse models. In the Rip1-Tag2 model for pancreatic neuroendocrine neoplasia, absence of either CTSB or CTSL delayed tumor growth and impaired tumor invasion [14]. The regulatory role of cysteine cathepsins in tissue proteome composition and protein degradation has also been studied in this model by quantitative proteomic methods [15].
In APCmin mice, CTSB deficiency led to attenuated formation of intestinal neoplasia [16]. On the contrary, crossing of APCmin with furless mice, which carry a mutant inactive CTSL, led to increased polyposis [17]. In the MMTV-PyMT breast cancer model, deletion of either CTSB delayed primary tumor growth as well as lung metastasis formation [18]. In the same model, forced expression of transgene human CTSB [19,20] or human CTSL [21] increases the metastatic burden.
In summary, while most of the used models hint toward similar roles of both CTSB and CTSL in tumor progression, there are differences in the effects of these cathepsins in others. Studies of the proteases' cleavage motifs and substrates revealed distinct patterns [22]. Therefore, we aimed to analyze the effects on the metastasis proteome of both cathepsins in a relevant breast cancer mouse model. The MMTV-PyMT breast cancer mouse model is well suited to analyze metastatic processes, as it displays a high incidence of lung metastases [23]. In this study, we isolated lung metastases of transgenic MMTV-PyMT mice expressing either human CTSB (tgCTSB) or CTSL (tgCTSL) at high levels. We quantitatively analyzed the proteome composition by LC-MS/MS using stable isotope labeling. Our data suggest that distinct changes of the metastasis proteome biology accompany metastasis progression in tgCTSB versus tgCTSL mice. tgCTSB expression led to a concerted increase of proteins involved in cell adhesion and actin cytoskeleton remodeling while tgCTSL mainly influenced the translational machinery as well as secreted proteins.
Methods
Mice
Transgenic mice carrying the polyoma middle T antigen (PyMT+/0) in an FVB/N background, under control of the MMTV LTR promotor (FVB/N(MMTV-PyMT)-Tg634-Mul/J) [23], were crossed with mice either bearing the human transgene CTSB Tg(CTSB+/0) or CTSL (CTSL+/0), as described previously [19-21].
Maintenance of animal strains and work performed in this study was carried out in accordance with institutional guidelines and the German law for animal protection (Tierschutzgesetz) as published on May 18th 2006 with last amendment on July 28th 2014. Ethics approval registration number is G14/18 RP regional council Freiburg.
Dissection of lung metastases
MMTV-PyMT mice were sacrified at the age of 14 weeks. Mice were anesthetized using a solution of 1 % Ketamine and 1 % Xylazine solved in 0.9 % NaCl and perfunded with 0.9 % NaCl containing protease inhibitors (PMSF, E64). Mouse lungs were removed and shock-frozen on dry ice. Macrometastases were excised under a stereo microscope using small forceps and directly transferred on dry ice.
MS sample preparation, LC-MS/MS and data analysis
Intact metastases were lysed with 4 % SDS in PBS and boiled at 95 °C for 30 min, followed by ultrasonication. Cell debris was removed by centrifugation and proteins were precipitated by addition of 9 volumes of acetone and 1 volume of methanol. For each genotype, the proteomes of three independent biological replicates were measured by LC‑MS/MS. When necessary, precipitated samples of several mice were pooled prior to labeling, thus enabling a pre-fractionation step prior to LC‑MS/MS. Supplementary Table 1 gives an overview about the pooled samples. Between 3 and 10 metastases per mouse were used for LC-MS/MS sample pools. Due to differences in initial availability, tgCTSL metastasis lysates were pre-fractionated on a HPLC SCX column, while tgCTSB lysates were pre-fractionated using a STAGE‑TIP SCX protocol [24].
Trypsin digestion and differential dimethylation were essentially performed as described previously [25]. LC-MS/MS was performed as described previously using an Orbitrap XL mass spectrometer (Thermo Scientific) [26]. Peptide spectrum matching and relative protein quantitation were performed as described previously [25], with the following changes: the validated (Swiss-Prot) UniProt mouse proteome was downloaded on November, 17th, 2015. Sequences of human CTSB and CTSL were added manually. The GPM [27] contaminant database with additional common mycoplasma contaminants [28] were appended. The database was appended with an equal number of randomized sequences derived from the original mouse proteome entries. An FDR of < 1 % was used both at peptide and at protein ID level. Proteins with only one identified peptide were only accepted when measured in all three replicates of one genotype. The relative quantitation was performed on MS1 level using the XPRESS algorithm [29]. Protein fold change (FC) values were calculated as log2 (abundance tgCTS / abundance WT). The FC values were normalized to center at zero. Statistical significance was tested using the linear model for microarray data (limma) [30] as described previously [31]. Raw data and all relevant data generated during analysis, including the used databases have been deposited to the ProteomeXchange Consortium via the PRIDE partner repository [32] with the dataset identifier PXD005860.
Localization prediction and GO term enrichment
The subcellular localization of proteins was determined using ngLoc [33]. In order to identify clusters of co-regulated, functionally related proteins, we performed a gene ontology (GO) enrichment analysis, with a focus on the “cellular compartment” and “biological process” annotation [34]. We chose the TopGO algorithm to minimize GO term redundancy [35]. Only clusters with a p-value < 0.05 and including at least three significantly affected proteins were considered. Hierarchical clustering was performed using the Multi Experiment Viewer (version 4.9.0) software [36] with standard settings.
Peptide mapping
Mapping of identified peptides to full proteins was performed as previously published [31,37].
Results
Explorative proteomic profiling of lung metastasis
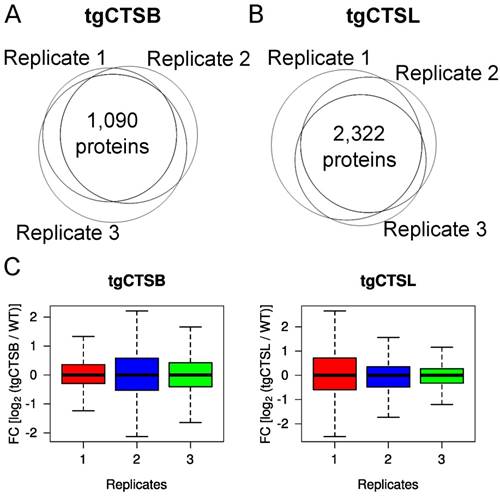
Lung metastases were macrodissected from 14-week old mice of the genotypes PyMT+/0; Ctsb+/+,Ctsl+/+ (short: WT), PyMT+/0;Tg(CTSB)+/0 (short: tgCtsb) [19] or PyMT+/0;Tg(CTSL)+/0 (short: tgCtsl) [21]. For quantitative comparison, the lung metastasis proteome of transgene mice was measured alongside with proteins isolated from WT lung metastases. In the three biological replicates of the tgCTSB dataset, we identified 1,332, 1,397 and 1,630 proteins, respectively. In the three biological replicates of the tgCTSL dataset, we identified 3,701, 3,001 and 2,808 proteins, respectively. In total, 1,090 proteins were identified in all three replicates of tgCTSB and 2,322 proteins were identified in all three replicates of tgCTSL (Fig. 1A & B). Incomplete overlap of identified proteins is an intrinsic feature of data-dependent LC‑MS/MS based proteomics. In our data, the shared protein identifications between any two datasets of a genotype ranged between 84 % and 95 %, indicating good reproducibility. Differences in initial protein availability required resorting to a miniaturized STAGE-TIP protocol for prefractionation of the tgCTSB samples, while tgCTSL samples were prefractionated using a HPLC column, yielding more fractions per sample. The higher ID numbers in the tgCTSL dataset demonstrate the superiority of HPLC prefractionation. However, 1,025 proteins (94 %) of the tgCTSB dataset were equally identified in the tgCTSL dataset (Supplementary Fig. 1A), thus enabling comparison of both datasets.
LC-MS/MS identifications and quantifications. We analyzed three independent biological replicates of lung metastases expressing tgCTSB compared to WT metastases by LC-MS/MS. We identified 1,332 proteins in replicate 1, 1,397 proteins in replicate 2 and 1,630 proteins in replicate 3. 1,090 proteins were identified in all three replicates. A) We analyzed three independent biological replicates of lung metastases expressing tgCTSL compared to WT metastases by LC-MS/MS. We identified 3,701 proteins in replicate 1, 3,001 proteins in replicate 2 and 2,808 proteins in replicate 3. 2,322 proteins were identified in all three replicates. B) Identified proteins were quantified based on the MS1 peptide mass traces. The relative quantity of each protein compared to the corresponding WT control sample is given by the fold change value (FC). The boxplots depict FC values of all quantified proteins in each replicate. Outliers are not depicted.
Subcellular localization of the identified proteins was similar for both analyzed genotypes, independently of the prefractionation protocol (Supplementary Fig. 1B). The identified proteins stem mainly from intracellular compartments (cytoplasma, nucleus and mitochondria), and to a lesser extent from plasma membrane (9 %) and the extracellular compartment (5 to 6 %).
tgCTSB and tgCTSL have distinct impacts on the metastasis proteome
Dimethyl-labelling enabled the relative quantitation of the metastasis proteomes of tgCTSB and tgCTSL mice compared to their respective controls. Relative protein expressions were normalized and calculated as fold change values (log2 of ratio transgene over control). In all six individual proteome comparisons, substantial proteome alterations are noticeable, as indicated by the individual box-and-whisker plots (Fig. 1C).
To gain a global overview on expression differences in all six replicates, we performed a hierarchical clustering (Fig. 2A) of the protein expression for those approx. 1,000 proteins, which were identified and quantified in all six samples. All replicates of each genotype fall into separate clusters, strongly arguing for distinct metastasis proteome changes in tgCTSB versus tgCTSL mice.
Statistical analysis of changes in protein abundance. A) Hierarchical clustering of changes in protein abundance. The two main clusters are determined by the genotype of the measured metastases (tgCTSB and tgCTSL). B) Mean FC values for each protein were calculated based on the three biological replicates of the respective genotype. p-values for each protein were calculated based on the limma algorithm. Changes in protein abundance were considered to be statistically significant, if the corresponding p-value was smaller than 0.05. The volcano plots depict the p-value and the mean FC-value of each protein that was quantified in all three replicates of a genotype. In the case of human tgCTSB and tgCTSL, pseudo-FC values are depicted (*). Proteins that are expressed significantly less compared to the WT control are depicted in blue, proteins that are expressed significantly higher compared to the WT control are depicted in red.
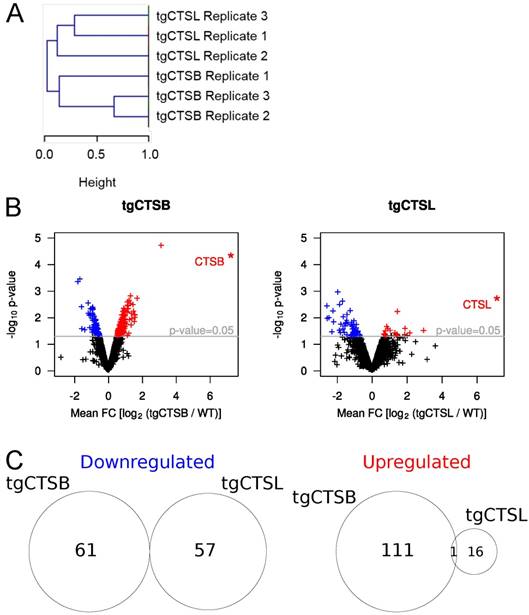
To determine differentially regulated proteins, we performed a linear model for microarrays (limma) fitting, which has been previously used for quantitative proteomic data [13,31]. The corresponding volcano plots are depicted in Fig. 2B. All proteins with a limma modified p-value of p < 0.05 were considered to be significantly changed. In the tgCTSL dataset, these criteria highlighted 16 upregulated and 57 downregulated proteins (Supplementary Table 2). In spite of lower ID numbers in the tgCTSB dataset, more proteins were consistently regulated, with 111 upregulated and 61 downregulated proteins (Supplementary Table 3). The overlap between significantly altered proteins in both genotypes is minimal, only one protein, the extracellular matrix (ECM) component nephronectin (NPNT), is equally upregulated in response to either tgCTSB or tgCTSL expression (Fig. 2C). The near-complete lack of commonly affected proteins further underlines the presence of distinct proteome changes in tgCTSB and tgCTSL mice. An overview about the top 10 most significant protein alterations of each dataset is given in Table 1.
Significantly enriched / depleted proteins
| Proteins downregulated upon tgCTSL expression | UniProt | FC1 | FC2 | FC3 | Mean | p-value | CI 95% L | CI 95% R |
| 40S ribosomal protein S24 | P62849 | -1.85 | -2.36 | -1.65 | -1.95 | 0.0011 | -2.69 | -1.21 |
| 40S ribosomal protein S23 | P62267 | -2.10 | -1.26 | -1.68 | -1.68 | 0.0025 | -2.44 | -0.92 |
| Beta-2-microglobulin | P01887 | -2.53 | -1.27 | -1.72 | -1.84 | 0.0034 | -2.73 | -0.95 |
| 40S ribosomal protein S30 | P62862 | -1.89 | -3.89 | -1.93 | -2.57 | 0.0038 | -3.85 | -1.29 |
| 60S ribosomal protein L26 | P61255 | -1.44 | -1.27 | -1.00 | -1.24 | 0.0057 | -1.92 | -0.56 |
| Cytosolic acyl coenzyme A thioester hydrolase | Q91V12 | -1.66 | -1.53 | -3.47 | -2.22 | 0.0059 | -3.45 | -0.99 |
| Protein S100-A9 | P31725 | -1.73 | -0.76 | -1.76 | -1.42 | 0.0081 | -2.27 | -0.57 |
| 60S ribosomal protein L34 | Q9D1R9 | -1.93 | -2.28 | -0.70 | -1.63 | 0.0097 | -2.66 | -0.61 |
| 60S ribosomal protein L32 | P62911 | -2.30 | -4.01 | -1.05 | -2.45 | 0.0105 | -4.02 | -0.88 |
| 60S ribosomal protein L29 | P47915 | -2.15 | -4.30 | -1.20 | -2.55 | 0.0112 | -4.21 | -0.89 |
| Bystin | O54825 | -1.17 | -2.30 | -0.84 | -1.44 | 0.0134 | -2.42 | -0.46 |
| Proteins upregulated upon tgCTSL expression | UniProt | FC1 | FC2 | FC3 | Mean | p-value | CI 95% L | CI 95% R |
| Cathepsin L1 | P07711 | 8.51* | 9.34* | 3.62* | 7.15* | 0.0019* | 4.10* | 10.21* |
| Autophagy protein 5 | Q99J83 | 1.93 | 1.56 | 0.90 | 1.46 | 0.0062 | 0.64 | 2.29 |
| Glutamate-rich WD repeat-containing protein 1 | Q810D6 | 1.07 | 0.70 | 0.79 | 0.85 | 0.0227 | 0.18 | 1.53 |
| Prosaposin | Q61207 | 3.35 | 1.93 | 0.40 | 1.90 | 0.0267 | 0.33 | 3.46 |
| Protein disulfide-isomerase | P09103 | 1.32 | 0.47 | 0.98 | 0.92 | 0.0275 | 0.15 | 1.69 |
| REST corepressor 1 | Q8CFE3 | 1.11 | 1.70 | 0.35 | 1.05 | 0.0319 | 0.14 | 1.97 |
| Granulins | P28798 | 5.85 | 2.22 | 0.83 | 2.97 | 0.0322 | 0.38 | 5.55 |
| RWD domain-containing protein 1 | Q9CQK7 | 0.98 | 0.81 | 0.53 | 0.78 | 0.0334 | 0.09 | 1.46 |
| Nephronectin | Q91V88 | 1.98 | 1.93 | 0.07 | 1.33 | 0.0398 | 0.09 | 2.56 |
| NudC domain-containing protein 3 | Q8R1N4 | 4.08 | 2.32 | 0.11 | 2.17 | 0.0401 | 0.15 | 4.20 |
| Proteins upregulated upon tgCTSB expression | UniProt | FC1 | FC2 | FC3 | Mean | p-value | CI 95% L | CI 95% R |
| Squalene synthase | P53798 | 2.65 | 3.14 | 3.59 | 3.13 | 0.0000 | 2.49 | 3.76 |
| Cathepsin B | P07858 | 5.78* | 6.46* | 9.50* | 7.25* | 0.0000* | 5.55* | 8.95* |
| EH domain-containing protein 1 | Q9WVK4 | 0.88 | 1.60 | 1.48 | 1.32 | 0.0016 | 0.73 | 1.91 |
| A-kinase anchor protein 5 | D3YVF0 | 0.83 | 2.21 | 2.09 | 1.71 | 0.0020 | 0.91 | 2.51 |
| Histone H1.1 | P43275 | 1.04 | 1.70 | 0.97 | 1.24 | 0.0024 | 0.64 | 1.84 |
| Tight junction protein ZO-1 | P39447 | 0.93 | 1.51 | 0.97 | 1.13 | 0.0027 | 0.57 | 1.70 |
| Rho GDP-dissociation inhibitor 2 | Q61599 | 1.92 | 0.82 | 1.23 | 1.32 | 0.0031 | 0.64 | 2.00 |
| Histone H2A.Z | P0C0S6 | 1.35 | 2.21 | 0.82 | 1.46 | 0.0034 | 0.70 | 2.22 |
| Tropomodulin-3 | Q9JHJ0 | 1.58 | 1.17 | 0.72 | 1.16 | 0.0036 | 0.55 | 1.77 |
| Serum deprivation-response protein | Q63918 | 1.11 | 0.73 | 1.59 | 1.15 | 0.0038 | 0.53 | 1.76 |
| Proteins downregulated upon tgCTSB expression | UniProt | FC1 | FC2 | FC3 | Mean | p-value | CI 95% L | CI 95% R |
| Apolipoprotein A-II | P09813 | -1.67 | -2.00 | -1.34 | -1.67 | 0.0004 | -2.24 | -1.10 |
| Cathepsin Z | Q9WUU7 | -1.24 | -2.07 | -2.06 | -1.79 | 0.0005 | -2.42 | -1.15 |
| Alpha-2-macroglobulin | Q61838 | -1.44 | -1.40 | -0.71 | -1.18 | 0.0030 | -1.78 | -0.58 |
| Apolipoprotein A-I | Q00623 | -0.97 | -2.55 | -1.21 | -1.58 | 0.0041 | -2.43 | -0.72 |
| Carboxylesterase 1C | P23953 | -0.97 | -0.86 | -0.92 | -0.92 | 0.0043 | -1.42 | -0.42 |
| Acid ceramidase | Q9WV54 | -0.72 | -1.12 | -1.00 | -0.94 | 0.0047 | -1.47 | -0.42 |
| Apolipoprotein A-IV | P06728 | -0.77 | -1.48 | -0.89 | -1.04 | 0.0049 | -1.63 | -0.46 |
| Protein FAM49B | Q921M7 | -0.91 | -0.97 | -0.80 | -0.89 | 0.0050 | -1.40 | -0.39 |
| Peptidyl-prolyl cis-trans isomerase FKBP8 | O35465 | -0.72 | -0.91 | -1.16 | -0.93 | 0.0053 | -1.46 | -0.40 |
| D-3-phosphoglycerate dehydrogenase | Q61753 | -0.74 | -0.74 | -1.31 | -0.93 | 0.0070 | -1.50 | -0.36 |
As expected, we observe expression of human CTSB and CTSL in samples stemming from transgene mice. The measured FC values have to be understood as “pseudo FC values”, because the human transgene is not present in WT mice. Nonetheless, background traces in the WT samples are quantified by the used algorithm and can be used to calculate relative expression levels for those proteins. To enable visualization of the human transgenes alongside with the murine proteins, those relative values are kept, but do not represent the true level of expression (compare Tholen et al., 2013).
Impact on lysosomal murine cathepsins
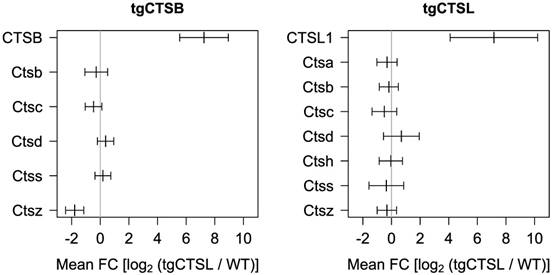
Earlier proteome studies highlighted that loss or gain of cathepsin function often has a strong impact on further lysosomal proteases. An example is the enrichment of cathepsin D in the skin of mice deficient for cathepsin L [25]. To systematically analyze this relation in the present study we plotted the expression of all identified lysosomal murine cathepsins (Fig. 3). Five murine lysosomal cathepsins (B, C, D, S, Z) were identified in all tgCTSB datasets. Only cathepsin Z (Ctsz) shows a significant downregulation. Seven murine lysosomal cathepsins were identified in the tgCTSL datasets (A, B, C, D, H, S, Z) and none of them displays significant regulation.
Impact on endogenous lysosomal cathepsin levels. The plot shows expression of the transgene human cathepsin and changes in endogenous expression of murine lysosomal cathepsins. Mean expression and 95 % confidence interval as calculated by the limma algorithm are depicted. For the human transgenes, pseudo-FC values are depicted.
Localization and function of influenced proteins
For a more specific view of protein localization and function, we analyzed the enrichment of “cellular compartment” and “biological process” gene ontology (GO) terms. In the tgCTSB dataset, we found an enrichment of extracellular and nucleoplasm proteins in the downregulated proteins. DNA-binding, cellular junction and stress fiber proteins were enriched in the upregulated proteins (Fig. 4A). In the tgCTSL dataset, ribosomal, nucleolar and secretory granule proteins are enriched in the downregulated proteins. There was no significant enrichment in the upregulated proteins (Fig. 4A).
GO term enrichment analysis. A) The tables show GO terms for cellular compartments that where enriched in the up- or downregulated proteins of the tgCTSB or tgCTSL dataset. All identified proteins of the respective experiments were used as a background. B) The tables show GO terms for biological processes that where enriched in the up- or downregulated proteins of the tgCTSB or tgCTSL dataset. All identified proteins of the respective experiments were used as a background.
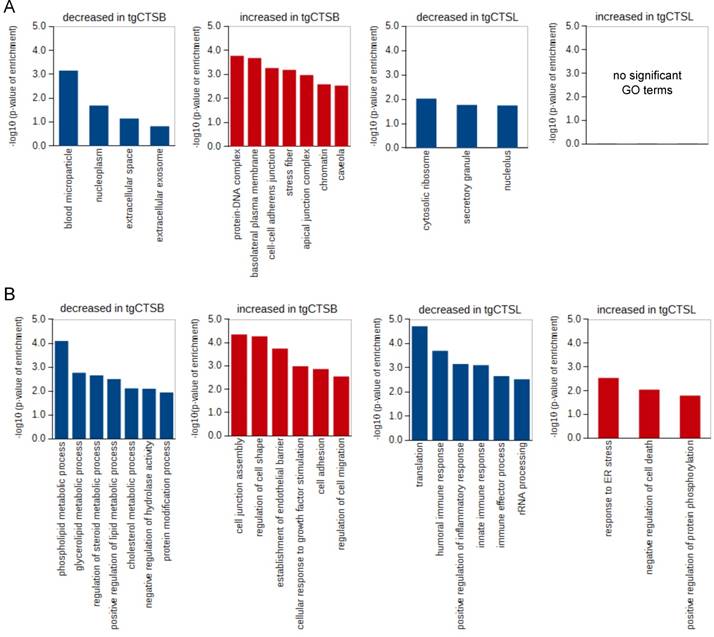
Biological processes that were enriched in the downregulated proteins of the tgCTSB dataset were mostly linked to lipid or cholesterol metabolism (Fig. 4B). The terms “cell adhesion”, as well as “regulation of cell shape” and “cell motility” were enriched in the upregulated proteins. In the tgCTSL dataset, the downregulated proteins showed enrichment in translation and several GO terms linked to inflammatory response. The upregulated proteins showed enrichment in the terms “response to ER stress” and “negative regulation of cell death” (Fig. 4B). We conclude that overexpression of either tgCTSB and tgCTSL leads to changes in mostly distinct cellular compartments and different biological processes of the metastatic cell and its environment.
Modulation of the cellular junction proteome in metastases expressing tgCTSB
In the tgCTSB dataset, we identified an enrichment of cell adhesion and cell junction proteins. A set of 45 proteins was annotated to at least one of those GO terms, making up for 26 % of the influenced proteins. Interestingly, 41 of these proteins were upregulated upon tgCTSB expression (Supplementary Table 4). Cellular adhesion is mediated by transmembrane adhesion proteins, which link the cell either to neighboring cells or the extracellular matrix (ECM). We identified several transmembrane adhesion proteins, both binding to ECM (ITB1, BCAM), as well as proteins establishing cell-cell contacts (PECAM-1, ICAM-1, ECAM). Accordingly, we also identified ECM proteins that bind to integrins (PSTN, Laminins, NPNT, MSN). On the intracellular side of the cell membrane, adhesion proteins are linked to actin or intermediate filaments of the cytoskeleton by intracellular anchor proteins. We identified three groups of anchor proteins. Firstly, we identified the proteins vinculin, vinexin, zyxin and talin-1, which link integrins to the actin cytoskeleton. Secondly, we identified catenins (CTNN-A, CTNN-D), which interact with cadherins in cell-cell contacts. Thirdly, we identified the tight junction proteins ZO-1 and ZO-2. Lastly, we identified a large group of proteins interacting with the actin cytoskeleton (ARPC2, AKAP 5/12, septin 7/11, spectrin a/b, MARCKSL1) and several myosin proteins. All mentioned proteins were significantly upregulated in the tgCTSB dataset. For a better overview, we mapped interactions between some of the described proteins to KEGG pathways (Supplementary Fig. 2) and grouped the proteins according to their function (Supplementary Table 4).
Modulation of secreted proteins in metastases expressing tgCTSL
In response to CTSL overexpression we observed downregulation of several ribosomal proteins. Twenty different proteins of the 60S subunit and four different proteins of the 40S subunit were consistently reduced in abundance. The changes were most prominent in dataset 1 and 2. Indeed, analyzing all 76 identified ribosomal proteins shows a significant overall reduction of ribosomal protein expression in those datasets, while in the third dataset there is no general trend for ribosomal protein suppression (Supplementary Fig. 3).
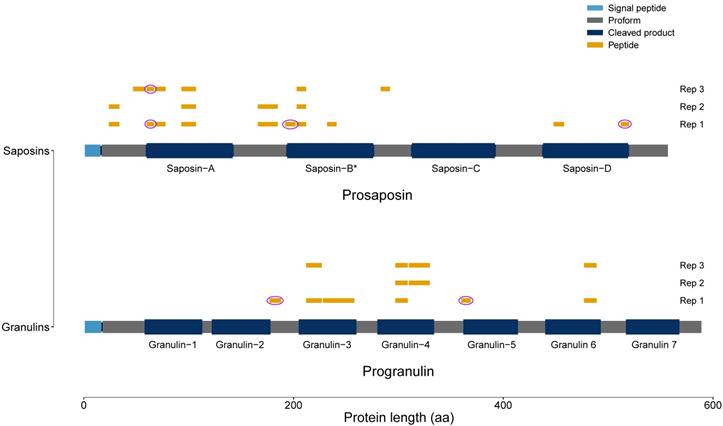
Two of the proteins with the highest upregulation in the tgCTSL datasets were progranulin (PGRN) and prosaposin (PSAP). Both proteins are located in secretory granules and are synthesized as proforms which are processed to smaller peptides, called granulins and saposins, respectively. To analyze if the proteins in our dataset had undergone processing into peptides, we performed a peptide mapping procedure (Fig. 5). As we identified peptides that spanned granulin and saposin peptide borders, we conclude that at least part of the identified peptides stem from the full-length protein proforms.
Peptide Mapping of PGRN and PSAP. All identified peptides of the tgCTSL dataset were mapped to the full-length proteins prosaposin and progranulin. Signal peptides are depicted in light blue, processed saposins / granulins in dark blue. Areas of the proprotein that do not give rise to saposins / granulins are depicted in grey. Identified peptides are depicted in yellow, pink circles mark peptides spanning borders of granulins / saposins. (* Two different saposins are generated: saposin-B and saposin-B-val.)
Discussion
Cathepsin proteases facilitate cancer progression through a variety of mechanisms. Suppression of cathepsin B or L hampers proliferation, migration and invasion of human tumor cells and may also have an effect on chemotherapeutic resistance. One of the first mechanisms to be described in vivo was the degradation of extracellular matrix by secreted cathepsins which enables tumor cells to breach the basal membrane and invade into the surrounding tissue [38]. In the RIP1-Tag2 model, deletion of Ctsb or Ctsl reduced neo-angiogenesis in the primary tumors [14]. In accordance, expression of human CTSB in the MMTV-PyMT model increased neo-angiogenesis [19]. Combinatorial treatment of MMTV-PyMT mice with Paclitaxel and the pan-cathepsin inhibitor JPM-OEt showed that high levels of cathepsins secreted by tumor-infiltrating macrophages induce resistance to Paclitaxel-induced cell death [39]. Contrarily, cathepsins leaking from lysosomes into cell plasma were also reported to facilitate apoptosis of tumor cells [40], a mechanism that may form an Achilles heel of many cancers [41].
Distinct impact on the metastasis proteome by tgCTSB versus tgCTSL
In our datasets, the detected proteome changes in tgCTSB versus tgCTSL metastases showed marked differences. In spite of the high overlap of protein identification in the datasets, only a single protein, the integrin binding ECM protein NPNT, was significantly altered in both genotypes. Hierarchical clustering and GO term enrichment analysis further showed that both cathepsins regulate distinct pathways in spite of inducing a similar metastatic phenotype. This finding is in line with previous comparative studies on CTSB and CTSL. We previously published a proteomic and degradomic comparison of those cathepsins in murine skin, which also showed differences between both cathepsins [25], e.g. in angiogenic mechanisms. Recently, a massive quantitative degradomic study was published comparing the impact of the cathepsins B, H, L, S and Z in the pancreatic islet cancer model Rip1-Tag2 [15]. In this study, the authors found that cathepsins show distinct effects and no family-wide substrate compensation. Another important finding from this study was that while degradative functions make a large proportion of cathepsin effects, there are also some stable cathepsin cleavage products. The latter mostly belong to the extracellular environment, where they may exert regulatory functions in cancer. This underlines our findings of many altered extracellular proteins, both in the tgCTSB and in the tgCTSL dataset.
Interplay of transgene with endogene cathepsins
Cathepsins often display redundancy and compensatory effects [42,43]. Therefore, we checked for the expression of murine cathepsins upon transgene expression. The only potentially compensatory mechanism was in the tgCTSB dataset, where we observed downregulation of murine Ctsz upon tgCTSB expression. Ctsz and Ctsb are mechanistically closely linked by their carboxypeptidase activity, which is unique among the cathepsin family [44,45]. In the PyMT breast cancer mouse model, they show synergistic influence on cancer progression and metastasis formation [46]. Our data thus indicate compensatory downregulation of Ctsz on protein level. In an earlier study, Ctsz mRNA level was unchanged upon tgCTSB expression in PyMT tumor cells [20] which indicates a post-transcriptional mechanism. Also the observed upregulation of neutrophilic granule protein (NGP), an endogeneous peptide inhibitor of Ctsb [47], may represent a compensatory mechanism.
Specific effects of CTSB
Our data on the influence of CTSB on cellular adhesion is in accordance with an earlier study on transcript level [20], where the GO term “cell adhesion” was equally enriched in tgCTSB expressing PyMT tumor cells. Here, a coculture of PyMT tumor cells with or without expression of tgCTSB and macrophages were analyzed using microarrays. The same study showed that expression of tgCTSB does not alter single cell motility, but rather multicellular streaming of PyMT tumor cells in a 3D cell culture model [20]. In this process, tumor cells invading into foreign tissue keep contact to neighboring tumor cells [48], which may also explain our observation of increased ITB1 expression.
Apart from cell adhesion, we noticed a repression of several proteins linked to the proteasome. A similar mechanism of cathepsin and proteasome cross-regulation has been observed in an earlier study [25].
Another interesting finding in the tgCTSB dataset was the downregulation of three eIF3 subunits (E, F and K). eIF3 is important for the translation initiation of uncapped mRNA [49], which is a typical mechanism in low-oxygen cancerous cells. Interestingly, downregulation of the subunits E and F was reported to induce malignant transformation in mammary cancer (reviewed in [50]).
Specific effects of CTSL
In the tgCTSL dataset, we detected downregulation of many ribosomal proteins, which was most noticeable in two of the three replicates. We detected a significant general trend toward reduced expression of ribosomal proteins in these datasets. However, the third dataset displayed no sign of general ribosomal protein repression. We conclude that the observed effect might be non-specific for tgCTSL but rather based on a coincidence and due to the small number of replicates.
In contrast, a consistent effect in all three replicates was the upregulation of the two secreted proteins progranulin (PGRN) and prosaposin (PSAP). Similar to tgCTSL, both proteins are synthesized as proforms and routed to the lysosomal lumen, but are more abundant in secretory granules and secreted into the extracellular environment. Progranulin, also known as proepithelin or PC cell-derived growth factor (PCDGF), was reported to be highly expressed in breast cancer and to promote tumor malignancy [51] by stimulating proliferation, migration and tamoxifen resistance [52,53]. It was shown to induce MAPK/ERK signaling in colorectal [54] and bladder cancer [55]. PSAP was shown to be secreted by breast cancer cell lines [56]. High expression of prosaposin was proposed as a marker for shorter progression-free survival in tamoxifen treatment of breast cancers [57]. Like progranulin, also prosaposin induces MAPK signaling [58]. Interestingly, progranulin and prosaposin were identified as the two most abundant lysosomal proteins in a recent absolute quantitation study [59].
Conclusion
Quantitative proteomic analysis of isolated metastases revealed differences in transgene PyMT mice expressing either human CTSB or human CTSL. Though the metastatic phenotype of the transgene PyMT mice is comparable, the proteome changes that are evoked by each cathepsin are unique for each of the cathepsins. Our datasets may provide new clues how CTSB and CTSL influence metastasis formation.
Supplementary Material
Supplementary figures.
Supplementary table 1.
Supplementary table 2.
Supplementary table 3.
Supplementary table 4.
Acknowledgements
OS acknowledges support by Deutsche Forschungsgemeinschaft (SCHI 871/5, SCHI 871/8, SCHI 871/9, SCHI 871/11, INST 39/900-1 and SFB850-Project B8), and the Excellence Initiative of the German Federal and State Governments (EXC 294, BIOSS). TR acknowledges support by Deutsche Forschungsgemeinschaft (RE1587/6-2, and SFB850-Project B7), and the Excellence Initiative of the German Federal and State Governments (EXC 294, BIOSS). This study was supported in part by the Excellence Initiative of the German Research Foundation (GSC-4, Spemann Graduate School).
Competing Interests
The authors have declared that no competing interest exists.
References
1. Berquin IM, Sloane BF. Cathepsin B expression in human tumors. Adv Exp Med Biol. 1996;389:281-94
2. Foekens J a, Kos J, Peters H a, Krasovec M, Look MP, Cimerman N, Meijer-van Gelder ME, Henzen-Logmans SC, van Putten WL, Klijn JG. Prognostic significance of cathepsins B and L in primary human breast cancer. J Clin Oncol. 1998;16:1013-1021
3. Gong F, Peng X, Luo C, Shen G, Zhao C, Zou L, Li L, Sang Y, Zhao Y, Zhao X. Cathepsin B as a potential prognostic and therapeutic marker for human lung squamous cell carcinoma. Mol Cancer. 2013;12:125
4. Niedergethmann M, Wostbrock B, Sturm JW, Willeke F, Post S, Hildenbrand R. Prognostic impact of cysteine proteases cathepsin B and cathepsin L in pancreatic adenocarcinoma. Pancreas. 2004;29:204-11
5. Zhang W, Wang S, Wang Q, Yang Z, Pan Z, Li L. Overexpression of cysteine cathepsin L is a marker of invasion and metastasis in ovarian cancer. Oncol Rep. 2014;31:1334-42
6. Reiser J, Adair B, Reinheckel T. Specialized roles for cysteine cathepsins in health and disease. J Clin Invest. 2010;120:3421-3431
7. Mai J, Finley RL, Waisman DM, Sloane BF. Human procathepsin B interacts with the annexin II tetramer on the surface of tumor cells. J Biol Chem. 2000;275:12806-12
8. Rozhin J, Wade RL, Honn K V, Sloane BF. Membrane-associated cathepsin L: a role in metastasis of melanomas. Biochem Biophys Res Commun. 1989;164:556-61
9. Sameni M, Moin K, Sloane BF. Imaging proteolysis by living human breast cancer cells. Neoplasia. 2000;2:496-504
10. Mason RW, Massey SD. Surface activation of pro-cathepsin L. Biochem Biophys Res Commun. 1992;189:1659-1666
11. Almeida PC, Nantes IL, Chagas JR, Rizzi CCA, Faljoni-Alario A, Carmona E, Julianoi L, Nader HB, Tersariol ILS. Cathepsin B activity regulation. Heparin-like glycosaminoglycans protect human cathepsin B from alkaline pH-induced inactivation. J Biol Chem. 2001;276:944-951
12. Ishidoh K, Kominami E. Procathepsin L degrades extracellular matrix proteins in the presence of glycosaminoglycans in vitro. Biochem Biophys Res Commun. 1995;217:624-31
13. Sigloch FC, Knopf JD, Weißer J, Gomez-Auli A, Biniossek ML, Petrera A, Schilling O. Proteomic analysis of silenced cathepsin B expression suggests non-proteolytic cathepsin B functionality. Biochim Biophys Acta. 2016;1863:2700-2709
14. Gocheva V, Zeng W, Ke D, Klimstra D, Reinheckel T, Peters C, Hanahan D, Joyce JA. Distinct roles for cysteine cathepsin genes in multistage tumorigenesis. Genes Dev. 2006;20:543-556
15. Prudova A, Gocheva V, Auf dem Keller U, Eckhard U, Olson OC, Akkari L, Butler GS, Fortelny N, Lange PF, Mark JC, Joyce JA, Overall CM. TAILS N-Terminomics and Proteomics Show Protein Degradation Dominates over Proteolytic Processing by Cathepsins in Pancreatic Tumors. Cell Rep. 2016;16:1762-1773
16. Gounaris E, Tung CH, Restaino C, Maehr R, Kohler R, Joyce JA, Ploegh HL, Plough HL, Barrett TA, Weissleder R, Khazaie K. Live imaging of cysteine-cathepsin activity reveals dynamics of focal inflammation, angiogenesis, and polyp growth. PLoS One. 2008;3:e2916
17. Boudreau F, Lussier CR, Mongrain S, Darsigny M, Drouin JL, Doyon G, Suh ER, Beaulieu J-F, Rivard N, Perreault N. Loss of cathepsin L activity promotes claudin-1 overexpression and intestinal neoplasia. FASEB J. 2007;21:3853-65
18. Vasiljeva O, Papazoglou A, Krüger A, Brodoefel H, Korovin M, Deussing J, Augustin N, Nielsen BS, Almholt K, Bogyo M, Peters C, Reinheckel T. Tumor cell-derived and macrophage-derived cathepsin B promotes progression and lung metastasis of mammary cancer. Cancer Res. 2006;66:5242-50
19. Sevenich L, Werner F, Gajda M, Schurigt U, Sieber C, Müller S, Follo M, Peters C, Reinheckel T. Transgenic expression of human cathepsin B promotes progression and metastasis of polyoma-middle-T-induced breast cancer in mice. Oncogene. 2011;30:54-64
20. Bengsch F, Buck A, Günther SC, Seiz JR, Tacke M, Pfeifer D, von Elverfeldt D, Sevenich L, Hillebrand LE, Kern U, Sameni M, Peters C, Sloane BF, Reinheckel T. Cell type-dependent pathogenic functions of overexpressed human cathepsin B in murine breast cancer progression. Oncogene. 2014;33:4474-84
21. Tholen M, Wolanski J, Stolze B, Chiabudini M, Gajda M, Bronsert P, Stickeler E, Rospert S, Reinheckel T. Stress-resistant Translation of Cathepsin L mRNA in Breast Cancer Progression. J Biol Chem. 2015;290:15758-69
22. Biniossek ML, Nägler DK, Becker-Pauly C, Schilling O. Proteomic identification of protease cleavage sites characterizes prime and non-prime specificity of cysteine cathepsins B, L, and S. J Proteome Res. 2011;10:5363-73
23. Guy CT, Cardiff RD, Muller WJ. Induction of mammary tumors by expression of polyomavirus middle T oncogene: a transgenic mouse model for metastatic disease. Mol Cell Biol. 1992;12:954-961
24. Rappsilber J, Ishihama Y, Mann M. Stop and go extraction tips for matrix-assisted laser desorption/ionization, nanoelectrospray, and LC/MS sample pretreatment in proteomics. Anal Chem. 2003;75:663-70
25. Tholen S, Biniossek ML, Gansz M, Gomez-Auli A, Bengsch F, Noel A, Kizhakkedathu JN, Boerries M, Busch H, Reinheckel T, Schilling O. Deletion of cysteine cathepsins B or L yields differential impacts on murine skin proteome and degradome. Mol Cell Proteomics. 2013;12:611-25
26. Tholen S, Biniossek ML, Gessler A-L, Müller S, Weisser J, Kizhakkedathu JN, Reinheckel T, Schilling O. Contribution of cathepsin L to secretome composition and cleavage pattern of mouse embryonic fibroblasts. Biol Chem. 2011;392:961-71
27. Craig R, Cortens JP, Beavis RC. Open source system for analyzing, validating, and storing protein identification data. J Proteome Res. 2004;3:1234-42
28. Bielow C, Mastrobuoni G, Kempa S. Proteomics Quality Control: Quality Control Software for MaxQuant Results. J Proteome Res. 2016;15:777-787
29. Han DK, Eng J, Zhou H, Aebersold R. Quantitative profiling of differentiation-induced microsomal proteins using isotope-coded affinity tags and mass spectrometry. Nat Biotechnol. 2001;19:946-51
30. Ritchie ME, Phipson B, Wu D, Hu Y, Law CW, Shi W, Smyth GK. Limma powers differential expression analyses for RNA-sequencing and microarray studies. Nucleic Acids Res. 2015;43:e47
31. Gomez-Auli A, Hillebrand LE, Biniossek ML, Peters C, Reinheckel T, Schilling O. Impact of cathepsin B on the interstitial fluid proteome of murine breast cancers. Biochimie. 2016;122:88-98
32. Vizcaíno JA, Csordas A, Del-Toro N, Dianes JA, Griss J, Lavidas I, Mayer G, Perez-Riverol Y, Reisinger F, Ternent T, Xu Q-W, Wang R, Hermjakob H. 2016 update of the PRIDE database and its related tools. Nucleic Acids Res. 2016;44:D447-56
33. King BR, Vural S, Pandey S, Barteau A, Guda C. ngLOC: software and web server for predicting protein subcellular localization in prokaryotes and eukaryotes. BMC Res Notes. 2012;5:351
34. Ashburner M, Ball CA, Blake JA, Botstein D, Butler H, Cherry JM, Davis AP, Dolinski K, Dwight SS, Eppig JT, Harris MA, Hill DP, Issel-Tarver L, Kasarskis A, Lewis S, Matese JC, Richardson JE, Ringwald M, Rubin GM, Sherlock G. Gene ontology: tool for the unification of biology. The Gene Ontology Consortium. Nat Genet. 2000;25:25-9
35. Alexa A, Rahnenführer J, Lengauer T. Improved scoring of functional groups from gene expression data by decorrelating GO graph structure. Bioinformatics. 2006;22:1600-7
36. Saeed AI, Sharov V, White J, Li J, Liang W, Bhagabati N, Braisted J, Klapa M, Currier T, Thiagarajan M, Sturn A, Snuffin M, Rezantsev A, Popov D, Ryltsov A, Kostukovich E, Borisovsky I, Liu Z, Vinsavich A, Trush V, Quackenbush J. TM4: a free, open-source system for microarray data management and analysis. Biotechniques. 2003;34:374-8
37. Videm P, Gunasekaran D, Schröder B, Mayer B, Biniossek ML, Schilling O. Automated peptide mapping and protein-topographical annotation of proteomics data. BMC Bioinformatics. 2014;15:207
38. Sloane BF, Rozhin J, Johnson K, Taylor H, Crissman JD, Honn K V. Cathepsin B: association with plasma membrane in metastatic tumors. Proc Natl Acad Sci U S A. 1986;83:2483-7
39. Shree T, Olson OC, Elie BT, Kester JC, Garfall AL, Simpson K, Bell-McGuinn KM, Zabor EC, Brogi E, Joyce JA. Macrophages and cathepsin proteases blunt chemotherapeutic response in breast cancer. Genes Dev. 2011;25:2465-79
40. Vasiljeva O, Turk B. Dual contrasting roles of cysteine cathepsins in cancer progression: apoptosis versus tumour invasion. Biochimie. 2008;90:380-6
41. Kallunki T, Olsen OD, Jäättelä M. Cancer-associated lysosomal changes: friends or foes? Oncogene. 2013;32:1995-2004
42. Mohamed MM, Sloane BF. Cysteine cathepsins: multifunctional enzymes in cancer. Nat Rev Cancer. 2006;6:764-75
43. Gocheva V, Joyce JA. Cysteine cathepsins and the cutting edge of cancer invasion. Cell Cycle. 2007;6:60-4
44. Klemencic I, Carmona AK, Cezari MH, Juliano MA, Juliano L, Guncar G, Turk D, Krizaj I, Turk V, Turk B. Biochemical characterization of human cathepsin X revealed that the enzyme is an exopeptidase, acting as carboxymonopeptidase or carboxydipeptidase. Eur J Biochem. 2000;267:5404-12
45. Nägler DK, Storer AC, Portaro FC, Carmona E, Juliano L, Ménard R. Major increase in endopeptidase activity of human cathepsin B upon removal of occluding loop contacts. Biochemistry. 1997;36:12608-15
46. Sevenich L, Schurigt U, Sachse K, Gajda M, Werner F, Müller S, Vasiljeva O, Schwinde A, Klemm N, Deussing J, Peters C, Reinheckel T. Synergistic antitumor effects of combined cathepsin B and cathepsin Z deficiencies on breast cancer progression and metastasis in mice. Proc Natl Acad Sci U S A. 2010;107:2497-502
47. Boutté AM, Friedman DB, Bogyo M, Min Y, Yang L, Lin PC. Identification of a myeloid-derived suppressor cell cystatin-like protein that inhibits metastasis. FASEB J. 2011;25:2626-37
48. Friedl P, Locker J, Sahai E, Segall JE. Classifying collective cancer cell invasion. Nat Cell Biol. 2012;14:777-783
49. Lacerda R, Menezes J, Romão L. More than just scanning: the importance of cap-independent mRNA translation initiation for cellular stress response and cancer. Cell Mol Life Sci. 2017;74:1659-1680
50. Hershey JWB. The role of eIF3 and its individual subunits in cancer. Biochim Biophys Acta. 2015;1849:792-800
51. Tse JC, Kalluri R. Waking up dormant tumors. Breast Cancer Res. 2011;13:310
52. Ong CHP, Bateman A. Progranulin (granulin-epithelin precursor, PC-cell derived growth factor, acrogranin) in proliferation and tumorigenesis. Histol Histopathol. 2003;18:1275-88
53. Tangkeangsirisin W, Hayashi J, Serrero G. PC cell-derived growth factor mediates tamoxifen resistance and promotes tumor growth of human breast cancer cells. Cancer Res. 2004;64:1737-43
54. Yang D, Wang L-L, Dong T-T, Shen Y-H, Guo X-S, Liu C-Y, Liu J, Zhang P, Li J, Sun Y-P. Progranulin promotes colorectal cancer proliferation and angiogenesis through TNFR2/Akt and ERK signaling pathways. Am J Cancer Res. 2015;5:3085-97
55. Monami G, Gonzalez EM, Hellman M, Gomella LG, Baffa R, Iozzo R V, Morrione A. Proepithelin promotes migration and invasion of 5637 bladder cancer cells through the activation of ERK1/2 and the formation of a paxillin/FAK/ERK complex. Cancer Res. 2006;66:7103-7110
56. Campana WM, O'Brien JS, Hiraiwa M, Patton S. Secretion of prosaposin, a multifunctional protein, by breast cancer cells. Biochim Biophys Acta. 1999;1427:392-400
57. Meijer D, Jansen MPHM, Look MP, Ruigrok-Ritstier K, van Staveren IL, Sieuwerts AM, van Agthoven T, Foekens JA, Dorssers LCJ, Berns EMJJ. TSC22D1 and PSAP predict clinical outcome of tamoxifen treatment in patients with recurrent breast cancer. Breast Cancer Res Treat. 2009;113:253-60
58. Wu Y, Sun L, Zou W, Xu J, Liu H, Wang W, Yun X, Gu J. Prosaposin, a regulator of estrogen receptor alpha, promotes breast cancer growth. Cancer Sci. 2012;103:1820-5
59. Markmann S, Krambeck S, Hughes CJ, Mirzaian M, Aerts JMFG, Saftig P, Schweizer M, Vissers JPC, Braulke T, Damme M. Quantitative Proteome Analysis of Mouse Liver Lysosomes Provides Evidence for Mannose 6-phosphate-independent Targeting Mechanisms of Acid Hydrolases in Mucolipidosis II. Mol Cell Proteomics. 2017;16:438-450
Author contact
![]() Corresponding author: Stefan Meier Strasse 17, D-79104 Freiburg, Germany, Tel: +49 761 203 9615, oliver.schillinguni-freiburg.de
Corresponding author: Stefan Meier Strasse 17, D-79104 Freiburg, Germany, Tel: +49 761 203 9615, oliver.schillinguni-freiburg.de