Impact Factor ISSN: 1837-9664

 Global reach, higher impact
J Cancer 2017; 8(19):4018-4026. doi:10.7150/jca.21226 This issue Cite
Research Paper
Overexpression of CKAP4 is Associated with Poor Prognosis in Clear Cell Renal Cell Carcinoma and Functions via Cyclin B Signaling
Chen-min Sun, Jiang Geng, Yang Yan, Xudong Yao ![]() , Min Liu
, Min Liu ![]()
Department of Urology, Shanghai Tenth People's Hospital, Tongji University, Shanghai, 200072, China.
Received 2017-5-28; Accepted 2017-9-29; Published 2017-10-23
Abstract
Aim: We aimed to study the role of CKAP4 in clear cell renal cell carcinoma (ccRCC), which is not reported previously.
Method: In silico exploration and validation using immunohistochemistry in ccRCC samples were used to identify the impact of CKAP4 expression on clinicopathological parameters. In vitro and in vivo studies were carried out to recapitulate the role of CKAP4 in ccRCC cell lines and animal models.
Results: Overexpression of CKAP4 occurred in 5% of ccRCC patients, who had significantly worsened prognosis. Increased CKAP4 expression was significantly associated with TNM staging and Fuhrman grade. Pathway analysis for genes coexpressed with CKAP4 in ccRCC unanimously revealed significant cell cycle progression at G2/M phase. Expressions of CCNB1 and CCNB2 were correlated with CKAP4 expression. Genetic upregulation of CKAP4 significantly increased proliferation, cell invasion and migration in ccRCC cell lines, and vice versa for CKAP4 silencing. CKAP4 silencing also significantly increased cell population at G2/M phase, while not influencing cell apoptosis. Silencing or upregulation of CKAP4 resulted in decreased or increased CCNB1/2 expressions, respectively. CCNB1/CDK1 inhibitor significantly inhibited colony formation ability and in vivo tumor growth of RCC cells with CKAP4 overexpression.
Conclusion: Upregulation of CKAP4 was associated with worsened characteristics of ccRCC. CKAP4 was related with CCNB signaling in ccRCC, which supported a role for CCNB/CDK inhibitor for ccRCC with such genotype.
Keywords: CKAP4, Renal cell carcinoma, VEGF, Prognosis
Introduction
Renal cell carcinoma (RCC) is the most common form of malignancy on kidney[1]. Clear cell type of RCC (ccRCC) is not only the predominant subtype but also the only one with definitive druggable underlying mutations. Angiogenic activation downstream of Von Hippel-Lindau (VHL) / Hypoxia-Inducible Factor (HIF) / vascular endothelial growth factor (VEGF) axis has been established as the fundamental genetic and genomic characteristic of ccRCC and most targeted agents are designed to intervene this pathway[2, 3]. Although angiogenesis is prevailing in ccRCC, the VHL/HIF/VEGF axis plays a greater role in characterizing the tumor, rather than being associated with prognosis per se[4]. Genetic alterations at a much lower frequency that are usually overlooked could in fact impact drastically on prognosis and patients with such genotype, despite receiving a variety of anti-VEGF regimes, still succumb soon after diagnosis. For instance, focal loss of chromosome 9p occurs in approximately 4% of ccRCC cases but is associated with a very poor outcome[5]. Those minorities represent a distinct subgroup of ccRCC patients who are in desperate need of individualized and effective treatments.
Therefore, in the current study, we used a knowledge-based search for genes altered at a lower frequency yet contributing substantially to prognosis in a large cohort of ccRCC cases in The Cancer Genome Atlas (TCGA) dataset. We aimed at overexpression of Cytoskeleton-associated protein 4 (CKAP4), which occurs at ~5% of ccRCC patients and whose role has yet been revealed in ccRCC previously. As a type II transmembrane protein that can be reversely palmitoylated, CKAP4 was initially found to localize to endoplasmic reticulum binding to microtubes. Physiological function of CKAP4 serves as a receptor to various ligands, mainly surfactant protein A, tissue plasminogen activator and anti-proliferating factor, and it is thus localized to a set of tissues requiring the substance, for instance pneumocytes, bladder epithelial cells, and vascular smooth muscle cells[6]. There has been a dearth of studies revealing the role of CKAP4 in malignancy and one recent study has shown that CKAP4 is identified as a receptor for Dickkopf in pancreatic and lung cancer cells in a WNT independent manner[7].
In the current study, we investigated expression of CKAP in renal cell carcinoma via in silico and in tissue immunohistochemical (IHC) analysis. The findings were validated in a series of in vitro and in vivo studies. Our findings provided insights for development of targeted treatment for CKAP4 positive ccRCC patients.
Materials and Methods
In silico analysis
The clear cell kidney cancer subset (KIRC) of TCGA was reproduced to study expression of CKAP4 in ccRCC using the cBioPortal platform[8-10], which contained RNA seq data fo 538 ccRCC samples. Expression status of CKAP4 was shown using the OncoPrint function of cBioPortal online. List of genes coexpressed with CKAP4 detected using RNA seq was generated using the Coexpression function of cBioPortal online, and the Pearson test was opted for correlation evaluation. Genes passing the ±40 of coefficient R were input to the KOBAS 3.0 platform for functional annotation[11, 12]. Only KEGG Pathway and Reactome datasets were allowed for annotation.
Expression of GNB1 in normal and cancerous kidney tissue was evaluated semi-quantitatively using the Human Protein Atlas platform[13-16]. The captured normal kidney tissue was via the following link (http://www.proteinatlas.org/ENSG00000136026-CKAP4/tissue/kidney#img). Cropped representative images for RCC can be accessed via http://www.proteinatlas.org/ENSG00000136026-CKAP4/cancer/tissue/renal+cancer#img for CKAP4, via http://www.proteinatlas.org/ENSG00000134057-CCNB1/cancer/tissue/renal+cancer#img for CCNB1, and via http://www.proteinatlas.org/ENSG00000157456-CCNB2/cancer/tissue/renal+cancer#img for CCNB2. The extensity was graded as follows: 0 for 0-5% of tumor cells stained, 1 for 6-20% of cells stained, 2 for 21-50% of cells stained and 3 for > 50% of cells stained. Intensity of staining was graded as follows: 1 for light yellow, 2 for dark yellow and 3 for brown. Sum of extensity and intensity represents the final quantification of each sample: 0 for negative (1-2), 1 for mild (3), 2 for moderate (4), and 3 for strong (5-6).
Patients and samples
In the validation stage, 124 ccRCC samples from patients undergoing partial nephrectomy, radical nephrectomy, or cytoreductive nephrectomy at our institute were included. The clinicopathological parameters were collected and reviewed retrospectively. The TNM system were used for staging and Fuhrman four-tier system was used for nuclear grading. The study was approved by local institutional review board.
Immunohistochemistry
A standard hematoxylin and eosin staining procedure was performed in all samples[17-20]. Formalin-fixed, paraffin-embedded tissue samples were sliced consecutively at 4 μm. tissues were mounted on polylysine-coated glass slides. Endogenous peroxidase of deparaffinized sections was blocked through incubation with 3% hydro- gen peroxide for 15 min. The samples were then deparaffinized, with gradient rehydration in ethanol. The following antibodies were used for IHC staining: CKAP4 (Abcam), Cyclin B1 (Abcam), and Cyclin B2 (Abcam). Specific dilution of each enzyme was per manufacturer's protocol. We used DAB (diaminobenzidine tetrahydrochloride) solution for color developing and all slides were finalized by counterstain with Mayer's hematoxylin blue. Positive and negative controls for all enzyme labelers were referenced using upon the Human Protein Atlas platform. Quantification was performed in the method aforementioned.
Cell line and viral transduction
The 786-O and RCC4 renal cell carcinoma cell lines were originally obtained from ATCC cell bank. Cells were cultured in complete DMEM media supplemented with 10% of fetal bovine serum. Lentiviral overexpression of CKAP4 was constructed using the cDNA clone of CKAP4 purchased from OriGene (Rockville, MD). A standard recombination protocol was followed for the generation of a CKAP4-bearing lentivirus, which was subsequently produced in abundance using the 293A cells. A 100 MOI of efficiency was used in all assays. For shRNA construction, the target sequence was referenced from TRC (http://portals.broadinstitute.org/gpp/public/gene/details?geneId=10970), as follows: TRCN0000308168 as shRNA#1, and TRCN0000296261 as shRNA#2. Vectors with puromycin resistance were used and were transected in to cells using the Fugene system. Stably transfected cells were selected using puromycin at 1:5000 of dilution.
Quantitative PCR and western blotting
For quantitative PCR, a standard protocol was followed. Total RNA was extracted with Trizol and was converted to cDNA. Primers for CKAP4 was 5'- CCG TGG AAT CAC TCC AGA AGG -3' as forward, and 5'-AGT CCT GAG CAT TTT CAA GTC C-3' as reverse. GAPDH was used as internal reference. cDNA was subject to the ABI 7500 for quantitative PCR procedure and the program was per manufacturer's instruction of SYBR Green system. The expression of CKAP4 was calculated according to internal references and were expressed as folds over the control group.
For western blotting, total protein of cell lysates was extracted and equal protein amount of 25 μg was loaded onto 10% sodium dodecyl sulphate polyacrylamide gel. Gels were subsequently transferred to nitrocellulose membrane. The membranes were blocked with 5% non-fat milk. Primary anti- human CKAP4 (Abcam), Cyclin B1 (Abcam), Cyclin B2 (Abcam), CDK1 (Abcam), and Actin (Abcam) antibodies were then added at the dose recommended by the manufacturers and membranes were kept at 4°C overnight. Procedure was finalized by enhanced chemiluminescence.
Proliferation assay
Proliferation was studies using the crystal violet assay. Cells were cultured in the 96-well plates and depleted of media at different time points (24 h, 48 h, and 72 h). Cells were then dyed using crystal violet and subsequently dissolved using methanol. Plates were read on a plate reader with absorbance at 540 nm of wavelength.
Transwell and colony formation assays
Transwell assays were performed to profile cell invasion and migration. Briefly, the inserts were coated with or without Matrigel for invasion and migration assays, respectively. Cells were cultured in media without serum and were seeded in the inserts, which were then placed in the lower chamber filled with complete media. After 72 h, inserts were cleared for inner contents and the outer membranes were dyed with crystal violet and counted for cell number microscopically.
The colony formation was performed to profile anchorage-independent growth of cells. Briefly, 6-well plates were paved with 3 layers of media. The lowest were mixture of 0.6% agar and complete media. On top of that were mixture of 0.4% agar and complete media, in which ~1000 cells were seeded. The uppermost layer was 1 mL of compete media with 100 μm of RO-3306, replaced every 3 days. Two weeks later, the plate was dyed using crystal violet and tubers were counted microscopically.
Animal model
Twenty nude mice at 6 weeks of age were injected with 107 of 786-O cells at dorsal axillary region subcutaneously. Tumors were monitored for calibration every 3 days. On day 5 after implantation, mice were treated with RO-3306, via either intravenous bolus or intravenous infusion at appropriate doses and durations. Mice were euthanized on week 5.
Statistical analysis
The SPSS 22.0 and Prism Graphpad 6.0 software were used for statistical analysis. The Mann-Whitney U test was used to compare expressional differences between 2 groups. Expressional differences among > 2 groups were analyzed by one-way analysis of variance (ANOVA) with a post hoc Geisser-Greenhouse correction was used. Correlation was analyzed by the Pearson's test. The P value of < 0.05 was accepted as statistical significant.
Results
CKAP4 was associated with worsened ccRCC characteristics
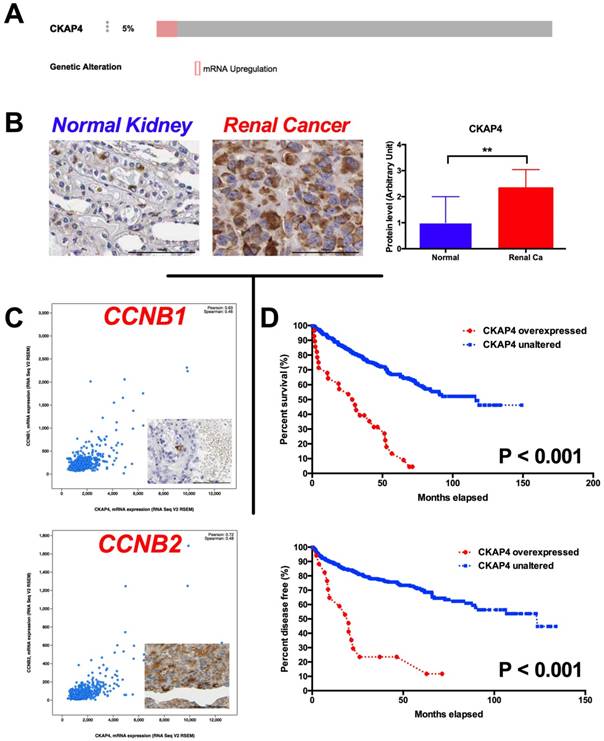
In the in silico exploratory study, we identified 5% of ccRCC cases with CKAP4 overexpression reveal by RNA-seq (Fig 1A). Compared with normal kidney tissue, RCC had significantly higher level of CKAP4 expression (Fig 1B). In silico analysis also showed that overexpressed CKAP4 was significantly associated with T, N, M stages, and Fuhrman grades (Table 1). Overexpression of CKAP4 was not associated with age, gender, or status of neoadjuvant therapy (Table 1). In the validating analysis, we showed in our own cohort that overexpression of CKAP4 was significantly associated not only with T, N, M stages, and Fuhrman grades, but also with patients' age and status of neoadjuvant therapy (NAT) (Table 2). There were 931genes coexpressed in high correlation with CKAP4. The pathway analysis showed that the top 10 altered pathways were cell cycle, especially G2/M phase, regulatory pathways (Table 3). In detail, CCNB1 (Pearson 0.63) and CCNB2 (Pearson 0.72) were respectively expressed with high correlation with CKAP4 (Fig 1C). Patients with overexpressed CKAP4 had significantly worsened overall survival and shorter progression-free period (Fig 1D).
Overexpression of CKAP4 in ccRCC predicts worsened prognosis. A) By Reproduction of TCGA dataset showing 5% of ccRCC samples characterized with CKAP4 overexpression; B) Reproduction of Human Protein Atlas dataset showing significantly overexpression of CKAP4 expression in renal cancer (Ca) compared with normal (NL) kidney tissue; C) Genes within Cyclin B signaling pathway were coexpressed with CKAP4 in ccRCC, with Pearson r of 0.63 for CCNB1 and of 0.72 for CCNB2; D) Kaplan-Meier plotting showing cases with overexpressed CKAP4 showed significantly worsened prognosis and shortened disease free survival compared with cases with unaltered CKAP4 expression (**P < 0.01).
Association between CKAP4 expression and clinicopathological parameters of ccRCC patients, reproduced from TCGA.
| Parameter | In Silico | |||
|---|---|---|---|---|
| Breakdown | CKAP4 Expression (N) | P | ||
| Up | Unchanged | |||
| T | T1 | 6 | 269 | < 0.001 |
| T2 | 2 | 67 | ||
| T3 | 13 | 167 | ||
| T4 | 7 | 4 | ||
| N | N0 | 10 | 229 | 0.009 |
| N1 | 4 | 13 | ||
| M | M0 | 16 | 409 | < 0.001 |
| M1 | 12 | 67 | ||
| Age | 63.93 ± 12.61 | 60.38 ± 12.11 | 0.133 | |
| Gender | Male | 18 | 328 | 1 |
| Female | 10 | 181 | ||
| Grade | I | 0 | 14 | < 0.001 |
| II | 4 | 225 | ||
| III | 6 | 202 | ||
| IV | 17 | 61 | ||
| Neoadjuvant Therapy | NO | 27 | 492 | 1 |
| YES | 1 | 17 | ||
Association between CKAP4 expression and clinicopathological parameters of ccRCC patients from the validation cohort (n = 124, SD = standard deviation).
| Parameter | In Tissue | |||||
|---|---|---|---|---|---|---|
| Breakdown | CKAP4 Expression (Mean ± SD) | P | ||||
| T | T1 | 0.835 | ± | 0.587 | < 0.001 | |
| T2 | 1.88 | ± | 0.516 | |||
| T3 | 1.79 | ± | 0.699 | |||
| T4 | 2.8 | ± | 0.447 | |||
| N | N0 | 1.11 | ± | 0.724 | < 0.001 | |
| N1 | 2.2 | ± | 0.775 | |||
| M | M0 | 1.18 | ± | 0.755 | < 0.001 | |
| M1 | 2.8 | ± | 0.447 | |||
| Age | 59.6 | ± | 6.78 | 0.003 | ||
| Gender | Male | 1.13 | ± | 0.704 | 0.116 | |
| Female | 1.41 | ± | 0.934 | |||
| Grade | I | 0.583 | ± | 0.692 | < 0.001 | |
| II | 1.37 | ± | 0.594 | |||
| III | 1.93 | ± | 0.829 | |||
| IV | 2.5 | ± | 0.577 | |||
| Neoadjuvant Therapy | NO | 1.15 | ± | 0.738 | < 0.001 | |
| YES | 2.71 | ± | 0.488 | |||
Pathway analysis of selected genes coexpressed with CKAP4 in ccRCC cases reproduced from TCGA dataset, showing the top 10 significantly altered pathways.
| Term | Database | Input number | Background number | Corrected P-Value |
|---|---|---|---|---|
| Cell Cycle | Reactome | 138 | 607 | 2.00E-79 |
| @@Disease | Reactome | 52 | 902 | 1.81E-07 |
| @@Cell cycle | KEGG PATHWAY | 36 | 124 | 2.23E-23 |
| Cell Cycle, Mitotic | Reactome | 125 | 503 | 1.03E-75 |
| M Phase | Reactome | 78 | 313 | 2.14E-46 |
| Mitotic Metaphase and Anaphase | Reactome | 62 | 189 | 1.45E-42 |
| Mitotic Anaphase | Reactome | 61 | 188 | 1.02E-41 |
| Separation of Sister Chromatids | Reactome | 60 | 180 | 1.19E-41 |
| Mitotic Prometaphase | Reactome | 53 | 124 | 3.20E-41 |
| Resolution of Sister Chromatid Cohesion | Reactome | 49 | 116 | 6.89E-38 |
CKAP4 was associated with ccRCC cell growth
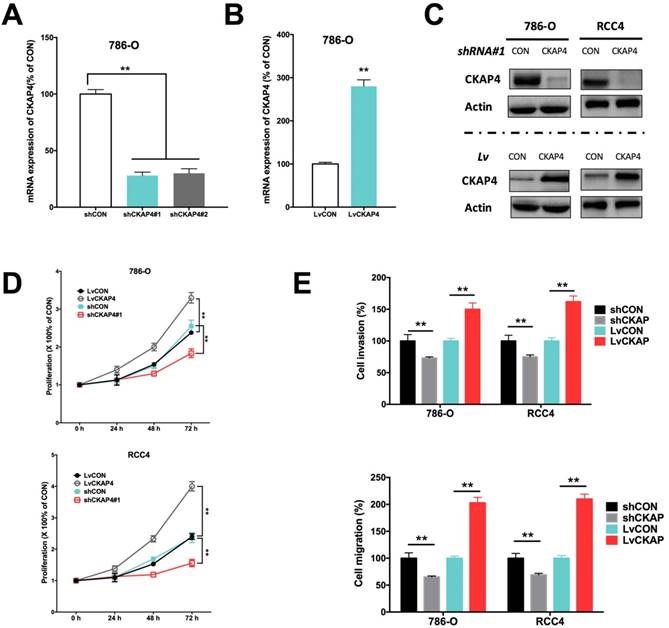
Inhibition of CKAP4 by shRNA and upregulation of CKAP4 by lentivirus were sufficient to alter the CKAP4 level in ccRCC cell lines (Fig 2A-C). CKAP4 silencing significantly inhibited cell proliferation of ccRCC cells (Fig 2D). CKAP4 upregulation significantly promoted cell proliferation of ccRCC cells (Fig 2D). Silencing of CKAP4 also significantly inhibited invasion and migration of ccRCC cells (Fig 2E). Likewise, overexpression of CKAP4 significantly increased invasion and migration of ccRCC cells (Fig 2E).
CKAP4 was associated with ccRCC cell growth. A) Effective silencing of CKAP4 mRNA expression using 2 shRNAs; B) Effective upregulation of CKAP4 mRNA expression using CKAP4-bearing lentivirus; C) Protein level of CKAP4 corresponded to mRNA expression in response to shRNA downregulation and lentiviral upregulation; D) Upregulation of CKAP4 significantly increased proliferation and downregulation of CKAP4 significantly inhibited proliferation of both 786-O and RCC4 ccRCC cell lines; E) Upregulation of CKAP4 significantly increased cell invasion and migration, and downregulation of CKAP4 significantly inhibited cell invasion and migration of both 786-O and RCC4 ccRCC cell lines (**P < 0.01, n = 3, Lv = lentiviral).
CKAP4 was associated with G2/M mediation in ccRCC
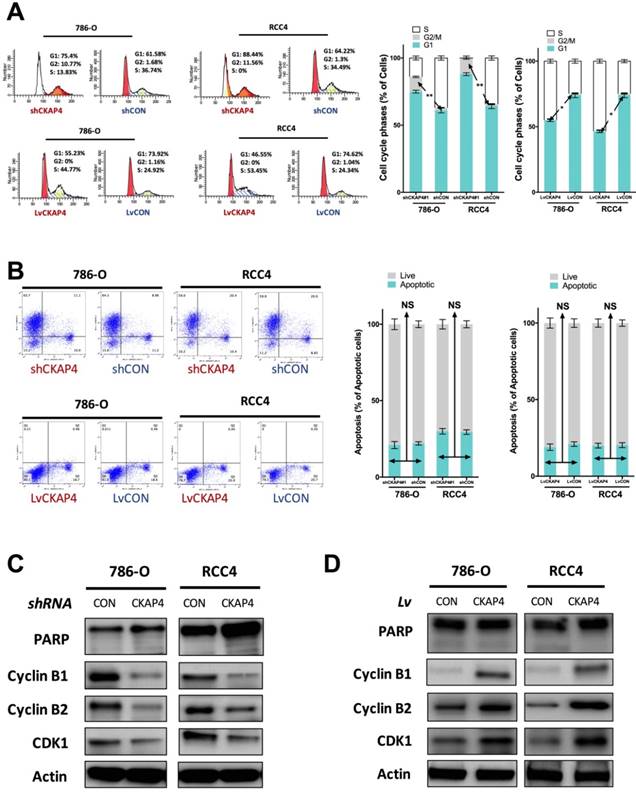
Inhibition of CKAP4 significantly induced increased cell population at G2/M phase of cell cycle of ccRCC cells (Fig 3A). CKAP4 upregulation significantly reduced cell population at G2/M phase of cell cycle of ccRCC cells (Fig 3A). Nonetheless, as ccRCC cells at G2/M phase were at a low count at basal status, the difference for CKAP4 upregulated group was not as much as the silencing group (Fig 3A). In apoptosis assay, neither silencing nor upregulation of CKAP4 showed significant alteration in apoptotic profile (Fig 3B). CKAP4 silencing induced apparent decreased levels of Cyclin B1, Cyclin B2, and CDK1, while having no impact on PARP cleavage, which indicated cell apoptosis (Fig 3C). CKAP4 upregulation induced apparent increased levels of Cyclin B1, Cyclin B2, and CDK1, while also having no impact on PARP cleavage, which indicated cell apoptosis (Fig 3D).
CKAP4 was associated with G2/M mediation in ccRCC. A) Cell cycle analysis revealing CKAP4 silencing significantly increased cell population in G2/M phase and CKAP upregulation significantly decreased cell population in G2/M phase in both 786-O and RCC4 ccRCC cell lines; B) Cell apoptosis analysis revealing CKAP4 silencing or upregulation had no significant impact on cell apoptosis in either 786-O of RCC4 ccRCC cell line; C) Silencing of CKAP4 induced decreased Cyclin B1, Cyclin B2, and CDK1 in both 786-O and RCC4 ccRCC cell lines; D) Upregutaion of CKAP4 induced increased Cyclin B1, Cyclin B2, and CDK1 in both 786-O and RCC4 ccRCC cell lines (*P < 0.05; *P < 0.01; n = 3, Lv = lentiviral).
CCNB1 inhibition decreased tumor growth of ccRCC with CKAP4 upregulation
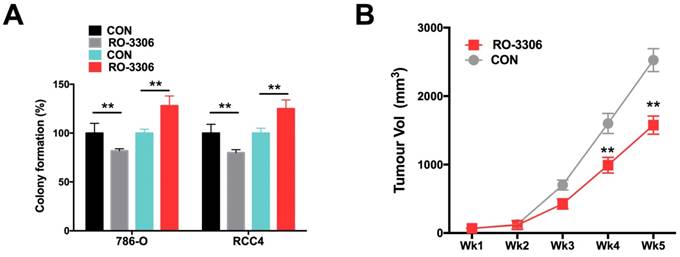
Using the CDK/CCNB inhibitor (RO-3306), we demonstrated that RO-3306 significantly inhibited anchorage-independent growth in terms of colony formation in ccRCC cells (Fig 4A). Also, administration of RO-3306 to 786-O xenograft mice significantly inhibited tumor growth (Fig 4B).
Pharmaceutical CCNB1 inhibition (RO-3306) decreased tumor growth of ccRCC with CKAP4 upregulation. A) Colony formation assay showing significantly decreased anchorage-independent growth of both 786-O and RCC4 ccRCC cells with lentiviral CKAP4 upregulation; B) Xenograft mouse model implanted with 786-O cells were treated with RO-3306 showed significantly decreased tumor growth from the 4th week on (**P < 0.01, n=10).
Discussion
In the current study, we have for the first time revealed the role of CKAP4 in ccRCC. Cancer heterogeneity is identified as a characteristic of ccRCC and thus genetic alteration at a lower frequency may also provide prognostic merit. Indeed, overexpressed CKAP4, though only in 5% of cases, was significantly associated worsened prognosis and shorter disease-free period. In particular, patients with CKAP4 overexpression showed a drastically fall of overall survival, indicating a strong pro-tumorigenic role. Unlike the previous report on CKAP4, we showed that it played a role in G2/M phase promotion in ccRCC. Such effect was delivered via co-upregulation of Cyclins B1 and B2. Thus, in general, we have provided evidence that a small portion of ccRCC with specific genotype is featured with G2/M dysregulation, on which targeted therapy could be promising.
There is a discrepancy between the in silico exploration and our own validation with regard to association between CKAP4 expression and clinicopathological parameters. In the TCGA cohort, the association between CKAP4 expression and age, gender or NAT status. However, in our cohort, all three parameters showed significant correlation with CKAP4 over expression. The possible explanation could be as follows. First, our cohort is limited in sample size and patient selection is heavily biased. There are too few T4 tumors in our cohort and all those cases are limited to male patients who underwent NAT. Therefore, external validation with a larger and preferably prospective cohort is warranted. Second, we quantified CAKP4 expression as a continuous variant, which is different from the dichotomized stratification in TCGA. Also, we evaluated the protein level rather than mRNA expression that TCGA detected in our cohort, with the presumption that the mRNA and protein level corresponds with each other in ccRCC, another point that needs to be validated in further studies. Therefore, there is a need to provide universal grading or scoring system for CKAP4 expression in ccRCC. Given that RNA-seq or array is not extensively clinically available in most surgery institutions, we suggest a semi-quantitative IHC scoring system for CKAP4, as supported in The Human Protein Atlas dataset, where CKAP4 expression is studied in a variety of cancer and normal tissues.
Cell cycle dysregulation is not considered a truncal alteration in ccRCC, despite a handful of basic researches showing many potential tumor markers impacting on cell cycle regulation in ccRCC. Dysregulation of G2/M phase in ccRCC has been reported in many studies, indicating the role G2/M checkpoint could have been underestimated. Pan et al show that EIF3D silencing suppresses renal cell carcinoma tumorigenesis via inducing G2/M arrest through downregulation of Cyclin B1/CDK1 signaling[21]. Nolte et al, on the other hand discover a new semisynthetic cardenolide analog 3β-[2-(1-amantadine)- 1-on-ethylamine]-digitoxigenin (AMANTADIG) that affects G2/M cell cycle arrest and miRNA expression profiles and enhances proapoptotic survivin-2B expression in renal cell carcinoma cell lines[22]. Li et al report inhibition of γ-secretase by retinoic acid chalcone (RAC) induces G2/M arrest and triggers apoptosis in renal cell carcinoma[23]. Another group report that CMTM4 is frequently downregulated and functions as a tumor suppressor in clear cell renal cell carcinoma by inducing G2/M cell cycle arrest[24]. Also, there are reports linking G2/M regulation with other “hot” cancer pathways in ccRCC. For instance, Shang et al report that decitabine induces G2/M cell cycle arrest by suppressing p38/NF-κB signaling in human renal clear cell carcinoma[25]. Wu et al report that inhibition of γ-secretase induces G2/M arrest and triggers apoptosis in renal cell carcinoma[26]. Juengel et al find that HDAC-inhibition counteracts everolimus resistance in renal cell carcinoma in vitro by diminishing cdk2 and cyclin A, both of which participate in the G2/M-phase regulation[27]. Thus far, no direct evidence linking HIF signaling with Cyclin B signaling is lacking, let alone in ccRCC. How those two hubs crosstalk in ccRCC remains unclear. The VHL-mediated hypoxia is reported to mediated Cycin D1 in ccRCC[28]. The correlation study addressing this topic is underway in our group. Those reports, together with our finding that CKAP4 is closely related to cell cycle regulation, puts G2/M checkpoint in potentially pivotal hub in the progression of ccRCC and downstream effectors could be of important pharmaceutical value.
Another confounding finding in the current study is the lack of apoptotic trait of CKAP4 in ccRCC cells. As a factor impacting so much on prognosis, CKAP4's not interplaying with apoptotic signaling is intriguing. Given that Cyclin B axis could possibly be the direct regulator of cell cycle in ccRCC, the prognostic role of CKAP4 could be amplified by the univariate analysis in our study, not considering the series of genes coexpressed with CKAP. In this group of patients with lethal disease, there could be a panel of genes that are upregulated, connecting functionally with each other and the additive effect in all contribute to the aggressive phenotype. Therefore, how CKAP4 mediates crosstalk with other factors to promote progression of ccRCC warrants further study.
Competing Interests
The authors have declared that no competing interest exists.
References
1. Cherkasova E, Scrivani C, Doh S, Weisman Q, Takahashi Y, Harashima N. et al. Detection of an Immunogenic HERV-E Envelope with Selective Expression in Clear Cell Kidney Cancer. Cancer Res. 2016;76:2177-85
2. Hsieh JJ, Purdue MP, Signoretti S, Swanton C, Albiges L, Schmidinger M. et al. Renal cell carcinoma. Nat Rev Dis Primers. 2017;3:17009
3. Tannir NM, Schwab G, Grunwald V. Cabozantinib: an Active Novel Multikinase Inhibitor in Renal Cell Carcinoma. Curr Oncol Rep. 2017;19:14
4. Duran I, Lambea J, Maroto P, Gonzalez-Larriba JL, Flores L, Granados-Principal S. et al. Resistance to Targeted Therapies in Renal Cancer: The Importance of Changing the Mechanism of Action. Target Oncol. 2017;12:19-35
5. El-Mokadem I, Kidd T, Pratt N, Fleming S, Nabi G. Tumour suppressor gene (CDKNA2) status on chromosome 9p in resected renal tissue improves prognosis of localised kidney cancer. Oncotarget. 2016;7:73045-54
6. Li MH, Dong LW, Li SX, Tang GS, Pan YF, Zhang J. et al. Expression of cytoskeleton-associated protein 4 is related to lymphatic metastasis and indicates prognosis of intrahepatic cholangiocarcinoma patients after surgery resection. Cancer Lett. 2013;337:248-53
7. Bhavanasi D, Speer KF, Klein PS. CKAP4 is identified as a receptor for Dickkopf in cancer cells. J Clin Invest. 2016;126:2419-21
8. Cancer Genome Atlas Research N. Comprehensive molecular characterization of clear cell renal cell carcinoma. Nature. 2013;499:43-9
9. Gao J, Aksoy BA, Dogrusoz U, Dresdner G, Gross B, Sumer SO. et al. Integrative analysis of complex cancer genomics and clinical profiles using the cBioPortal. Sci Signal. 2013;6:pl1
10. Cerami E, Gao J, Dogrusoz U, Gross BE, Sumer SO, Aksoy BA. et al. The cBio cancer genomics portal: an open platform for exploring multidimensional cancer genomics data. Cancer Discov. 2012;2:401-4
11. Xie C, Mao X, Huang J, Ding Y, Wu J, Dong S. et al. KOBAS 2.0: a web server for annotation and identification of enriched pathways and diseases. Nucleic Acids Res. 2011;39:W316-22
12. Wu J, Mao X, Cai T, Luo J, Wei L. KOBAS server: a web-based platform for automated annotation and pathway identification. Nucleic Acids Res. 2006;34:W720-4
13. Uhlen M, Fagerberg L, Hallstrom BM, Lindskog C, Oksvold P, Mardinoglu A. et al. Proteomics. Tissue-based map of the human proteome. Science. 2015;347:1260419
14. Uhlen M, Oksvold P, Fagerberg L, Lundberg E, Jonasson K, Forsberg M. et al. Towards a knowledge-based Human Protein Atlas. Nat Biotechnol. 2010;28:1248-50
15. Uhlen M, Bjorling E, Agaton C, Szigyarto CA, Amini B, Andersen E. et al. A human protein atlas for normal and cancer tissues based on antibody proteomics. Mol Cell Proteomics. 2005;4:1920-32
16. Ponten F, Jirstrom K, Uhlen M. The Human Protein Atlas-a tool for pathology. J Pathol. 2008;216:387-93
17. Feng C, Ho Y, Sun C, Xia G, Ding Q, Gu B. TFPI-2 expression is decreased in bladder cancer and is related to apoptosis. J BUON. 2016;21:1518-23
18. Wang L, Feng C, Ding G, Zhou Z, Jiang H, Wu Z. Relationship of TP53 and Ki67 expression in bladder cancer under WHO 2004 classification. J BUON. 2013;18:420-4
19. Feng CC, Ding GX, Song NH, Li X, Wu Z, Jiang HW. et al. Paraneoplastic hormones: parathyroid hormone-related protein (PTHrP) and erythropoietin (EPO) are related to vascular endothelial growth factor (VEGF) expression in clear cell renal cell carcinoma. Tumour Biol. 2013;34:3471-6
20. Feng CC, Wang PH, Ding Q, Guan M, Zhang YF, Jiang HW. et al. Expression of pigment epithelium-derived factor and tumor necrosis factor-alpha is correlated in bladder tumor and is related to tumor angiogenesis. Urol Oncol. 2013;31:241-6
21. Pan XW, Chen L, Hong Y, Xu DF, Liu X, Li L. et al. EIF3D silencing suppresses renal cell carcinoma tumorigenesis via inducing G2/M arrest through downregulation of Cyclin B1/CDK1 signaling. Int J Oncol. 2016;48:2580-90
22. Nolte E, Wach S, Thais Silva I, Lukat S, Ekici AB, Munkert J. et al. A new semisynthetic cardenolide analog 3beta-[2-(1-amantadine)- 1-on-ethylamine]-digitoxigenin (AMANTADIG) affects G2/M cell cycle arrest and miRNA expression profiles and enhances proapoptotic survivin-2B expression in renal cell carcinoma cell lines. Oncotarget. 2017
23. Li QC, Li HJ, Liu S, Liang Y, Wang X, Cui L. Inhibition of gamma-secretase by retinoic acid chalcone (RAC) induces G2/M arrest and triggers apoptosis in renal cell carcinoma. Int J Clin Exp Pathol. 2015;8:2400-7
24. Li T, Cheng Y, Wang P, Wang W, Hu F, Mo X. et al. CMTM4 is frequently downregulated and functions as a tumour suppressor in clear cell renal cell carcinoma. J Exp Clin Cancer Res. 2015;34:122
25. Shang D, Han T, Xu X, Liu Y. Decitabine induces G2/M cell cycle arrest by suppressing p38/NF-kappaB signaling in human renal clear cell carcinoma. Int J Clin Exp Pathol. 2015;8:11140-8
26. Wu K, Zhang L, Lin Y, Yang K, Cheng Y. Inhibition of gamma-secretase induces G2/M arrest and triggers apoptosis in renal cell carcinoma. Oncol Lett. 2014;8:55-61
27. Laviolette LA, Wilson J, Koller J, Neil C, Hulick P, Rejtar T. et al. Human folliculin delays cell cycle progression through late S and G2/M-phases: effect of phosphorylation and tumor associated mutations. PLoS One. 2013;8:e66775
28. Bindra RS, Vasselli JR, Stearman R, Linehan WM, Klausner RD. VHL-mediated hypoxia regulation of cyclin D1 in renal carcinoma cells. Cancer Res. 2002;62:3014-9
Author contact
![]() Corresponding authors: Xudong Yao and Min Liu, Department of Urology, Shanghai Tenth People's Hospital, Tongji University, Shanghai 200072, China. Tel/Fax: +86-21-66305158; E-mail: drurologycom
Corresponding authors: Xudong Yao and Min Liu, Department of Urology, Shanghai Tenth People's Hospital, Tongji University, Shanghai 200072, China. Tel/Fax: +86-21-66305158; E-mail: drurologycom