Impact Factor ISSN: 1837-9664

 Global reach, higher impact
J Cancer 2017; 8(18):3812-3827. doi:10.7150/jca.20775 This issue Cite
Research Paper
Overexpression of SMOC2 Attenuates the Tumorigenicity of Hepatocellular Carcinoma Cells and Is Associated With a Positive Postoperative Prognosis in Human Hepatocellular Carcinoma
Xu-Qiong Huang2,3, Zi-Qi Zhou1, Xiao-Fei Zhang1, Chang-Long Chen1, Yan Tang1, Qian Zhu1, Jian-Hua Zhang3,4 ![]() , Jian-Chuan Xia1
, Jian-Chuan Xia1 ![]()
1. State Key Laboratory of Oncology in Southern China, Sun Yat-sen University Cancer Center, Guangzhou, Guangdong province, 510060, China;
2. Huadu District People's Hospital of Guangzhou, Southern Medical University, Guangzhou, Guangdong province, 510800, China;
3. Department of Epidemiology and Health Statistics, Guangdong Pharmaceutical University, Guangzhou, Guangdong province, 510010, China;
4. Department of Health Service Management, Guangzhou University of Chinese Medicine, Guangzhou, Guangdong province, 510006, China.
Xu-Qiong Huang and Zi-Qi Zhou contributed equally to this work.
Received 2017-4-27; Accepted 2017-8-21; Published 2017-10-17
Abstract
Secreted modular calcium binding protein-2 (SMOC2), a recently identified matricellular protein that belongs to the SPARC protein family, has been reported to be downregulated in various cancers. The purpose of this study was to investigate the clinical significance and biological function of SMOC2 in human hepatocellular carcinoma. Real-time quantitative PCR and western blotting analyses revealed that SMOC2 mRNA and protein levels were significantly downregulated in human HCC tissues compared to the matched adjacent normal tissues. Clinicopathological analysis indicated that SMOC2 expression was significantly associated with tumor size, number of tumors, tumor-node-metastasis (TNM) stage and distant metastasis. Kaplan-Meier survival analysis showed that high tumor SMOC2 expression was associated with improved overall survival and disease-free survival in patients with HCC. Functional analyses (cell proliferation and colony formation assays, cell migration and invasion assays, cell cycle and apoptosis assays) demonstrated that stable overexpression of SMOC2 using a lentiviral vector significantly inhibited cell proliferation, colony formation, migration and invasion, and induced G0/G1 phase arrest in HCC cells in vitro. In addition, experiments with a mouse model revealed the suppressed effect of SMOC2 on HCC tumorigenicity and metastases in vivo. These results suggest that SMOC2 functions as a tumor suppressor during the development of HCC and may represent an effective prognostic factor and novel therapeutic target for HCC.
Keywords: SMOC2, hepatocellular carcinoma, prognosis, tumor suppressor.
Introduction
Hepatocellular carcinoma (HCC), the most common primary malignancy of the liver, is the sixth most frequently diagnosed cancer worldwide and one of the leading causes of cancer-related mortality in several countries [1-3]. Although the highest rates of liver cancer are reported in certain areas of Asia and Africa, the incidence of HCC is increasing in western countries including the United States [4-7]. Currently, surgical resection, radiofrequency ablation and liver transplantation are considered to be potentially curative therapies that may provide long-term remission in early-stage HCC [8]. However, the utility of these modalities is limited in patients with symptomatic HCC with a large tumor burden and multifocality. Although many non-surgical modalities have been developed to treat HCC, the prognosis after aggressive therapy still remains poor [9]. Moreover, as HCC is characterized by high grade malignancy, rapid tumor cell proliferation, early hepatic metastasis and multidrug resistance, the 5-year survival rate is in the range of only 5% [10]. Furthermore, the molecular mechanisms of hepatocarcinogenesis have not yet been clarified. To confront this dire situation, it is crucial to identify novel molecular markers for early diagnosis as well as new therapeutic targets to improve the outcome of patients with HCC.
The domain structure of secreted modular calcium binding protein-2 (SMOC2) contains two thyroglobulin-like domains, a follistatin-like domain, a novel domain, and the E-F hand calcium-binding domain common to the secreted protein acidic and rich in cysteines (SPARC) protein family [11,12]. The human SMOC2 gene is located on chromosome 6q27, a region that has been suggested to contain one or more tumor suppressor genes [13-15]. Quantitative reverse transcription PCR demonstrated SMOC2 is widely expressed in various human tissues, including skin, liver, muscle and lung [16]. The molecular function of SMOC2 has been partially identified. In vitro assays indicated that SMOC2 influences cell-cycle progression [17], regulated the mitogenic and angiogenic effects of growth factors [18], and mediated cell growth, proliferation [19,20] and cell attachment and migration [21]. However, the molecular function of SMOC2 in cancer is still poorly explored. Several recent microarray studies reported that SMOC2 was significantly downregulated in various tumors, including ovarian cancer [22], pancreatic cancer [23], uterine leiomyoma [24], breast cancer [25], ameloblastoma [26] and papillary thyroid carcinoma [27]. SMOC2 was also suggested to act as a tumor suppressor gene in ovarian cancer [28]. However, Shvab et al. [29] recently observed SMOC2 was upregulated in human colorectal cancer (CRC) tissues and preferentially expressed in areas of tumor invasion, suggesting that SMOC2 may contribute to the development of aggressive CRC. Even though the function of SMOC2 has been investigated in several types of cancer, the detailed functional role of SMOC2 in human HCC has not been reported.
In the present study, we investigated the expression and prognostic value of SMOC2 in primary HCC. The biological function of SMOC2 in the progression of HCC was also explored using HCC cell lines.
Materials and Methods
Cell lines and culture conditions
The human HCC cell line HepG2 and a human liver adenocarcinoma endothelial cell line, SK-Hep1, were obtained from the American Type Culture Collection (Manassas, VA, USA). The Bel-7402 and SMMC7721 cell lines were obtained from the Committee of Type Culture Collection of the Chinese Academy of Sciences (Shanghai, China). The normal hepatic cell line L02 was purchased from Biomics Biotechnologies (Nantong, China). All cell lines were cultured in RPMI 1640 (Gibco, Grand Island, NY, USA) supplemented with 10% fetal bovine serum (FBS; Gibco, Grand Island, NY, USA) and 100U/ml penicillin plus 100μg/ml streptomycin (Invitrogen, Grand Island, NY, USA)at 37°C in a humidified atmosphere of 5% CO2.
Patients and tumor tissue samples
Forty paired HCC tumor tissues and the adjacent non-cancerous liver tissue samples were obtained from patients undergoing surgical resection for HCC at Sun Yat-sen University Cancer Center (SYSUCC) between 2013 and 2015. After resection, the matched fresh tissues were immediately immersed in RNAlater solution (Ambion, Austin, TX, USA) to prevent RNA degradation, stored at 4°C overnight to allow RNAlater to fully penetrate into the tissues and then frozen at -80°C.
In addition, 120 paraffin-embedded samples from patients with HCC who had undergone liver resection at the SYSUCC between 2008 and 2010 were randomly selected. All diagnoses were independently histologically confirmed by at least two experienced pathologists, primarily via examination of H&E stained sections. The histological cell type and tumor stage were assigned according to the World Health Organization (WHO) classification criteria and tumor node metastasis (TNM) staging system of the International Union Against Cancer. None of the patients received preoperative chemotherapy or radiotherapy. Before the study, informed consent was obtained from each patient. This investigation was approved by Ethics Committee of Sun Yat-sen University Cancer Center (SYSUCC; Guangzhou, China).
RNA extraction and real-time quantitative polymerase chain reaction (RT-qPCR)
Total RNA was extracted using TRIzol reagent (Invitrogen) according to the manufacturer's protocol. RNA concentration and quantity were determined by measuring absorbance at 260 nm using a NanoDrop spectrophotometer (ND-1000; Thermo Scientific, Wilmington, DE, USA). Reverse transcription (RT) was performed on 1μg of total RNA/sample using ReverTraAce reverse transcriptase reverse transcriptase (TOYOBO, Shanghai, China) according to the manufacturer's instructions. Newly synthesized cDNA was amplified by real-time PCR to evaluate the relative expression levels of SMOC2 compared to the reference gene glyceraldehyde-3-phosphate dehydrogenase (GAPDH). The primer sequences were as follows: GAPDH, forward 5′-CTCCTCCTGTTCGACAGTCAGC-3′, reverse 5′-CCCAATACGACCAAATCCGTT-3′; and SMOC2, forward 5′-AGGAAAAACAGTGATGCCGC-3′, reverse 5′-AACTGCCTTCGGGGTATGAG-3′. Each RT-qPCR reaction was performed in triplicate in final reaction volumes of 15μL, consisting of 7.5 μL of 2× SYBR Green master mix (Invitrogen), 2μL of each 5′ - and 3′ - primer (1.5pmol/μL), 1 μL of sample cDNA and 4.5μL of nuclease-free water. The cycling parameters began with 50°C for 2 minutes and 95°C for 2 minutes, and then 40 cycles of amplification at 95°C for 15 seconds, 60°C for 30 seconds, and 72°C for 20 seconds, followed by melting curve analysis. The crossing threshold (Ct) value of each sample was calculated during the exponential amplification phase using the instrument's software (SDS v.2.3). The relative expression levels of the target gene were normalized to that of the internal control gene GAPDH. Data was analyzed using the comparative threshold cycle (2-ΔΔCT) method. All experiments were performed in triplicate and results were averaged and expressed in relative units after normalization.
Protein extraction and western blotting
Total proteins were extracted using Radio-Immunoprecipitation Assay (RIPA) Lysis Buffer (Beyotime, Shanghai, China) according to the manufacturer's instructions. The concentration of total proteins was determined using the BCA Protein Assay Kit (Bio-Rad; Hercules, CA, USA). Equal amounts of protein (approximately 30μg per sample) were denatured prior to 12% sodium dodecyl sulfate polyacrylamide gel electrophoresis (SDS-PAGE) electrophoreses, then electro-transferred onto a polyvinylidene fluoride (PVDF) membrane (Millipore, Billerica, MA, USA). After blocked with 5% skimmed-milk in TBST for 60 min, the membranes were incubated overnight at 4°C with rabbit anti-SMOC2 (1:200 dilution; Abcam, Cambridge, MA, USA) and rabbit anti-GAPDH (1:8000 dilution; Proteintech, Chicago, IL, USA). Then, the membranes were washed four times for 10 min with TBST and incubated with horseradish peroxidase (HRP)-conjugated goat anti-rabbit antibody (1:2000 dilution; Cell Signaling Technology, Danvers, MA, USA) for 1h at room temperature. The membranes were washed four times with TBST and the immunoreactive proteins were visualized using an enhanced chemiluminescence system (Cell Signaling Technology). The band intensities were measured using Quantity One software (Bio-Rad Laboratories, Hercules, CA, USA) and target protein levels in each sample were expressed relative to GAPDH.
Patient follow-up
Patient post-operative follow-up was conducted regularly at the outpatient department or follow-up center of SYSUCC. Post-operative follow-up included clinical and laboratory examinations for all patients, which were carried out every three months for the first two years, every six months for the following two years, and annually for the next five years or until death, whichever was sooner. Overall survival (OS), which we employed as a primary measure of prognosis, was defined as the time from surgery to the date of death or last known follow-up. Disease-free survival (DFS) was calculated from the date of surgery to the date of progression, recurrence, death or final follow-up. Complete follow-up data was available for all patients in this research.
Immunohistochemical staining and semi-quantitative analysis
Paraffin sections were deparaffinized in dimethylbenzene and rehydrated in a graded ethanol series (100%, 95%, 90%, 80%, 70%) prior to heating for 2 h at 60°C. After three washes in phosphate-buffered saline (PBS) for 3 min, the slides were boiled in citrate-hydrochloric acid (pH = 6.0) for 15 min in a microwave oven for antigen retrieval, then allowed to cool to room temperature. Endogenous peroxidase activity was blocked using 3% hydrogen peroxide at room temperature for 15 min. After three rinses in PBS for 5 min, non-specific binding was inhibited by incubation in 5% sheep serum albumin for 30 min. Then, the slides were incubated with a primary anti-SMOC2 antibody (1:100 dilution; Abcam, Cambridge, MA, USA) at 4°C overnight in a humidified chamber. After washed in PBS, the slides were incubated with HRP-conjugated secondary antibody (Envasion Detection kit; GK500705; Genentech, San Francisco, CA, USA) at room temperature for 30 min, and then washed five times with PBS for 5 min. The signal was visualized using 3,3′-diaminobenzidine tetrahydrochloride (DAB), and then the sections were counterstained with hematoxylin. Finally, the sections were dehydrated, cleared and sealed before being evaluated by light microscopy. Negative controls were obtained by substituting the primary antibody with PBS.
The total SMOC2 immunostaining score was assessed by two authors who were blinded to the patients' clinical outcome, as follows: the percentage of positive staining was defined as 0 (< 5%, negative), 1 (5%-25%, sporadic), 2 (25%-50%, focal), or 3 (> 50%, diffuse); Staining intensity was classified as 0 (no staining), 1 (weak staining), 2 (moderate staining), or 3 (well staining). The above two values were multiplied to give sum immunostaining scores ranging from 0 to 9. Using the sum immunostaining scores, the expression of SMOC2 was defined as follows: “-” (score of 0-1), “+” (score of 2-3), “++” (score of 4-5), or “+++” (score > 6). Each patient was classified into the low SMOC2 expression group (SMOC2- or SMOC2+) and high SMOC2 expression group (SMOC2++ or SMOC2+++).
Recombinant lentiviruses and cell infection
Recombinant lentiviruses overexpressing SMOC2 (LV-SMOC2) and the negative control vector (LV-NC) were obtained from GenePharma (Suzhou, China). Lentiviral infection was performed by adding the virus solution to Bel-7402 and HepG2 cells in the presence of 5 μg/mL polybrene (Sigma-Aldrich, St. Louis, MO, USA). After 48 hours' infection, the cells were selected by culture in media containing 5 μg/mL puromycin, and puromycin-resistant cells were pooled and cultured for further analysis. The resulting stable cell lines were designated as Bel-7402/LV-SMOC2, Bel-7402/LV-NC, HepG2/LV-SMOC2 and HepG2/LV-NC, respectively. Transfection efficiency was evaluated by western blotting.
Proliferation assays
Cell proliferation was measured using the colorimetric MST assay using methanethiosulfonate (MTS) reagent (Sigma Aldrich, St Louis, MO, USA). Briefly, the cells were collected and seeded into 96-well plates in triplicate at 800 cells/well. After 24 h, 20 μL of MTS (5 mg/mL) was added to quantify cell proliferation on seven consecutive days. The cells were incubated with MTS for 3 h and then the optical absorbance of each well was measured at 490 nm using a microplate reader. Cell growth curves were created by plotting the absorbance (ordinate) against time (abscissa).
Colony formation assay
To assess the viability of HCC cells following infection with LV-SMOC2 and LV-NC, the stably-infected cells were plated in 6-well plates (1000 cells/well), cultured at 37°C for 12 days, then surviving cells were washed twice with PBS, fixed in 75% ethanol for 15 min and stained with 0.5% crystal violet (Beyotime, Institute of Biotechnology, Shanghai, China) for 30 min. Colonies that contained more than 50 cells were counted. Colony-forming efficiency (CFE, %) was calculated using the following formula: CFE = (colony number/plated cell number) × 100%. These experiments were carried out three times independently.
Cell migration and invasion assays
Cell migration and invasion assays were performed using 8μm-pore-size polycarbonate membrane inserts (Corning, Corning, NY, USA) placed in 24-well cell culture insert companion plates. For the migration assays, cells (2 × 10⁵) in 200μL RPMI 1640 were seeded into the upper chamber without Matrigel; for the invasion assays, cells (3 × 10⁵) in 200μL RPMI 1640 were seeded onto the upper chamber of membranes pre-coated with a thin layer of 0.5mg/mL Matrigel (BD Biosciences, Bedford, MA). For both assays, 500 μL RPMI 1640 containing 10% FBS was added to the lower wells. The plates were incubated for 24 h (migration) or 48 h (invasion), then cells that had migrated or invaded to the bottom of the upper membrane were fixed with 75% methanol for 30 min and stained with 0.5% crystal violet for 60 min. Migration or invasion efficiency was determined via microscopy: the numbers of stained cells in 5 random microscopic fields of view per membrane were counted. All assays were performed in triplicate.
Cell cycle analysis
Cell cycle analysis was carried out by flow cytometry (Beckman Coulter, Fullerton, CA, USA) after propidium iodide (PI) staining. In brief, stably infected HCC cells were routinely collected and centrifuged after 48 hours' plating. The cells were washed twice with PBS, fixed in 75% ethanol at -20°C overnight. Then, the cells were washed in cold PBS twice and resuspended in 200 μL PBS containing 20 μL RNase and incubated at 37°C for 30 min. Subsequently, the cells were incubated with propidium iodide (PI; Bestbio, Shanghai, China) in the dark at 4°C for 30 min. Cell cycle distribution was determined within one hour using a flow cytometer (Beckman Coulter; Fullerton, CA) according to the manufacturer's instructions. All experiments were performed three times.
Apoptosis assay
Apoptosis assays were performed by flow cytometry analysis of cells stained with Annexin V-FITC and PI. Cells were collected and centrifuged after infection. After washing twice with cold PBS, the cells were resuspended in 400 μL of 1× binding buffer, then incubated with 5 μL Annexin V-FITC and 5 μL PI (Becton Dickinson) for 15 min in the dark at 4 °C. The stained cells were analyzed by flow cytometry (Beckman Coulter, Fullerton, CA, USA). All experiments were performed for three times.
In Vivo Study
Tumorigenicity assays were performed essentially as previously described with 4- to 5-week-old female BALB/c mice (Shanghai Laboratory Animal Company, SLAC, Shanghai, China). Briefly, for each cell line, 5×10⁶ cells/100 μL of PBS (Gibco, Grand Island, NY, USA) were injected subcutaneously into the posterior flanks of the mice. Tumor volumes were then measured periodically. Tumor size was determined every 3 days by measuring the width and length of the formed tumors. The volume of the tumors was calculated with the following formula: tumor volume = (width2 × length) / 2. Metastasis assays were carried out using mouse xenograft models. Mice were injected with 2×10⁶ cells /100 μl PBS (Gibco, Grand Island, NY, USA) into the lateral tail vein. At inoculation for 8 weeks, all the mice were sacrificed by cervical dislocation and the lungs were harvested. Subsequently, the lungs were embedded in paraffin and serial 2-μm-thick sections of whole lungs were obtained using H&E staining to identify the metastases of HCC cells in vivo. This study was approved by the laboratory animal ethics committee of Sun Yat-sen University. All the experimental procedures involving animals were performed in accordance with the Guide for the Care and Use of Laboratory Animals (NIH publications Nos. 80-23, revised 1996) and the institutional ethical guidelines for animal experiments.
Statistical analysis
Statistical analyses were carried out using SPSS statistical software package (version 21.0; SPSS, Inc., Chicago, IL, USA) and the Prism GraphPad (GraphPad Software, Inc., San Diego, CA, USA). Paired-sample t-tests were used to evaluate the differences in SMOC2 mRNA or protein expression levels between HCC tumor samples and the paired adjacent non-tumor tissue samples. The correlations between SMOC2 expression and the clinicopathological characteristics of the patients were analyzed using the Pearson's chi-square test (χ2). Survival curves for OS and DFS were calculated using the Kaplan-Meier method and evaluated using the log-rank test. A Cox proportional hazards regression model was employed for univariate and multivariate analyses. A two-tailed unpaired Student t-test was used to assess differences in cell proliferation rates, colony formation, cell migration and invasion, cell cycle distribution and apoptotic frequency between LV-SMOC2 and LV-NC HCC cells. Statistical differences from at least three independent experiments were expressed as mean ± standard deviation (SD). A two-sided P-value < 0.05 was considered to be statistically significant.
Results
SMOC2 is downregulated in primary HCC tissue samples
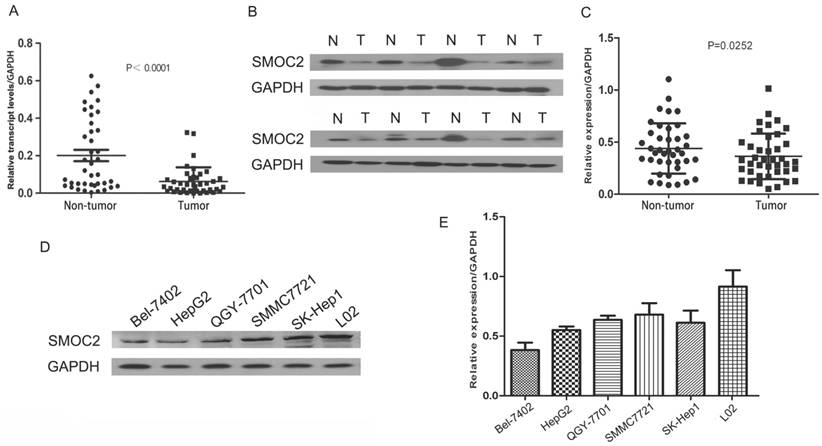
To assess SMOC2 mRNA and protein expression in primary HCC, 40 paired clinical samples from patients with HCC were subjected to real-time quantitative PCR and western blotting. Real-time quantitative PCR showed that SMOC2 mRNA was significantly downregulated in 35 of the 40 (87.5%) HCC tissues compared with the matched adjacent non-tumor tissues (P < 0.001; Fig. 1A). In general, higher RNA transcript levels lead to increased expression of the encoded protein. Western blotting analysis was conducted to verify this relationship for SMOC2. Consistent with the real-time quantitative PCR data, SMOC2 protein expression was downregulated in 29 of the 40 (68%) tumor tissue samples (P = 0.0252; Fig. 1C).
Expression of SMOC2 mRNA and protein in human primary HCC cell lines and surgical specimens as evaluated by RT-qPCR and western blotting A. RT-qPCR revealed the relative expression of SMOC2 was significantly lower in tumor tissues compared to the matched adjacent non-cancerous tissues (n = 40; P < 0.001). B. Representative western blotting analysis of SMOC2 protein expression in eight paired HCC tissues and the matched adjacent non-cancerous tissues (N, matched non-cancerous tissues; T, HCC tissues). C. Relative SMOC2 protein expression was lower in tumor tissues than the matched adjacent non-tumor tissues (n = 40; P = 0.0252). D. Representative western blotting of SMOC2 protein expression in the normal hepatic cell line L02 and five HCC cell lines. E. SMOC2 protein levels were significantly lower in HepG2 and BEL-7402 cells than the normal liver cell line L02.
Immunohistochemical analysis of SMOC2 expression in clinical samples and its association with the clinicopathological characteristics of HCC
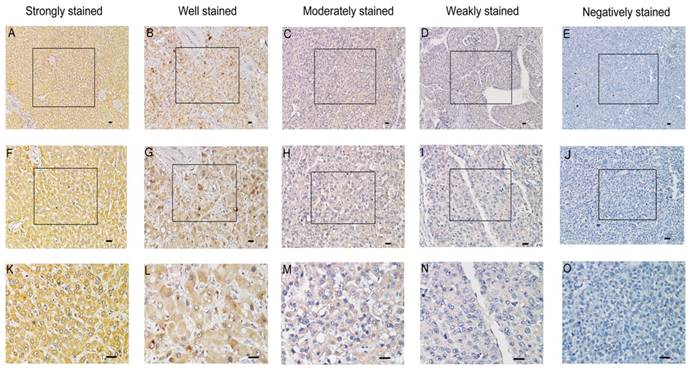
In order to investigate whether the expression of SMOC2 is related to the clinical development and progression of HCC, paraffin-embedded tissue sections (n = 120) were examined using immunohistochemistry. SMOC2 positive staining was predominantly located in the cytoplasm and/or membrane of cells (Fig. 2). The 120 patients were classified into the SMOC2 high group (n = 71, SMOC2+++ or SMOC2++) or SMOC2 low group (n = 49, SMOC2+ or SMOC2-). The detailed characteristics of the patients and the associations between SMOC2 expression and the clinicopathological characteristics of HCC were listed in Table 1. Chi-square analyses suggested that SMOC2 expression was significantly associated with tumor size (P = 0.002), the number of tumors (P = 0.027) and TNM stage (P < 0.001). Moreover, distant metastases was significantly more frequent in the SMOC2 low group (P = 0.013). However, no other clinicopathological features were significantly associated with SMOC2 expression.
Immunohistochemical analysis of SMOC2 protein expression in primary human HCC surgical specimens. A, F and K. Strongly stained normal liver tissue distant from the tumor. B, G and L. Well-stained tumor tissues (SMOC2+++). C, H and M. Moderately-stained tumor tissues (SMOC2++). D, I and N. Weakly-stained tumor tissues (SMOC2+). E, J and O. Negatively-stained tumor tissues (SMOC2-). Scale bars: 100 μm. (A-E, ×100 magnification; F-J, ×200 magnification; K-O, ×400 magnification).
Relationships between SMOC2 expression and the clinicopathological features of the patients with HCC
| Variable | Number | SMOC2 expression | X2 | P-value | |
|---|---|---|---|---|---|
| Low (n = 49) | High (n =71) | ||||
| Age (years) | 0.064 | 0.800 | |||
| < 50 | 58 | 23 | 35 | ||
| ≥ 50 | 62 | 26 | 36 | ||
| Gender | 0.530 | 0.467 | |||
| Male | 110 | 46 | 64 | ||
| Female | 10 | 3 | 7 | ||
| HBV | 2.455 | 0.117 | |||
| Negative | 17 | 4 | 13 | ||
| Positive | 103 | 45 | 58 | ||
| Tumor size (cm) | 9.156 | 0.002* | |||
| < 5 | 49 | 12 | 37 | ||
| ≥ 5 | 71 | 37 | 34 | ||
| Tumor number | 4.896 | 0.027* | |||
| Single | 93 | 33 | 60 | ||
| Multiple | 27 | 16 | 11 | ||
| Tumor encapsulation | 4.758 | 0.093 | |||
| Complete | 48 | 14 | 34 | ||
| Incomplete | 39 | 20 | 19 | ||
| None | 33 | 15 | 18 | ||
| Liver cirrhosis | 3.566 | 0.059 | |||
| No | 78 | 27 | 51 | ||
| Yes | 42 | 22 | 20 | ||
| Serum AFP (µg/L) | 2.657 | 0.103 | |||
| < 400 | 67 | 23 | 44 | ||
| ≥ 400 | 53 | 26 | 27 | ||
| Histological grade | 1.621 | 0.445 | |||
| Well | 8 | 2 | 6 | ||
| Moderate | 90 | 36 | 54 | ||
| Poor | 22 | 11 | 11 | ||
| TNM stage | 16.356 | <0.001* | |||
| I + II | 77 | 21 | 56 | ||
| III + IV | 43 | 28 | 15 | ||
| Vascular invasion | 3.608 | 0.057 | |||
| No | 106 | 40 | 66 | ||
| Yes | 14 | 9 | 5 | ||
| Distant metastasis | 6.141 | 0.013* | |||
| No | 106 | 39 | 67 | ||
| Yes | 14 | 10 | 4 | ||
AFP, alfa fetoprotein; TNM, tumor, node, metastasis; *P < 0.05 was considered statistically significant.
Relationship between SMOC2 expression and patient survival in HCC
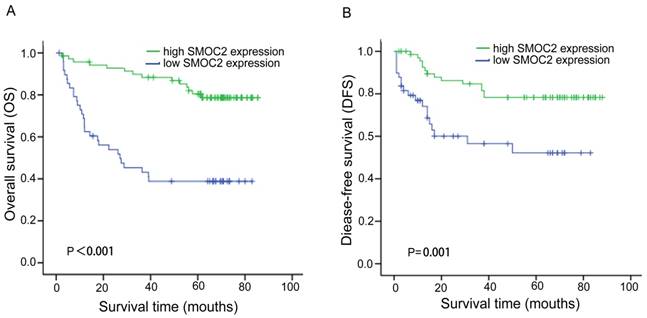
In order to investigate the prognostic value and clinical significance of SMOC2 with respect to postoperative outcomes, the Kaplan-Meier survival analysis and Cox regression analyses for OS and DFS were carried out. In this cohort, 44 patients died and 33 patients had suffered recurrence at last follow-up. Kaplan-Meier analyses showed that patients in the SMOC2 low group had significantly poorer OS and DFS than those in the SMOC2 high group (P < 0.001; Fig. 3A, 3B). As shown in Table 2 and 3, high SMOC2 expression appeared to be a significant positive prognostic factor in HCC in univariate Cox regression analysis of OS (P < 0.001) and DFS (P = 0.002). Furthermore, multivariate Cox regression analysis indicated that high SMOC2 expression was an independent favorable prognostic factor for OS (P = 0.001) and DFS (P = 0.003).
Kaplan-Meier analysis of overall survival (OS) and disease-free survival (DFS) for patients with primary HCC (n = 120) stratified by SMOC2 expression. A. The high SMOC2 group (n = 71) had significantly better overall survival than the low SMOC2 group (n = 49; P < 0.001). B. The high SMOC2 group (n = 71) had significantly better disease-free survival than the low SMOC2 group (n = 49; P = 0.001).
Univariate and multivariate analysis of overall survival in HCC
| Variable | Univariate analysis | Multivariate analysis | |||
|---|---|---|---|---|---|
| HR (95% CI) | P-value | HR (95% CI) | P-value | ||
| Age (≥ 50 vs. < 50 years*) | 1.220 (0.669-2.225) | 0.517 | — | — | |
| Gender (female vs. male*) | 0.687 (0.207-2.278) | 0.540 | — | — | |
| HBV (positive vs. negative*) | 1.760 (0.629-4.928) | 0.282 | — | — | |
| Tumor size (≥ 5 vs. < 5 cm*) | 1.980 (1.035-3.787) | 0.039* | 0.846 (0.369-1.943) | 0.684 | |
| Tumor number (multiple vs. single*) | 4.342 (2.368-7.963) | <0.001* | 2.841 (1.156-6.982) | 0.023* | |
| Tumor encapsulation† | 1.909 (1.323-2.756) | 0.001* | 1.188 (0.730-1.935) | 0.488 | |
| TNM stage (III + IV vs. I + II*) | 3.857 (2.093-7.106) | <0.001* | 1.097 (0.416-2.896) | 0.851 | |
| Liver cirrhosis (positive vs. negative*) | 0.893 (0.478-1.667) | 0.723 | — | — | |
| Histological differentiation‡ | 2.076 (1.156-3.729) | 0.015* | 2.149 (1.084-4.260) | 0.028* | |
| Serum AFP (≥ 400 vs. < 400 µg/L*) | 2.078 (1.140-3.789) | 0.017* | 1.706 (0.887-3.282) | 0.110 | |
| SMOC2 (high vs. low*) | 0.220 (0.116-0.419) | <0.001* | 0.296 (0.146-0.598) | 0.001* | |
| Vascular invasion (positive vs. negative*) | 4.924(2.409-10.064) | <0.001* | 2.250 (0.853-5.933) | 0.101 | |
| Distant metastasis (positive vs. negative*) | 3.014 (1.471-6.174) | 0.003* | 2.011 (0.823-4.916) | 0.125 | |
HR, hazard ratio; CI, confidence interval; AFP, alfa fetoprotein; TNM, tumor, node, metastasis *P < 0.05 was considered statistically significant.
*, Reference group
†, Tumor encapsulation was evaluated as an ordinal categorical variable according to the completeness of the tumor (1: complete; 2: incomplete; 3: none).
‡, Histological differentiation was evaluated as an ordinal categorical variable according to the degree of tumor differentiation (1: well; 2: moderate; 3: poor).
Univariate and multivariate analysis of disease-free survival in HCC
| Variables | Univariate analysis | Multivariate analysis | |||
|---|---|---|---|---|---|
| HR (95% CI) | P-value | HR (95% CI) | P-value | ||
| Age (≥ 50 vs. 50 years*) | 1.046 (0.527-2.075) | 0.898 | — | — | |
| Gender (female vs. male*) | 0.643 (0.154-2.688) | 0.545 | — | — | |
| HBV (positive vs. negative*) | 1.255 (0.441-3.572) | 0.670 | — | — | |
| Tumor size (≥ 5 vs. < 5 cm*) | 1.374 (0.676-2.795) | 0.380 | — | — | |
| Tumor number (multiple vs. single*) | 1.342 (0.581-3.101) | 0.492 | — | — | |
| Tumor encapsulation† | 1.144 (0.754-1.736) | 0.526 | — | — | |
| TNM stage (III + IV vs. I + II*) | 1.692 (0.846-3.384) | 0.137 | — | — | |
| Liver cirrhosis (positive vs. negative*) | 1.021 (0.502-2.076) | 0.954 | — | — | |
| Histological differentiation‡ | 1.243 (0.619-2.498) | 0.541 | — | — | |
| Serum AFP (≥ 400 vs. < 400 µg/L*) | 1.256 (0.628-2.510) | 0.519 | — | — | |
| SMOC2 (high vs. low*) | 0.334 (0.166-0.671) | 0.002* | 0.348 (0.172-0.703) | 0.003* | |
| Vascular invasion (positive vs. negative*) | 3.157 (1.292-7.712) | 0.012* | 2.842 (1.150-7.023) | 0.024* | |
| Distant metastasis (positive vs. negative*) | 1.594 (0.611-4.158) | 0.340 | — | — | |
HR, hazard ratio; CI, confidence interval; AFP, alfa fetoprotein; TNM, tumor, node, metastasis *P < 0.05 was considered statistically significant.
*, Reference group
†, Tumor encapsulation was evaluated as an ordinal categorical variable according to the completeness of the tumor (1: complete; 2: incomplete; 3: none).
‡, Histological differentiation was evaluated as an ordinal categorical variable according to the degree of tumor differentiation (1: well; 2: moderate; 3: poor).
Subgroup analysis of the prognostic value of SMOC2 in HCC
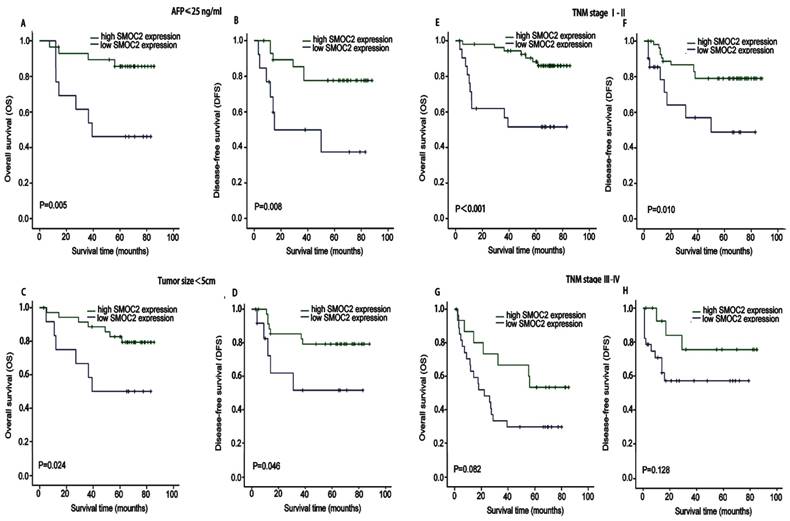
We next performed subgroup analysis based on several clinicopathological factors to confirm the prognostic value of SMOC2 in HCC. The prognostic value of SMOC2 expression was analyzed when patients were stratified according to TNM stage, serum AFP and tumor size. As shown in Fig. 4, the high and low SMOC2 groups had significantly different outcomes in the patient subgroup with serum AFP ≤ 25 ng/mL (P < 0.05; Fig. 4A, 4B) and subgroup with a tumor size < 5 cm (P < 0.05; Fig. 4C, 4D). Similar results were obtained for the TNM stage I-II subgroup (P < 0.05; Fig. 4E, 4F). However, neither OS or DFS were significantly different between the SMOC2 high and low groups in the TNM stage III-IV subgroup (P > 0.05; Fig. 4G, 4H). Taken together, these results indicated that SMOC2 could help to evaluate the prognosis of patients with early stage HCC.
Kaplan-Meier analysis of OS and DFS in subgroups of patients with HCC stratified by SMOC2 expression. A, B. OS and DFS for the subgroup with serum AFP ≤ 25 ng/mL (n = 42). C, D. OS and DFS for the subgroup with a tumor < 5 cm (n = 49). E, F. OS and DFS for the subgroup with TNM stage I-II HCC (n = 77). G, H. OS and DFS for the subgroup with TNM stage III-IV HCC (n = 43). P-values were calculated using the log-rank test.
Overexpressing SMOC2 inhibits the proliferation and colony formation ability of HCC cells
Western blotting revealed SMOC2 protein expression was downregulated in five HCC cell lines tested (Bel-7402, HepG2, QGY-7701, SK-Hep1, SMMC-7721), compared to the normal hepatic cell line L02 (Fig. 1D). The relative expression levels of SMOC2 were lower in Bel-7402 and HepG2 cells than those in other HCC cell lines (Fig. 1E). Accordingly, Bel-7402 and HepG2 cells were infected with LV-SMOC2 to overexpress SMOC2 or the negative control LV-NC in order to investigate the functional role of SMOC2 in HCC. Expression of SMOC2 in the infected cells was confirmed by western blotting. SMOC2 protein expression was up-regulated after infection with LV-SMOC2 relative to cells infected with LV-NC in both cell lines (Fig. 5A, 5B).
Overexpression of SMOC2 inhibits the growth of HCC cells in vitro. A, B. Western blotting was used to confirm overexpression of SMOC2 in HepG2 (A) and Bel-7402 (B) cells infected with the LV-SMOC2 compared to cells infected with the LV-NC. C, D. Cell-proliferation assays showed overexpression of SMOC2 suppressed the proliferation of HepG2 (C) and Bel-7402 (D) cells. E, F. Colony-formation assays indicated overexpression of SMOC2 reduced the growth of HepG2 (E) and Bel-7402 (F) cells. All experiments were carried out in triplicate. Quantitative analyses of foci numbers are shown as mean ± SD. P-values were calculated using the Student's t-test; *P < 0.05, **P < 0.01 and ***P < 0.001 versus negative control LV-NC.
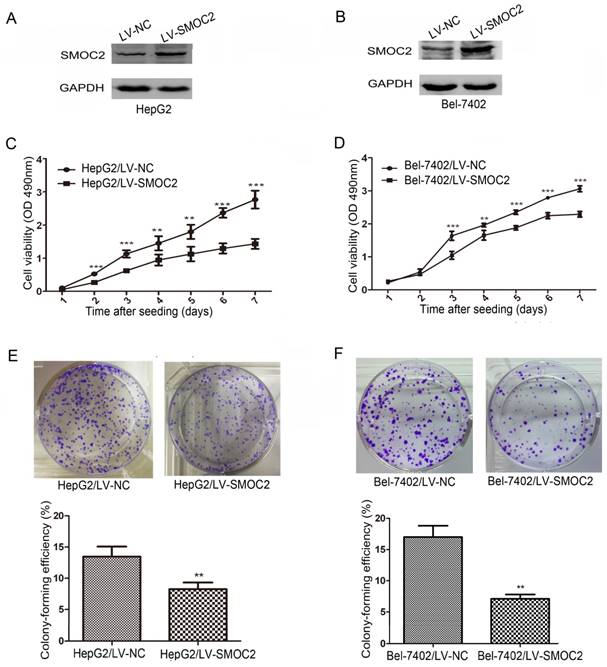
To determine whether SMOC2 could affect tumor growth in vitro, we carried out cell proliferation and colony formation assays. Cell proliferation (P < 0.05; Fig. 5C, 5D) and colony-formation ability (P < 0.01; Fig. 5E, 5F) were significantly inhibited in HepG2 and Bel-7402 cells infected with LV-SMOC2 compared to cells infected with LV-NC.
SMOC2 does not induce apoptosis but alters cell cycle progression in HCC cells
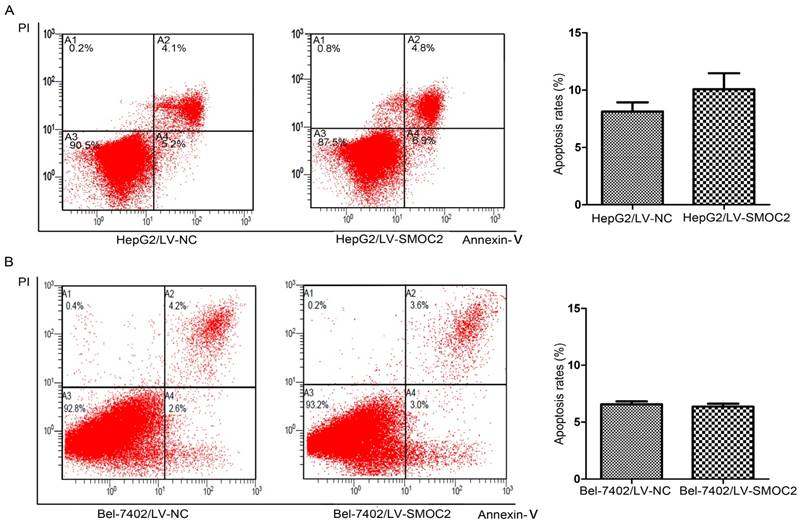
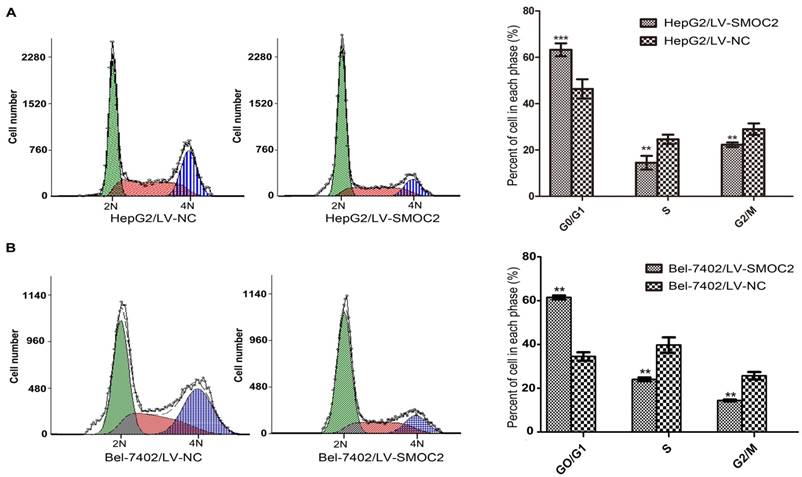
In order to explore the potential mechanism underlying the anti-proliferation effect of SMOC2, we carried out apoptosis and cell cycle analyses using flow cytometry. Apoptosis was analyzed using FITC-Annexin V/PI staining and flow cytometry. No significant differences in the numbers of apoptotic cells were observed between HCC cells overexpressing SMOC2 and those infected with the negative control LV-NC (P > 0.05; Fig. 6A, 6B). Cell cycle analyses were performed to determine the percentages of cells in each phase of the cell cycle. As shown in Fig. 8, HepG2 and Bel-7402 cells infected with LV-SMOC2 had significantly increased proportions of cells in the G0/G1 phase and significantly decreased proportions of S and G2/M phase cells compared to cells infected with the negative control LV-NC (P < 0.01; Fig. 7A, 7B). These results suggest that up-regulating the expression of SMOC2 may arrest cell cycle progression in the G0/G1 phase and thus inhibit cell proliferation.
SMOC2 has no effect on apoptosis in HCC cells. A, B. The numbers of apoptotic cells were not significantly between HepG2 (A) and Bel-7402 (B) cells infected with LV-SMOC2 to overexpress SMOC2 or the negative control LV-NC. P-values were calculated using the Student's t-test; *P < 0.05, **P < 0.01 and ***P < 0.001 versus negative control LV-NC.
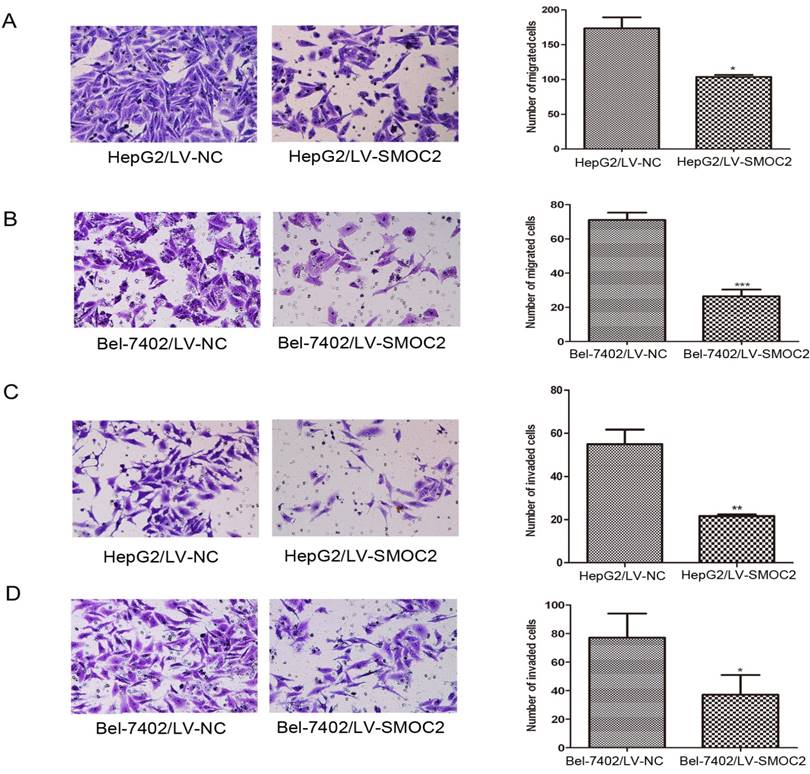
Overexpression of SMOC2 inhibits the migration and invasion of HCC cells in vitro. A, B. Overexpression of SMOC2 using LV-SMOC2 inhibited the migration of HepG2 (A) and Bel-7402 (B) cells in the migration assay. C, D. Overexpression SMOC2 attenuated the invasion of HepG2 (C) and Bel-7402 (D) cells though Matrigel in the invasion assay. Representative images are shown on the left (×200 magnification) with quantification of the numbers of cells in ten randomly-selected fields shown on the right. Data are mean ± SD of three independent experiments. P-values were calculated using the Student's t-test; *P < 0.05, **P < 0.01 and ***P < 0.001 versus negative control LV-NC.
Overexpression of SMOC2 induces G0/G1 phase cell cycle arrest in HCC cells. A, B. Flow cytometric analysis of Annexin V/PI-stained cells. Overexpression of SMOC2 using LV-SMOC2 induced G0/G1 arrest in both HepG2 (A) and Bel-7402 (B) cells. P-values were calculated using the Student's t-test; *P < 0.05, **P < 0.01 and ***P < 0.001 versus negative control LV-NC.
Overexpression of SMOC2 attenuates the migration and invasion of HCC cells
As previously described, SMOC2 expression was significantly associated with clinical stage and tumor metastasis in human HCC (Table 1). Hence, migration and Matrigel invasion assays were employed to determine the effects of SMOC2 expression on metastasis in HCC. Infection with LV-SMOC2 significantly repressed the migration and invasion abilities of HepG2 and Bel-7402 cells compared to cells infected with the negative control LV-NC (P < 0.05; Fig. 8A, 8B, 8C, 8D).
SMOC2 inhibits the growth and metastasis of HCC cells in nude mice
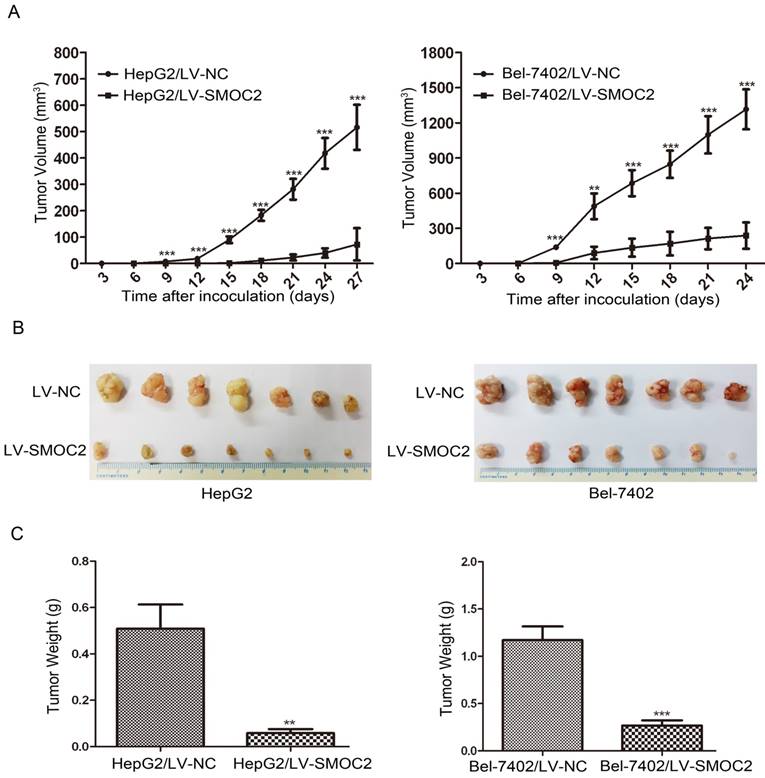
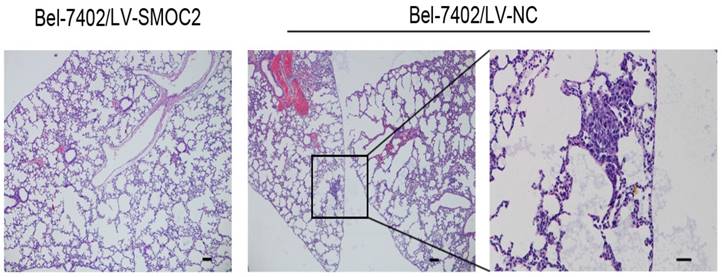
In order to determine whether SMOC2 could affect tumor growth in vivo, HepG2 and Bel-7402 infected with LV-SMOC2 and LV-NC were injected subcutaneously into nude mice. The results showed that SMOC2 overexpression in HepG2 and Bel-7402 significantly delayed tumor growth compared with the negative control cells (Fig. 9A). Accordingly, the means and standard deviations of tumor volume in the SMOC2 overexpression group at the end of observation were significantly smaller than that of the control group (72.64±61.33 mm3 vs. 516.14±225.51 mm3 for HepG2, 238.28±112.56 mm3 vs. 1315.29±450.17 mm3 for Bel-7402; Fig. 9B). And the means and standard deviations of tumor weight in the SMOC2 overexpression group were markedly lower than those in the control group (0.0584±0.0458g vs. 0.509±0.274g for HepG2, 0.266±0.147 vs.1.171±0.384 g for Bel-7402; Fig.9C). In order to determine the effect of SMOC2 on metastasis in vivo, Bel-7402 cells infected with LV-SMOC2 or LV-NC were injected into the tail veins of nude mice (n= 7 per group). After 8 weeks, we checked for lung micrometastases. We found that 2 of the mice injected with control cells developed lung metastases, but none of the mice in the SMOC2 overexpression group developed small metastases in the lungs (Fig. 10).
Overexpression of SMOC2 suppresses the tumorigenicity of HCC in vivo. HepG2 or Bel-7402 cells infected with LV-NC and LV-SMOC2 were injected into nude mice, as described in the Materials and Methods section. A. The tumor growth curves for each group. The tumor growth rate was reduced in the tumors that overexpressed SMOC2. B. Photographs of dissected tumors from the nude mice. The final tumor volumes were smaller in the HepG2/LV-SMOC2 and Bel-7402/LV-SMOC2 groups than that in the control group. C. The tumor weights of each group. The final tumor weights were decreased in the tumors that overexpressed SMOC2. The data are presented as mean ± SD. P-values were calculated using the Student's t-test. *P < 0.05, **P < 0.01 and ***P < 0.001 versus negative control LV-NC.
Overexpression of SMOC2 suppresses the lung metastasis of HCC in vivo. Overexpression of SMOC2 decreased the rate of lung metastasis after tail-vein injection of Bel-7402/LV-SMOC2 or control cells. Representative histological images of lung sections were shown. Black arrow indicates the metastatic nodule. Scale bars: 100 μm.
Discussion
Matricellular proteins are a class of non-structural ECM proteins that modulate cell-matrix interactions and cellular functions, such as growth factor signaling and cell migration [30, 31]. Uncontrolled matricellular protein activity can contribute to aberrant tissue microenvironment homeostasis, and promote a multitude of biological processes essential for tumorigenesis such as the epithelial-to-mesenchymal (EMT) transition, tumor cell motility, proliferation and invasion [30,32-34]. Therefore, matricellular proteins could potentially represent a group of effective biomarkers for cancer. SMOC2 is a recently identified matricellular protein that belongs to the SPARC protein family [16]. Several SPARC family members have been found to be involved in oncogenesis and tumor progression. For example, Catalina et al. reported overexpression of SPARC reduced tumor cell proliferation and migratory ability in HCC [35]. Another number of the SPARC family, Hevin, functions as a tumor suppressor in various types of cancer [36, 37]. SMOC2 was identified as a candidate protein implicated in a number of processes in cancer [38], and has been demonstrated to be downregulated in various malignancies by microarray analysis [22-27]. Despite this knowledge, the actual expression of SMOC2 and its correlation with the clinicopathological features and prognosis of human HCC have not been reported, and its biological role in HCC is poorly characterized.
In this study, we examined SMOC2 mRNA and protein expression in paired primary HCC tissue samples using real-time quantitative PCR and western blotting, respectively. SMOC2 was frequently downregulated at both the transcriptional and translational levels in primary HCC, which is consistent with a recent study of gallbladder carcinoma by Gu et al. [39]. Immunohistochemical staining confirmed SMOC2 expression was downregulated in most HCC tumor tissues compared with the corresponding non-tumor tissues. These observations support the hypothesis that SMOC2 may serve as a tumor suppressor in some types of cancer.
To our knowledge, there are no previous reports on the relationship between SMOC2 expression and the clinicopathological features and prognosis of patients with cancer. This study reveals that a relationship exists between SMOC2 expression and the prognosis of patients with HCC. Low SMOC2 expression was significantly associated with advanced TNM stage and distant metastasis in HCC, suggesting downregulation of SMOC2 may facilitate tumor cell migration and invasion. Additionally, low SMOC2 expression was significantly associated with larger tumors and a higher number of tumors, indicating downregulation of SMOC2 may promote tumor growth in HCC. Similarly, a recent microarray analysis identified downregulation of SMOC2 was associated with advanced tumor stage in breast cancer [40]. Moreover, Kaplan-Meier survival analysis revealed that patients with low SMOC2 expression had poorer OS and DFS after surgical resection. Furthermore, multivariate Cox regression analyses confirmed SMOC2 expression was an independent prognostic factor for OS and DFS. These results suggest SMOC2 may serve as a new prognostic factor to indicate the outcomes of patients with HCC after surgical resection.
As far as we know, the cellular function of SMOC2 has been studied in several types of solid cancers. Hiroshi [41] found that SMOC2 was significantly upregulated in metastatic head and neck squamous cell carcinoma (HNSCC) cell lines compared with non-metastatic HNSCC cell lines using microarray analysis, and they identified SMOC2 as a candidate gene that regulates the pathways related to distant metastasis in HNSCC. Shvab [29] isolated Ls174T colorectal cancer (CRC) cell clones stably overexpressing SMOC2 to examine the effect of changes in SMOC2 levels on CRC cells and the molecular mechanisms whereby SMOC2 confers its effects on CRC cells. They found that SMOC2 overexpression promoted the motility, proliferation and metastasis of CRC cells and it promoted dispersed colony morphology by increasing the expression of Snail and reducing E-cadherin levels by amechanism involving ILK. Additionally, a similar result was found in lung adenocarcinoma. Jennifer knocked down SMOC2 in 482N1 lung adenocarcinoma cells with two independent shRNAs and assessed cellular functions in vitro and metastatic ability in vivo. They found that SMOC2 knockdown inhibited clonal growth ability and it was required for efficient metastatic seeding in vivo, suggesting that Smoc2 is a pro-metastatic factor. In order to elucidate the potential mechanism by which SMOC2 contributes to the development of HCC, A recombinant lentivirus was used to overexpress SMOC2 in two HCC cell lines, i.e. HepG2 and Bel-7402 cells, and cellular functions of SMOC2 were also investigated in vitro and vivo using HCC cell lines. We found that SMOC2 overexpression significantly reduced cell proliferation, as indicated by colony formation and proliferation assays. Additionally, SMOC2 overexpression significantly suppressed the migration and invasion abilities of the HCC cell lines. Furthermore, SMOC2 overexpression in HCC cells significantly delayed tumor growth and metastasis in mice. Although these in vitro and vivo results were in consistent with the clinicopathological findings that low SMOC2 expression was significantly associated with distant metastasis and a larger tumor volume, several conflicting observations in other kinds of cancer have previously been reported. Therefore, our future work will focus on investigating the potential reasons leading to different findings and outcomes.
Aberrant cell cycle regulation or defects in the mechanisms that induce programmed cell death (apoptosis) are strongly connected to the malignant proliferation of tumor cells [43, 44]. Therefore, we investigated whether the reduced proliferation observed in HCC cells overexpressing SMOC2 was linked to altered induction of apoptosis or cell cycle arrest. Overexpression of SMOC2 in HCC cell lines did not induce apoptosis. Consequently, we surmised that SMOC2 may inhibit HCC cell proliferation by inducing cell cycle arrest, and cell cycle analysis was employed to verify this hypothesis. Overexpression of SMOC2 significantly altered cell cycle distribution compared with vector control cells, indicating the growth-repressive effect observed in SMOC2-overexpressing cells was induced by cell cycle arrest at the G0/G1 phase.
As HCC is typically diagnosed at an advanced stage when therapeutic options have only modest efficacy, identification of novel and specific prognostic biomarkers for early stage HCC could provide significant benefit [45, 46]. Aberrant serum AFP levels are characteristic of HCC. At present, AFP is widely used as a tumor-specific serological diagnostic marker [47, 48]. However, fluctuating AFP levels can also reflect flares of HBV or HCV infection, exacerbation of underlying liver disease, pregnancy or the presence of germ cell tumors [49, 50]. In addition, the low sensitivity of AFP limits its use for the diagnosis and prognostication of HCC [51]. Subgroup analysis showed that patients with normal or low levels of AFP (≤ 25ng/mL) or other indicators of early-stage HCC demonstrating low levels of SMOC2 expression had poorer OS and a higher risk of recurrence. These results highlight the potential value of SMOC2 as a prognostic indicator in subgroups of patients with the clinicopathologic features of early-stage HCC. Moreover, we advocate that adjuvant therapy and more stringent follow-up after surgery may be required for patients with low SMOC2 expression, even though these patients may be classified as low-risk on the basis of conventional clinicopathologic features for HCC.
In conclusion, our present work demonstrated that SMOC2 was downregulated in human HCC and high SMOC2 expression was significantly associated with more favorable prognosis after surgery. Additionally, in vitro analysis indicated that SMOC2 exhibited tumor suppressor activity by inhibiting cell cycle-modulated HCC cell proliferation and also influenced several cellular functions that are intimately linked to tumor aggressiveness. Taken together, this study indicated that SMOC2 could play an important role in the development of HCC and may represent an effective prognostic indicator and a novel therapeutic target for HCC.
Abbreviations
SMOC2: Secreted modular calcium binding protein-2; HCC: hepatocellular carcinoma; CRC: colorectal cancer; SPARC protein family: secreted protein acidic and rich in cysteines protein family; TNM: tumor-node-metastasis; GAPDH: glyceraldehyde-3-phosphate dehydrogenase; RIPA: Radio-Immunoprecipitation Assay; HRP: horseradish peroxidase; PBST: phosphate buffered saline with tween 20; PBS: phosphate-buffered saline; OS: overall survival; DFS: disease-free survival; SDS-PAGE: sodium dodecyl sulfate polyacrylamide gel electrophoresis; PVDF: polyvinylidene fluoride; CFE: colonyforming efficiency; SD: standard deviation; LV-SMOC2: recombinant lentiviruses overexpressing SMOC2; LV-NC: recombinant lentiviruses negative control vector; PI: propidium iodide.
Acknowledgements
This work was primarily supported by grants from the National Natural Science Foundation of China (No. 81472387), National Natural Science Foundation of China (No. 81402560).
Competing Interests
The authors have declared that no competing interest exists.
References
1. Torre LA, Bray F, Siegel RL. et al. Global Cancer Statistics, 2012. CA Cancer J Clin. 2015;65:87-108
2. El-Serag HB. Epidemiology of Viral Hepatitis and Hepatocellular Carcinoma. Gastroenterology. 2012;142:1264-1273
3. Ferlay J, Soerjomataram I, Dikshit R. et al. Cancer incidence and mortality worldwide: sources, methods and major patterns in GLOBOCAN 2012. Int J Cancer. 2015;136:359-386
4. Thomas MB, Zhu AX. Hepatocellular carcinoma: the need for progress. Journal of clinical oncology: official journal of the American Society of Clinical Oncology. 2005;23:2892-2899
5. Llovet JM, Ducreux M, Lencioni R. et al. EASL-EORTC clinical practice guidelines: management of hepatocellular carcinoma. Journal of Hepatology. 2012;56:908-943
6. Siegel RL, Ma J, Zou Z, Jemal A. Cancer Statistics, 2014. CA Cancer J Clin. 2014;64:9-29
7. Siegel RL, Miller KD, Jemal A. Cancer statistics, 2016. CA Cancer J Clin. 2016;66:7-30
8. Hsu CY, Liu PH, Hsia CY. et al. Surgical Resection is Better than Transarterial Chemoembolization for Patients with Hepatocellular Carcinoma Beyond the Milan Criteria: A Prognostic Nomogram Study. Ann Surg Oncol. 2016;23:994-1002
9. Wang Y, Chen CL, Pan QZ. et al. Decreased TPD52 expression is associated with poor prognosis in primary hepatocellular carcinoma. Oncotarget. 2016;7:6323-34
10. Scaggiante B, Kazemi M, Pozzato G. et al. Novel hepatocellular carcinoma molecules with prognostic and therapeutic potentials. World J Gastroenterol. 2014;20:1268-1288
11. Vannahme C, Gosling S, Paulsson M. et al. Characterization of SMOC-2, a modular extracellular calcium-binding protein. Biochem J. 2003;373:805-814
12. Kaleağasıoğlu F, Berger MR. SIBLINGs and SPARC families: Their emerging roles in pancreatic cancer. World J Gastroenterol. 2014;20:14747-14759
13. Steinemann D, Gesk S, Zhang Y. et al. Identification of candidate tumor-suppressor genes in 6q27 by combined deletion mapping and electronic expression profiling in lymphoid neoplasms. Genes Chromosomes Cancer. 2003;37:421-426
14. Acquati F, Possati L, Ferrante L. et al. Tumor and metastasis suppression by the human RNASET2 gene. Int J Oncol. 2005;26:1159-68
15. Bignone PA, Lee KY, Liu Y. et al. RPS6KA2, a putative tumour suppressor gene at 6q27 in sporadic epithelial ovarian cancer. Oncogene. 2007;26:683-700
16. Bloch-Zupan A, Jamet X, Etard C. et al. Homozygosity mapping and candidate prioritization identify mutations, missed by whole-exome sequencing, in SMOC2, causing major dental developmental defects. Am J Hum Genet. 2011;89:773-781
17. Liu P, Lu J, Cardoso WV, Vaziri C. The SPARC-related factor SMOC-2 promotes growth factor-induced cyclin D1 expression and DNA synthesis via integrin-linked kinase. Mol Biol Cell. 2008;19:248-261
18. Rocnik EF, Liu P, Sato K. et al. The novel SPARC family member SMOC-2 potentiates angiogenic growth factor activity. J Biol Chem. 2006;281:22855-64
19. Liu P, Pazin DE, Merson RR. et al. The Developmentally-Regulated Smoc2 Gene Is Repressed by Aryl-hydrocarbon Receptor (Ahr) Signaling. Gene. 2009;433:72-80
20. Guezguez A, Paré F, Benoit YD. et al. Modulation of stemness in a human normal intestinal epithelial crypt cell line by activation of the WNT signaling pathway. Exp Cell Res. 2014;322:355-364
21. Maier S, Paulsson M, Hartmann U. The widely expressed extracellular matrix protein SMOC2 promotes keratinocyte attachment and migration. Exp Cell Res. 2008;314:2477-2487
22. Menendez L, Walker D, Matyunina LV. et al. Identification of candidate methylation-responsive genes in ovarian cancer. Mol Cancer. 2007;6:1-9
23. Vincent A, Omura N, Hong SM. et al. Genome-wide analysis of promoter methylation associated with gene expression profile in pancreatic adenocarcinoma. Clin Cancer Res. 2011;17:4341-4354
24. Ahn WS, Kim KW, Bae SM. et al. Targeted cellular process profiling approach for uterine leiomyoma using cDNA microarray, proteomics and gene ontology analysis. Int J Exp Path. 2003;84:267-279
25. Lee CH, Kuo WH, Lin CC. et al. MicroRNA-Regulated Protein-Protein Interaction Networks and Their Functions in Breast Cancer. Int J Mol Sci. 2013;14:11560-11606
26. DeVilliers P, Suggs C, Simmons D. et al. Microgenomics of Ameloblastoma. J Dent Res. 2011;90:463-469
27. Finn SP, Smyth P, Cahill S. et al. Expression microarray analysis of papillary thyroid carcinoma and benign thyroid tissue: emphasis on the follicular variant and potential markers of malignancy. Virchows Arch. 2007;450:249-260
28. L'Espérance S, Popa I, Bachvarova M. et al. Gene expression profiling of paired ovarian tumors obtained prior to and following adjuvant chemotherapy: Molecular signatures of chemoresistant tumors. Int J Oncol. 2006;29:5-24
29. Shvab A, Haase G, Ben-Shmuel A. et al. Induction of the intestinal stem cell signature gene SMOC-2 is required for L1-mediated colon cancer progression. Oncogene. 2016;35:549-557
30. Murphy-Ullrich JE, Sage EH. Revisiting the matricellular concept. Matrix Biol. 2014;37:1-14
31. Pazin DE, Albrecht KH. Developmental Expression of Smoc1 and Smoc2 Suggests Potential Roles in Fetal Gonad and Reproductive Tract Differentiation. Dev Dyn. 2009;238:2877-2890
32. Wu T, Ouyang G. Matricellular proteins: multifaceted extracellular regulators in tumor dormancy. Protein Cell. 2014;5:249-252
33. Wong GS, Rustgi AK. Matricellular proteins: priming the tumour microenvironment for cancer development and metastasis. Br J Cancer. 2013;108:755-761
34. Chong HC, Tan CK, Huang RL, Tan NS. Matricellular proteins: a sticky affair with cancers. J Oncol. 2012;2012:351089
35. Atorrasagasti C, Malvicini M, Aquino JB. et al. Overexpression of SPARC obliterates the in vivo tumorigenicity of human hepatocellular carcinoma cells. Int J Cancer. 2010;126:2726-2740
36. Xiang Y, Qiu Q, Jiang M. et al. SPARCL1 suppresses metastasis in prostate cancer. Mol Oncol. 2013;7:1019-1030
37. Sullivan MM, Sage EH. Hevin/SC1, a matricellular glycoprotein and potential tumor-suppressor of the SPARC/BM-40/Osteonectin family. Int J Biochem Cell Biol. 2004;36:991-996
38. Torrente A, Lukk M, Xue V. et al. Identification of Cancer Related Genes Using a Comprehensive Map of Human Gene Expression. PLoS One. 2016;11:e0157484
39. Gu X, Li B, Jiang M. et al. RNA sequencing reveals differentially expressed genes as potential diagnostic and prognostic indicators of gallbladder carcinoma. Oncotarget. 2015;6:20661-20671
40. Fidalgo F, Rodrigues TC, Pinilla M. et al. Lymphovascular invasion and histologic grade are associated with specific genomic profiles in invasive carcinomas of the breast. Tumor Biol. 2015;36:1835-1848
41. Hyakusoku H, Sano D, Takahashi H. et al. JunB promotes cell invasion, migration and distant metastasis of head and neck squamous cell carcinoma. J Exp Clin Cancer Res. 2016;35:6
42. Brady JJ, Chuang CH, Greenside PG. et al. An Arntl2-Driven Secretome Enables Lung Adenocarcinoma Metastatic Self-Sufficiency. Cancer Cell. 2016;29:697-710
43. Zhang X, Zhong L, Liu BZ. et al. Effect of GINS2 on Proliferation and Apoptosis in Leukemic Cell Line. Int J Med Sci. 2013;10:1795-1804
44. Reed JC. Apoptosis-targeted therapies for cancer. Cancer Cell. 2003;3:17-22
45. Scaggiante B, Kazemi M, Pozzato G. et al. Novel hepatocellular carcinoma molecules with prognostic and therapeutic potentials. World J Gastroenterol. 2014;20:1268-1288
46. Li T, Fan J, Qin LX. et al. Risk factors, prognosis, and management of early and late intrahepatic recurrence after resection of primary clear cell carcinoma of the liver. Ann Surg Oncol. 2011;18:1955-1963
47. Trevisani F, D'Intino PE, Morselli-Labate AM. et al. Serum alpha-fetoprotein for diagnosis of hepatocellular carcinoma in patients with chronic liver disease: influence of HBsAg and anti-HCV status. J Hepatol. 2001;34:570-575
48. Peng SY, Chen WJ, Lai PL. et al. High alpha-fetoprotein level correlates with high stage, early recurrence and poor prognosis of hepatocellularcarcinoma: significance of hepatitis virus infection, age, p53 and beta-catenin mutations. Int J Cancer. 2004;112:44-50
49. Di Bisceglie AM, Sterling RK, Chung RT. et al. Serum alpha-fetoprotein levels in patients with advanced hepatitis C: results from the HALT-C Trial. J Hepatol. 2005;43:434-441
50. Chalasani N, Horlander JC Sr, Said A. et al. Screening for hepatocellular carcinoma in patients with advanced cirrhosis. Am J Gastroenterol. 1999;94:2988-2993
51. Yamashita T, Forgues M, Wang W. et al. EpCAM and alpha-fetoprotein expression defines novel prognostic subtypes of hepatocellular carcinoma. Cancer Res. 2008;68:1451-1461
Author contact
![]() Corresponding authors: Jian-chuan Xia, MD, PhD. State Key Laboratory of Oncology in Southern China, Sun Yat-sen University Cancer Center, 651 Dong-feng Road East, Guangzhou, 510060, China, Tel: +86-20-87343173, Fax: +86-20-87343392, email: xiajchsysu.edu.cn; Jian-Hua Zhang, Department of Health Service Management, Guangzhou University of Chinese Medicine, 232 Wai-huan Road East, Guangzhou, 510006, China, Tel: +86-20-39358999, Fax: +86-20-39358999, email: zhangjh1962com.
Corresponding authors: Jian-chuan Xia, MD, PhD. State Key Laboratory of Oncology in Southern China, Sun Yat-sen University Cancer Center, 651 Dong-feng Road East, Guangzhou, 510060, China, Tel: +86-20-87343173, Fax: +86-20-87343392, email: xiajchsysu.edu.cn; Jian-Hua Zhang, Department of Health Service Management, Guangzhou University of Chinese Medicine, 232 Wai-huan Road East, Guangzhou, 510006, China, Tel: +86-20-39358999, Fax: +86-20-39358999, email: zhangjh1962com.