Impact Factor ISSN: 1837-9664

 Global reach, higher impact
J Cancer 2017; 8(17):3555-3566. doi:10.7150/jca.20952 This issue Cite
Research Paper
ZEB1 Promotes Oxaliplatin Resistance through the Induction of Epithelial - Mesenchymal Transition in Colon Cancer Cells
Cao Guo1, 2, Junli Ma1, 3, Ganlu Deng1, 3, Yanlin Qu1, 3, Ling Yin1, 3, Yiyi Li1, 3, Ying Han1, 3, Changjing Cai1, 3, Hong Shen1, 2, 3, Shan Zeng1, 2, 3 ![]()
1. Institute of Medical Sciences, Xiangya Hospital, Central South University, Changsha, Hunan, China 410008;
2. Key Laboratory for Molecular Radiation Oncology of Hunan Province, Xiangya Hospital, Central South University, Changsha, Hunan, China 410008;
3. Department of Oncology, Xiangya Hospital, Central South University, Changsha, Hunan, China 410008.
Received 2017-5-10; Accepted 2017-9-1; Published 2017-9-30
Abstract
Background: Oxaliplatin (OXA) chemotherapy is widely used in the clinical treatment of colon cancer. However, chemo-resistance is still a barrier to effective chemotherapy in cases of colon cancer. Accumulated evidence suggests that the epithelial mesenchymal transition (EMT) may be a critical factor in chemo-sensitivity. The present study investigated the effects of Zinc finger E-box binding homeobox 1 (ZEB1) on OXA-sensitivity in colon cancer cells.
Method: ZEB1expression and its correlation with clinicopathological characteristics were analyzed using tumor tissue from an independent cohort consisting of 118 colon cancer (CC) patients who receiving OXA-based chemotherapy. ZEB1 modulation of OXA-sensitivity in colon cancer cells was investigated in a OXA-resistant subline of HCT116/OXA cells and the parental colon cancer cell line: HCT116. A CCK8 assay was carried out to determine OXA-sensitivity. qRT-PCR, Western blot, Scratch wound healing and transwell assays were used to determine EMT phenotype of colon cells. ZEB1 knockdown using small interfering RNA (siRNA) was used to determine the ZEB1 contribution to OXA-sensitivity in vitro and in vivo (in a nude mice xenograft model).
Result: ZEB1 expression was significantly increased in colon tumor tissue, and was correlated with lymph node metastasis and the depth of invasion. Compared with the parental colon cancer cells (HCT116), HCT116/OXA cells exhibited an EMT phenotype characterized by up-regulated expression of ZEB1, Vimentin, MMP2 and MMP9, but down-regulated expression of E-cadherin. Transfection of Si-ZEB1 into HCT116/OXA cells significantly reversed the EMT phenotype and enhanced OXA-sensitivity in vitro and in vivo.
Conclusion: HCT116/OXA cells acquired an EMT phenotype. ZEB1 knockdown effectively restored OXA-sensitivity by reversing EMT. ZEB1 is a potential therapeutic target for the prevention of OXA-resistance in colon cancer.
Keywords: Colon cancer, Zinc finger E-box binding homeobox 1, Oxaliplatin, Chemo-resistance, Epithelial-mesenchymal transition.
Introduction
Globally colon cancer (CC) has the third highest rate of malignancy, which is associated with a high rate of mortality. In over one-third of patients with CC will evolve into metastatic disease with a five-year survival rate of only ~ 10% [1]. Chemotherapy using the third generation platinum drug oxaliplatin (OXA) improves overall survival (OS) for advanced or metastatic CC patients [2]. Unfortunately, OXA-resistance is still a major factor in the poor prognosis associated with advanced CC. Despite numerous attempts to understand the mechanism(s) of OXA-resistance, which have focused on drug effluxes, drug target mutation, DNA damage repair and the cell death escape. OXA-sensitivity has not been effectively improved yet in colon cancer [3].
We have evidence indicating that epithelial mesenchymal transition (EMT) is closely involved in chemo-resistance. Malignant cells undergoing EMT acquire migration and drug resistance characteristics [4, 5]. Stimulating EMT by up-regulating Nestin expression enhances chemo-resistance in hepatocellular cancer [6]. Most importantly, we recently found that EMT regulates cell invasion and OXA-sensitivity via the Snail pathway in hepatocellular cancer cells [7]. EMT is a process characterized by: (i) the absence of polarity and intercellular adhesion of epithelial cells, and (ii) the acquisition of mesenchyme features associated with higher motility, and (iii) the altered expression of EMT biomarkers (down-regulation of epithelial marker E-cadherin, and up-regulation of the mesenchymal marker Vimentin) [8, 9]. EMT is also associated with cancer stemness properties, including self‑renewing and multi-directional differentiation potential, which promotes drug resistance [10, 11]. The degradation of extracellular matrix (ECM) by secretory enzymes is evidence of EMT progression; Degradation of ECM promotes cell expansion and cell mobility in a matrix metalloproteinase (MMP) dependent manner [12].
A set of transcriptional factors are reportedly involved in the occurrence of EMT [9, 13]. For example, Snail, ZEB, Twist and Slug transcription factor families may be important modulators of EMT, through direct binding of the E-box region of E-cadherin promoter, resulting in repression of E-cadherin transcription [14, 15]. ZEB1 reportedly participates in embryonic formation and cell differentiation. Recent studies suggest that ZEB1 is involved in triggering the occurrence of EMT and is associated with poor prognosis in cases of human carcinoma [16, 17]. However, the role(s) of ZEB1 in EMT regulation and OXA-resistance remain to be elucidated.
The aim of this study is to investigate the role(s) of ZEB1 in OXA-resistance related to EMT in colon cancer, which may reveal novel strategies for defeating OXA-resistance.
Materials and Methods
Chemicals and drugs
OXA was purchased from Selleck Chemicals (Huston, TX) and was diluted with DMSO (Sigma, St Louis, MO) and stored at the concentration of 10 mM. The primary antibodie against ZEB1 was purchased from Sigma. The primary antibodies against E-cadherin, Vimentin, Snail and Slug were purchased from Cell Signaling Technology (CST, Danvers, MA). The primary antibodies against Twist, MMP2, MMP9, Caspase-3 and Bcl-2 were purchased from Abcam (Cambridge, MA, UK).
Patients and follow-up
A total of 118 pairs of colon tumor tissues and adjacent non-tumorous tissues (paraffin-embedded tissues) were randomly collected from advanced stage IV colon cancer patients between January 2009 and March 2015 in Human Important Disease Specimen Bank of Xiangya Hospital (Central South University, Changsha, Hunan, China). Among which, those paired sample were collected by enteroscopy biopsy or exploratory laparotomy biopsy. And those patients were received OXA-based (FOLFOX) chemotherapy regimens for six months at minimum after diagnosed. FOLFOX4 regimen : (OXA 85 mg/m2 i.v. on day 1; LV 200 mg/m2 i.v. 2 hours on days 1 and 2; and FU 400 mg/m2 i.v. bolus at hour 2, then 600 mg/m2 over 22 hours on days 1 and 2, once every 2 weeks).
The study complied with the Declaration of Helsinki and approved by the Ethics Committees of Xiangya hospital. Clinical follow-up data were obtained from the patients through telephone inquiry and outpatient clinic visit. Follow-up was terminated on September 2016. The follow-up period was defined as the interval between the date of diagnosis and that of the patient's death or the last follow-up. Follow-up time ranged from 1 to 18 months. The data of deaths from other causes and the surviving patients at the last follow-up were all censored. OS was defined as the time quantum from diagnosis to death or status on the last inquiry, while progression-free survival (PFS) was defined as the time interval between the first time of chemotherapy and the first evidence of recurrence.
Cell culture
The human normal epithelial colon cell line NCM460 was purchased from Xiangya cell bank (Central South University, Changsha, China). The human colon cancer cell line HCT116 was obtained from the Institutes of Biomedical Sciences (IBS, Shanghai, China), and HCT116/OXA cells with OXA resistance were purchased from the corporation of MEIXUAN Biological Science & Technology (Shanghai, China). Cells were cultured in 25-cm2 flasks in RPMI-1640 (Gibico, Grand Island, NY) supplemented with 10% fetal bovine serum (FBS), 100 U/mL penicillin sodium and 100 μg/mL streptomycin sulfate (Hyclone, Logan, UT) at 37 °C in a 5% CO2 atmosphere.
Chemo-sensitivity assay
Chemo-sensitivity was measured using Cell Counting Kit-8 (CCK-8, Dojindo Molecular Technologies, Tokyo, Japan). The cells were seeded at a concentration of 1.0 × 10⁴ cells/well in a 96-well plate and grown in RPMI-1640. 24 hrs later, OXA was added to the culture medium at ten different final concentrations: 0, 1.25, 2.5, 5, 10, 20, 40, 80, 160 and 320 μM. After 48 hours of OXA treatment, 10 μl of CCK8 reagent was added per well and the plate was incubated at 37℃ for 1 h. We measured OD values for each well (wavelength: 450 nm). All assays were performed in triplicate.
Colony formation assays
To identify the proliferation of colon cancer cells, HCT116 and HCT116/OXA cells were seeded in 6-well plates at a density of 1 × 10³ cells/ well and cultured in standard culture media without OXA treatment. The media was replaced every 3 days. After being incubated for two weeks, the cells were fixed with paraformaldehyde and then stained with 0.1% crystal-violet for 20 minutes at room temperature; cell colonies with > 50 cells were counted.
Invasion and migration assays
Invasion chambers (BD Biosciences, San Jose, CA) were used to determine the invasiveness of colon cancer cells. The cells were harvested after 12 hours in serum-free medium. At a density of 5 × 10³ cells/well, cells were transferred to the matrigel chambers along with 200μl of serum-free medium in the upper chamber and 600μl of standard medium in the bottom chamber. After 48 hours incubation, the cells in the upper chamber were discarded, and the invaded cells were fixed with 4% paraformaldehyde and stained with 0.1% crystal violet for 20 mins. The images were captured using a Leica DMI-4000B inverted microscope (Leica, Wetzlar, Germany) and the number of invaded cells was counted.
The scratch wound-healing assay was performed to detect the migration abilities of colon cancer cells. The cells were seeded into 6-well plates, and scratches were made using a 200-μl pipette tip. Floating cells were discarded. Cells were cultured continuously for 48 hrs. Cell images were captured using an inverted microscope (Leica DMI-4000B), and migration distances were calculated using LAS V4.0 software (Leica).
Flow cytometry
Cells were treated with or without OXA for 48 hrs and then stained with Annexin V-FITC and propidium iodide (PI) according to the manufactures' instructions (BD Biosciences). A FACS Canto II flow cytometer (BD Biosciences) was used to measure apoptosis rate.
RNA interference
Three candidate small interfering RNA (SiRNA) targeting human ZEB1 (GenBank Accession NO.: NC_000010.11) were chemically synthesized by Sangon Biotech (Shanghai, China). The SiRNA oligonucleotide sequences are as follows: SiRNA1: sense 5′-CCUAGUCAGCCACCUUUAATT-3′; antisense 5′-UUA AAGGUGGCUGACUAGGTT-3′; SiRNA2: sense 5′-GGAUCAACCACCAA UGGUUTT-3′, antisense 5′-AACCAUUGGUGGUUGAUCCTT-3′; SiRNA3: sense5′-GCAACAGGGAGAAUUAUUATT-3′, antisense 5′-UAAUAAUUCUC CCUGUUGCTT-3′; the control SiRNA not targeting any annotated human genes: sense 5′-UUCUCCGAACGUGUCACGUTT-3′; antisense 5′-ACGUGACACG UUCGGAGAATT-3′. HCT116/OXA cells were seeded in 6-well plates and transfected with Si-ZEB1 at a final concentration of 50 nM using Lipofectamine 2000 (Life Technologies, Carlsbad, CA) according to the protocol supplied by the manufacturer. The best candidate SiRNA (SiRNA1) was selected following qRT-PCR and Western blot analyses.
Lentivirus infection
For the purpose of exploring the role of ZEB1 in vivo, a ZEB1-RNAi lentiviral vector (GV112-ZEB1) was constructed by GeneChem (Shanghai, China). Viral titers of Si-ZEB1 and Si-control lentivirus were 1×10⁸ TU/ml. Si-ZEB1 lentivirus was transfected into the HCT116/OXA cells with an optimal infection (MOI) of 30 TU/ml.
Quantitative real-time PCR (qRT-PCR)
mRNA was isolated from cells using TRIzol reagent (Invitrogen, Waltham, MA). The first strand of cDNA was synthetized from 1 μg of total RNA using PrimeScript™ Kit (TaKaRa, Tokyo, Japan) according to the manufacturer's instructions. RT-PCR was performed on a ViiATM7 system (Applied Biosystems, CA) with the All-in-One™ qPCR Mix (Genecopoeia, Guangzhou, China). The primer pairs were synthesized by Sangon Biotech and are as follows: ZEB1, forward 5′-AAGTGGCGGTAGATGGTA-3′ and reverse 5′-TTGTA GCGACTGGATTTT-3′; Snail, forward 5′-CCCCACAGGACTTTGATG-3′ and reverse 5′-AAACAGGAGGCTGAAATAGC-3′; Slug forward 5′-GGGCTCAGTTC GTAAAGG-3 ′and reverse 5′-GAGGAGGTGTCAGATGGA-3′; Twist 5′-TTTACATCCGATTTACTGC-3′ and reverse 5′-CCTAATGCTTTCCCTCAT-3′; E-cadherin forward 5′-CGAGAGCTACACGTTCACGG-3′ and reverse 5′-GGGTGTCGAGGGAAAAATAGG-3′; Vimentin forward 5′-GACGCCATCAACACCGAGTT-3′ and reverse 5′-CTTTGTCGTTGGTTAGCTGGT-3′; MMP2 forward 5′-TACAGGATCATTGGCTACACACC-3′ and reverse 5′-GGTCACATCGCTCCAGACT-3′; MMP9, forward 5′-TGTACCGCTATGGTTACACTCG-3′ and reverse 5′-GGCAGGGACAGTTGCTTCT-3′; GAPDH, forward 5′-GCACCGTCAAGGCTGAGAAC-3′ and reverse 5′-TGGTGAAGACGCCAGTGGA-3′. GAPDH was used as the unified internal control. Relative mRNA expression levels were calculated by the formula 2-ΔCt [ΔCt = Ct (target gene) - Ct (GAPDH)].
Western blot
40 μg of the total protein was separated from the cells by 10% SDS-PAGE and transferred to PVDF membranes (Millipore, MA). After being blocked in TBS-T containing 5% skim milk at 37°C for 2 hrs, the membranes were respectively incubated overnight at 4°C with the primary antibodies and were subsequently incubated with the secondary antibodies for 1h at room temperature. The immunoreactive bands were visualized using a ChemiDoc XRS+ system (Bio-Rad, Hercules, CA) and quantitative analysis was performed with Image Lab software (Bio-Rad). GAPDH was used as a loading control.
Immunofluorescence (IF)
IF was performed so as to observe the expression of EMT biomarkers on colon cancer cells. In brief, cells were grown on glass coverslips overnight, then fixed with 4% paraformaldehyde and blocked with 5% normal goat serum. The fixed cells were incubated with the primary antibodies, rabbit anti-E-cadherin (1:200), and mouse anti-Vimentin (1:400) at 4℃ overnight. Subsequently, cells were incubated with Alexa Fluor 546 or Alexa 488-conjugated secondary antibody (1:400, Life Technologies) for 1 h at room temperature. Finally DAPI was added for 3 minutes to stain the nuclei. DM-5000B fluorescence microscopy (Leica) was used for image capture.
Xenograft models
To investigate the role of ZEB1 on OXA-resistance of colon cancer cells in vivo, we used a xenograft animal model (immunodeficient BALB/c nude mice; 4 weeks old, male, 18.0 ± 2.0 g). Si-ZEB1 lentivirus and the negative control lentivirus (Si-NC) were transfected into 5 × 10⁶ HCT116/OXA cells respectively. Those cells were then suspended in 0.15 ml of serum-free culture medium and subcutaneously injected into the right anterior armpit of mice. Starting a week later, mice were subcutaneously injected with OXA (0.8 mg/kg/w) for a period of 4 weeks. Mice received intravenous injections of MMPSense™ 750 FAST fluorescent imaging agent (PerkinElmer, Boston, MA). 6 h later, mice were imaged by Fluorescence Molecular Tomography (FMT-4000, PerkinElmer) to measure MMP activity in vivo. All treatment of animals was in strict accordance with the guidelines of the Animal Center of Central South University, and all animal experimental procedures were approved by the Experimental Animal Ethical Committee of Central South University.
Immunohistochemistry (IHC) and the TdT-mediated dUTP-biotin nick end labeling (TUNEL) assays
Tumor tissues derived from colon cancer xenograft tumors were fixed in 10% formalin, dehydrated, and embedded in paraffin. 4μm-thick sections were then stained for Ki67 (1:200, CST), E-cadherin (1:200, Abcam), Vimentin (1:400, Abcam), and ZEB1 (1:500, Sigma). The IHC staining was scored according to the percentage of positive-staining cells and staining intensity as previously described [18].
TUNEL assay was used to identify ZEB1 involvement in apoptosis of CC cells derived from xenograft tumor tissues using a TUNEL assay kit purchased from Roche Applied Science (Mannheim, Germany). Glass containing tumor tissue was washed with 1×PBS and fixed with 4% paraformaldehyde for 1h. Fixed cells were permeabilized, and then incubated with TdT and DAB-labeled dUTP. Images were captured using a DM-5000B microscopy (Leica).
Statistical Analysis
Data is presented as the mean ± SD. Statistical analysis was performed using GraphPad Prism software (Version 5.01, GraphPad Software Inc, San Diego, CA). ZEB1 expression and the clinicopathological characteristics of colon cancer were compared using χ2 test. The cumulative OS and PFS Survival curves were calculated using Kaplan-Meier method and Log-rank test. Cox proportional hazards regression model was established to identify the predictive factors that independently affected the prognosis of colon cancer. Student's t-tests were used to compare differences between two groups, unless otherwise specified. All the tests were two-sided and differences were considered to be statistically significant when the P value was calculated to be < 0.05.
Results
ZEB1 overexpressed in tumor tissue was significantly correlated with colon cancer prognosis
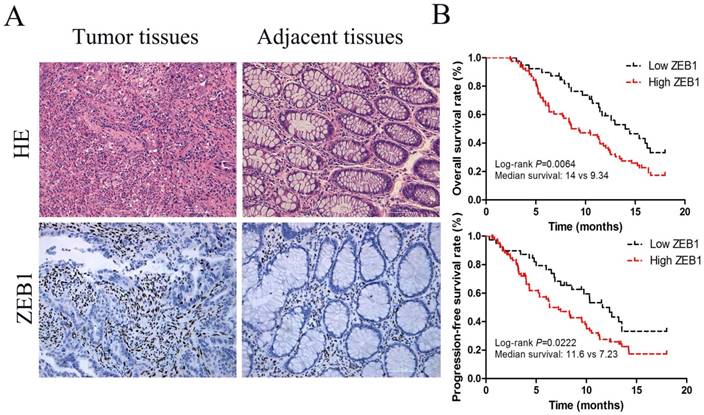
ZEB1 protein expression was located in nucleus (Figure 1A) and associated with lymph node metastasis and the depth of invasion tumors (p<0.05, Table 1). Based on IHC staining intensity, 33.1% (39/118) and 66.9% (79/118) cases were respectively defined as low and high ZEB1 protein expression in 118 colon cancer specimens (Table 1). Median PFS in these two groups were 11.6 months (95% CI, 9.34-11.91) and 7.23 months (95% CI, 7.10-9.18) respectively (p=0.0222; Figure 1B).The median OS tended to be longer in patients with low ZEB1 expression, 14.0 months (95% confidence interval [CI], 11.63-14.97), compared with 9.34 months (95% CI, 8.34-11.04) in patients with high ZEB1 expression (p=0.0064; Figure 1B).
ZEB1 expression served as a poor prognosis for colon cancer. (A) HE and IHC staining of ZEB1 protein expression in colon cancer tissues and adjacent non-tumorous tissue (Original magnification: ×200). (B) Survival curves, which were evaluated by the log-rank test, indicated PFS and OS of colon cancer patients with high or low ZEB1 expression in the independent cohort (n=118).
The relationship between the ZEB1 protein expression and clinicopathological features in colon cancer
| Clinicopathological features | n | ZEB1 expression (118) | |||
|---|---|---|---|---|---|
| High (79) | Low (39) | P | |||
| Age (years) | ≤60 | 58 | 38 | 20 | 0.448 |
| >60 | 60 | 41 | 19 | ||
| Sex | Male | 62 | 42 | 20 | 0.501 |
| Female | 56 | 37 | 19 | ||
| Tumor size (mm) | ≤50 | 72 | 47 | 25 | 0.391 |
| >50 | 46 | 32 | 14 | ||
| Location | Proximal | 57 | 35 | 22 | 0.149 |
| Distal | 61 | 44 | 17 | ||
| Depth of invasion | T1-2 | 86 | 55 | 31 | 0.013 |
| T3-4 | 32 | 24 | 8 | ||
| Differentiation | Well-Mod | 85 | 53 | 32 | 0.066 |
| Poor | 33 | 26 | 7 | ||
| Lymph node metastasis | N0 N1-N2 | 42 76 | 23 56 | 19 20 | 0.030 |
| CEA (μg/μL) | ≤5 | 79 | 53 | 26 | 0.561 |
| >5 | 39 | 26 | 13 | ||
A multivariable Cox proportional hazards model constructed in the independent cohort found that ZEB1 expression was independent prognostic factors for PFS in CC patients (HR=1.542, p=0.023) and OS (hazard ratio [HR]=1.588, p=0.016, Table 2).
Multivariate Analysis by a Cox Proportional Hazards Regression Model in Colon Cancer
| Clinicopathological variables | PFS | OS | |||
|---|---|---|---|---|---|
| HR(95% CI) | P | HR(95% CI) | P | ||
| Age (≤60 vs. >60) | 0.0368(0.017-0.942) | 0.266 | 0.034(0.013-0.847) | 0.143 | |
| Sex (Male vs. Female) | 0.275(0.033-2.288) | 0.232 | 0.229(0.033-2.266) | 0.229 | |
| Tumor size (mm) (≤60 vs. >60) | 0.617(0.200-1.905) | 0.493 | 0.415(0.203-1.933) | 0.415 | |
| Location (Proximal vs. Distal) | 1.220(0.772-1.927) | 0.395 | 1.232(0.780-1.946) | 0.362 | |
| Depth of invasion (T1-2 vs. T3-4) | 0.952(0.449-2.020) | 0.899 | 0.929(0.436-1.979) | 0.849 | |
| Differentiation (Well-Mod vs. Poor) | 1.072(0.289-3.980) | 0.917 | 0.992(0.269-3.659) | 0.532 | |
| Lymph node metastasis (N0 vs. N1-2) | 0.264(0.130-0.536) | <0.0001 | 0.299(0.143-0.628) | <0.0001 | |
| CEA (μg / μL) (≤5 vs. >5) | 1.354(0.304-6.028) | 0.691 | 1.377(0.310-6.113) | 0.674 | |
| ZEB1 expression (Low vs. High) | 1.542(0.839-2.832) | 0.023 | 1.588(0.953-2.646) | 0.016 | |
HCT116/OXA cells exhibited different OXA sensitivity and cell morphology relative to HCT116 parent cells
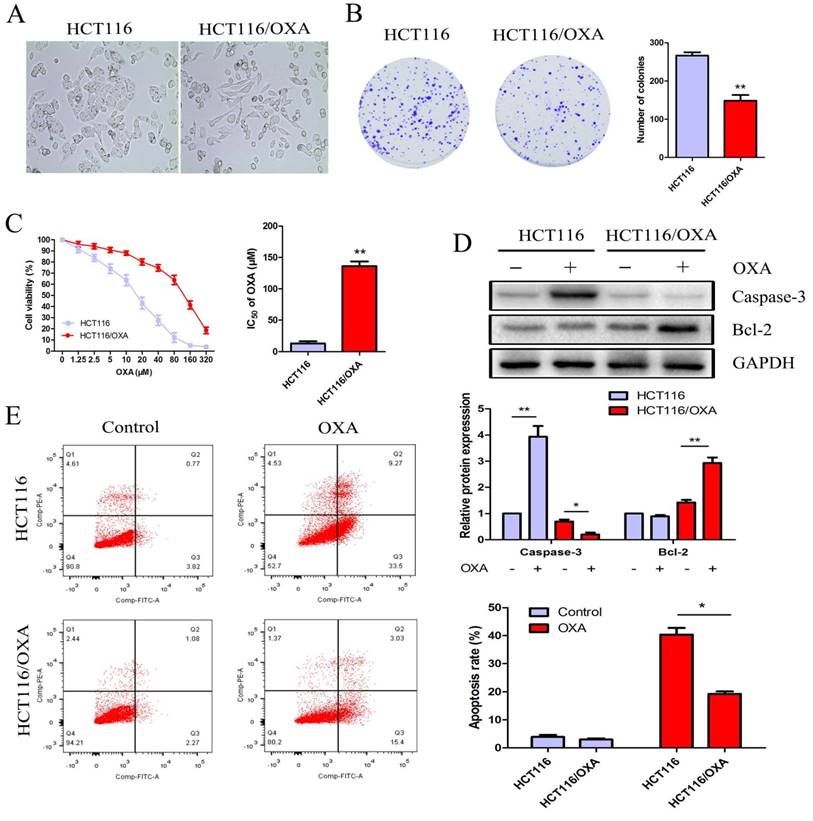
Relative to HCT116 cells, HCT116/OXA cells exhibited OXA resistance and morphological changes, which included the formation of pseudopodium and the development of a spindle-shaped appearance (Figure 2A). The colony formation assay showed that the proliferation capacity of HCT116/OXA cells without OXA treatment was weaker than that in parental cells (P < 0.01, Figure 2B). After being treated with OXA at different concentrations for 48 hrs, HCT116/OXA cells exhibited an IC50 value of 127.5 μM, while that of HCT116 cells was 16.95 μM (Figure 2C). Therefore, the OXA-resistant index of HCT116/OXA was found to be 7.52.
Proliferation and apoptosis of HCT116 and HCT116/OXA cells. (A) Morphological changes of HCT116/OXA cells: spindle-shape appearance and pseudopodium formation (Original magnification: × 400). (B) Proliferation abilities of HCT116 and HCT116/OXA cells tested by colony formation assays (P < 0.01). (C) CCK8 assay was carried out to identify IC50 values of HCT116 and HCT116/OXA cells to OXA. The drug index was calculated as: IC50 of OXA-resistant cells / IC50 of the parental cells. (D) The cells were treated with or without 17μM OXA for 48 hrs, the expression of apoptotic protein caspase-3, and anti-apoptotic protein Bcl-2 in HCT116 and HCT116/OXA cells evaluated by Western blot was normalized to the expression of GAPDH. (E) Apoptosis rates of colon cancer cells treated with or without OXA at 17 μM for 48 hrs were detected by flow cytometry with Annexin V / PI staining. All experiments were repeated in triplicate and the data were shown as mean ± SD. *: P < 0.05, **: P < 0.01.
OXA promoted cell apoptosis and suppressed CC cell' proliferation
HCT116 cells treated with OXA at the IC50 concentration of 17 μM exhibited increased expression of cleaved Caspase-3— a major mediator of cell death— in contrast with HCT116/OXA cells where expression was significantly down-regulated. The expression of Bcl-2— a major the mainly anti-apoptosis gene— was unchanged in HCT116 cells; while Bcl-2 expression was significantly elevated in HCT116/OXA cells (Figure 2D). Moreover, apoptosis rate was significantly increased in the case of HCT116 cells relative to that of HCT116/OXA cells (40.38 ± 3.39 vs. 19.28 ± 1.20%, P < 0.05, Figure 2E).
HCT116/OXA cells exhibited up-regulated ZEB1 and an EMT phenotype
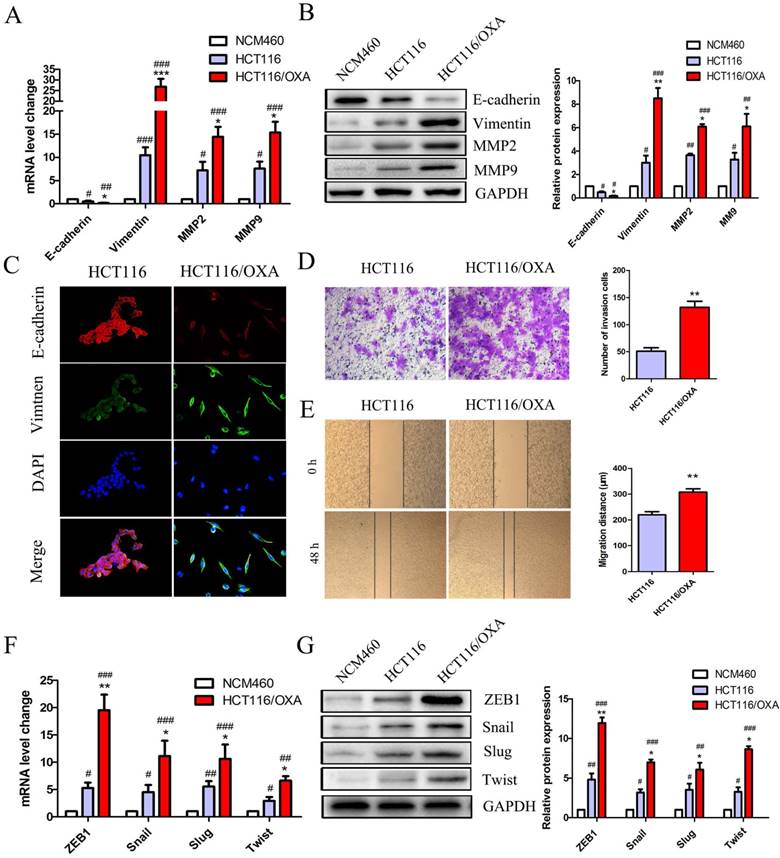
EMT plays a critical role in drug resistance. qRT-PCR and Western blot analyses indicated that HCT116/OXA cells displayed a greater EMT phenotype compared to HCT116 parent cells and normal colon epithelial cells (NCM460) as evidenced by a relative down-regulation of the epithelial biomarker E-cadherin and up-regulation of the mesenchyme biomarker Vimentin (Figure 3A & 3B). The EMT phenotype of HCT116/OXA cells was confirmed by IF staining (Figure 3C). Consistent with an EMT phenotype, HCT116/OXA cells exhibited increased ECM degradation as evidenced by heightened levels of MMP2 and MMP9 expression (Figure 3A & 3B). Meanwhile, EMT functional assays such as transwell and scratch wound healing assays revealed that HCT116/OXA cells had a higher capacity for invasion and migration relative to HCT116 cells (Figure 3D & 3E, P < 0.01, respectively). We also tested the expression of four vital EMT transcription factors Snail, ZEB1, Twist and Slug in HCT116 and HCT116/OXA cells. qRT-PCR and Western blot analyses showed that expression of these four EMT-TFs was increased in HCT116 and HCT116/OXA cells, as compared with NCM460 cells. And the expression of EMT-TFs in HCT116/OXA cells was higher than that in HCT116 cells (Figure 3F & 3G). Of these four EMT transcriptional factors (EMT-TFs) the expression of ZEB1 was the most elevated (Figure 3F & 3G), suggesting that ZEB1 may be a particularly important regulator of OXA-sensitivity in CC cells.
OXA-resistant cells (HCT116/OXA) exhibited up-regulated ZEB1 and an EMT phenotype. (A & B) Expression of epithelial biomarker (E-cadherin), mesenchymal biomarker (Vimentin) and matrix metalloproteinases (MMP2, MMP9) were measured by qRT-PCR and Western blot analyses. (C) Representative double immunofluorescence staining of the expression and co-localization of EMT biomarkers E-cadherin / Vimentin (Original magnification: ×400). (D) Transwell assays were used to determine the invasion capacity of HCT116/OXA and HCT116/OXA cells. Cells were starved for 12 hrs before being seeded into the matrigel chamber. (E) Scratch wound healing assays were used to test the migratory abilities of OXA-resistant cells and their parent colon cancer cells. (F & G) mRNA and protein expression of four EMT transcriptional factors (EMT-TFs): Snail, Slug, ZEB1 and Twist in normal colon epithelial cell and colon cancer cells. Compared to NCM460 group, #: P < 0.05, ##: P < 0.01, ###: P < 0.001. Compared to HCT116 group, *: P < 0.05, **: P < 0.01, ***: P < 0.001.
ZEB1 silencing increased apoptosis and rescued OXA-sensitivity in HCT116/OXA cells
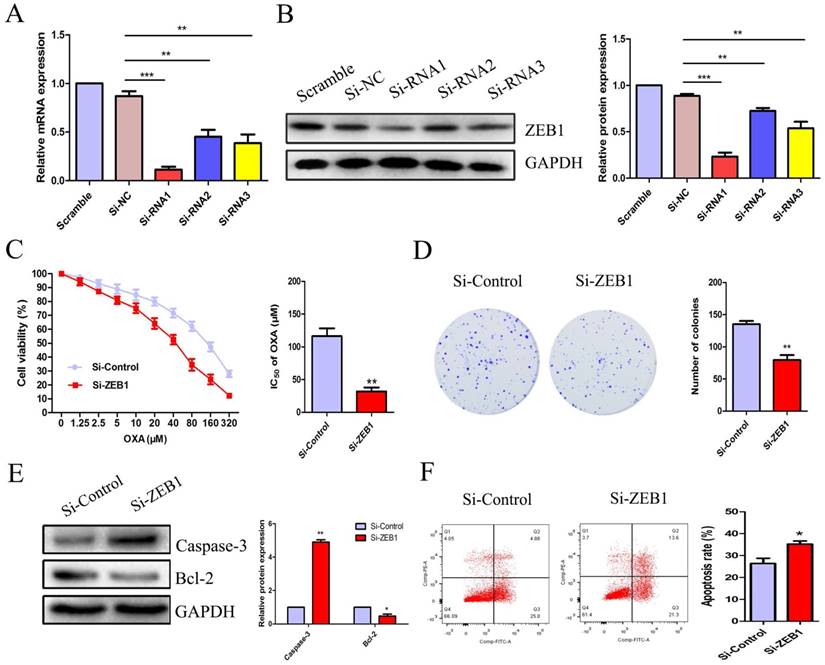
To explore the role of ZEB1 in CC cell OXA-resistance, we constructed three candidate pairs of ZEB1 SiRNA sequences. SiRNA1 targeting ZEB1 was confirmed as the most effective SiRNA sequence at blocking ZEB1 mRNA and protein expression (Figure 4A & 4B). The CCK8 assay demonstrated that knockdown of ZEB1 significantly reduced the IC50 of OXA in HCT116/OXA cells to 35.90 μM from 125.5 μM in the Si-control groups (Figure 4C, P < 0.01). Moreover, the colony formation assay indicated that Si-ZEB1 groups had a lower proliferation capacity than Si-control groups (Figure 4D, P < 0.01). In the Si-ZEB1 HCT116/OXA group treated with 36 μM OXA (IC50 concentration), ZEB1 silencing resulted in activation of cellular apoptosis pathways, as evidenced by significantly increased Caspase-3 expression and decreased expression of Bcl-2, relative to Si-control cells (Figure 4E). Flow cytometry results showed that ZEB1 depletion promoted CC cell apoptosis (Si-ZEB1 vs. Si-control: 35.21 ± 2.47% vs. 26.37 ± 4.18%, P < 0.05, Figure 4F). These results demonstrate that blocking ZEB1 expression effectively attenuated OXA-resistance in HCT116/OXA cells.
ZEB1 silencing promoted apoptosis and restored OXA-sensitivity of HCT116/OXA cells. (A & B) SiRNA1 candidate sequence pairs with the highest inhibition efficiency of ZEB1 expression confirmed by qRT-PCR and Western blot analyses were selected for subsequent experiments. The differences in ZEB1 expression levels among different groups were tested by one-way ANOVA analysis. (C) CCK8 assays were performed to identify the role(s) of ZEB1 in the OXA-sensitivity of colon cancer cells. (D) ZEB1 knockdown inhibited proliferation of HCT116/OXA cells, as measured by colony formation assays (P < 0.01). (E) The expression of apoptotic protein Caspase-3 and anti-apoptotic protein Bcl-2 measured by Western blot was normalized to GAPDH protein expression. (F) ZEB1 knockdown significantly enhanced OXA-induced apoptosis in HCT116/OXA cells (P < 0.05). All data represented as mean ± SD were from three independent experiments. *: P < 0.05, **: P < 0.01, ***: P < 0.001.
Knockdown of ZEB1 reversed the EMT phenotype in HCT116/OXA cells
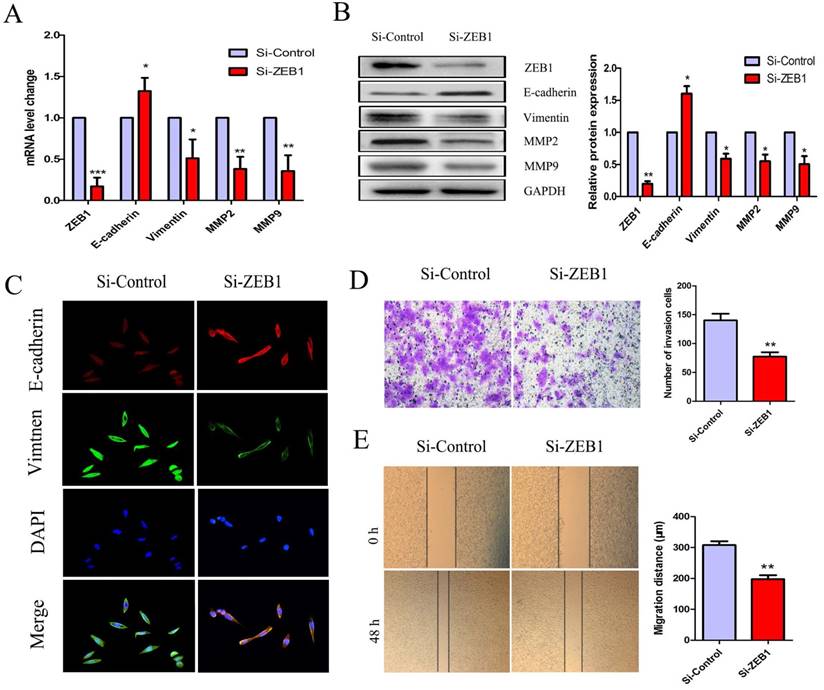
To further investigate the role(s) of ZEB1 in OXA-resistance in HCT116/OXA cells with an EMT phenotype, we measured mRNA and protein expression of E-cadherin, Vimentin, MMP2, and MMP9. The expression of E-cadherin was increased but that of Vimentin, MMP2, MMP9 were decreased in the Si-ZEB1 group, as compared to in the Si-control group (Figure 5A & 5B). Moreover, IF staining against EMT biomarkers revealed an attenuation of EMT phenotype induced by ZEB1 knockdown in HCT116/OXA cells (Figure 5C). Transwell and scratch wound healing assays showed that the migration and invasion capacities of CC cells were reduced in the Si-ZEB1 group relative to the Si-control group (Figure 5D & 5E, P < 0.01, respectively). Taken together, the data shows that ZEB1 is an important factor in EMT and OXA-resistance in CC cells.
Si-ZEB1 reversed the EMT phenotype of HCT116/OXA cells. (A & B) mRNA and protein expression of EMT biomarkers in HCT116/OXA cells following ZEB1 silencing. (C) Expression of EMT biomarkers E-cadherin / Vimentin evaluated by IF staining (Original magnification: ×400). (D) Transwell assays revealed dramatically increased invasion ability of HCT116/OXA cells in the Si-ZEB1 group, compared with that in Si-control group (P < 0.01). (E) Scratch wound healing assays indicated that Si-ZEB1 inhibited the migration of OXA-resistant colon cancer cells (P < 0.01). *: P < 0.05, **: P < 0.01, ***: P < 0.001.
Knockdown of ZEB1 rescued OXA-sensitivity in a subcutaneous xenograft nude mice model
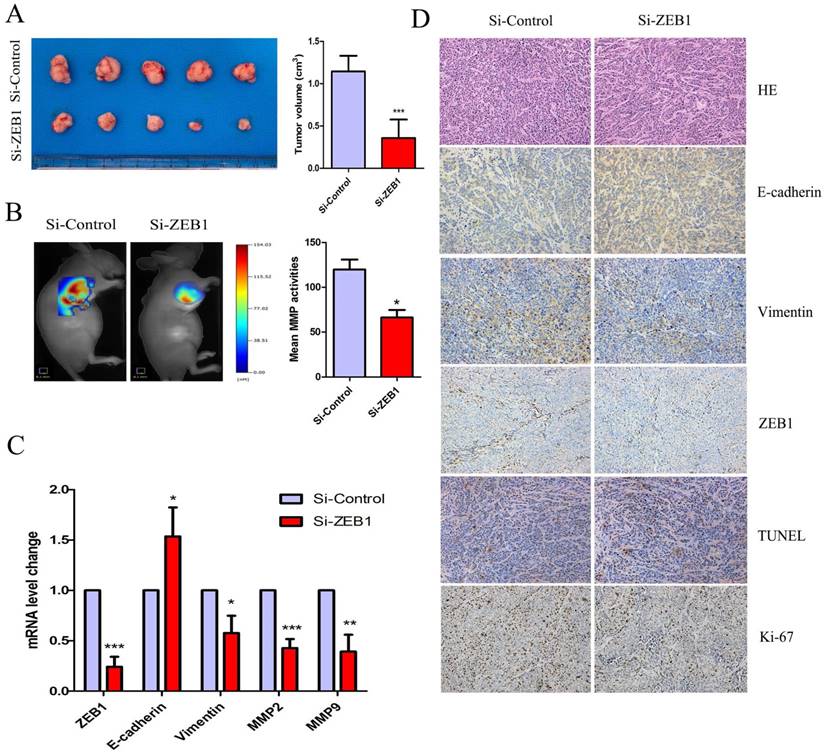
Figure 6A shows that HCT116/OXA cell-derived tumor tissues located at the implantation sites were smaller in the Si-ZEB1 group than those from the Si-control group after four weeks of OXA treatment (Si-ZEB1 vs. Si-control: 0.35± 0.21 cm3 vs. 1.15± 0.18 cm3, P < 0.001). We measured activity of MMP in subcutaneous tumors using a fluorescent imaging system six weeks following tumor implantation. Figure 6B shows that mean MMP activity indicated by fluorescence intensity was decreased when ZEB1 expression was depleted (Si-control vs. Si-ZEB1: 119.8 ± 19.30 vs. 66.14± 14.81, P < 0.05). Using qRT-PCR and IHC staining to measure the expression of EMT biomarkers, we found that ZEB1 knockdown reversed the EMT phenotype as evidenced by the up-regulation of E-cadherin and down-regulation of Vimentin (Figure 6C & 6D). TUNEL assay showed that the apoptosis rate of CC cells in Si-ZEB1 group was higher than that in the Si-control group (48.52 ± 5.39% vs. 33.97 ± 3.52%, P < 0.05, Figure 6D). IHC results revealed a higher cell proliferation index (Ki-67) in Si-ZEB1 groups relative to control (56.47 ± 1.98% vs. 28.61 ± 6.28%, P < 0.01, Figure 6D). In short, ZEB1 silencing significantly reversed the EMT phenotype and attenuated OXA-resistance in HCT116/OXA cells in vivo.
ZEB1 knockdown attenuated OXA-resistance of colon cancer cells in vivo. (A) Tumor size was measured by the formula: V (cm3) = (L × W2) × 0.5 (L: Tumor length, W: Width). (B) Mean fluorescence intensity of tumors was equal to the total MMP Fluorescence Signal / Tumor Size, which was calculated by the TrueQuant™ (the Quantitative Tomography in vivo Imaging Software, PerkinElmer) and used to reflect mean MMP activitiy in vivo. (C) mRNA expression of EMT-related biomarkers in Xenograft tumors was analyzed by qRT-PCR. (D) HE and IHC analysis showed that the expression of Ki67 and Vimentin were down-regulated, while expression of E-cadherin was up-regulated in the Si-ZEB1 group, as compared with that in the Si-control group (Original magnification: × 200). TUNEL assay indicated that the apoptosis rate was increased in HCT116/OXA cells following ZEB1 silencing (Original magnification: × 200). Data were shown as mean ± SD. *: P < 0.05, **: P < 0.01, ***: P < 0.001.
Discussion
Aberrant activation of ZEB1 had been shown to regulate cancer cell differentiation, migration, invasion, proliferation, apoptosis and chemo-resistance in the progression of various cancers [19-21]. An analysis of 92 patients with primary colorectal cancer (CRC) indicated that overexpression of ZEB1 might be an independent prognostic factor for patients with CRC [22]. Here we demonstrated that ZEB1 expression was significantly elevated in colon cancer tissues of advanced stage IV receiving OXA-based chemotherapy, and also in OXA-resistant CC cells as compared with their parental cells.
Our results indicate that EMT is importantly involved in OXA-resistance and that ZEB1 plays a critical role in the EMT-regulated OXA sensitivity of CC cells. After receiving OXA treatment, HCT116 cells without an EMT phenotype exhibited up-regulated Caspase-3 but an unchanged expression of anti-apoptosis protein of Bcl-2; in contrast to HCT116/OXA cells with an EMT phenotype, which showed the opposite. Probably, the enhanced anti-apoptosis characteristics of in HCT116/OXA cells may contribute to the EMT phenotype [23, 24]. It has been reported that cell proliferation is enhanced after the development of EMT characteristics in human melanoma [25]. However, we found that the proliferation capacity of OXA-resistance cells (HCT116/OXA) was weaker than that of the parental cells (HCT116). It may be a unique mechanism which is responsible for OXA-resistance in CC cells Moreover, knockdown of ZEB1 in HCT116/OXA cells resulted in a reversal of EMT and an enhancement of OXA-sensitivity in vitro and in vivo. Consistent with our findings, Yoshihiro showed that ZEB1 knockdown activates the apoptosis pathway in non-small cell lung cancer (NSCLC) cell lines and lung tumors [26]. Also, ZEB1 depletion may enhance the sensitivity of melanoma cells to mitogen-activated protein kinase (MAPK) inhibitors via reversing EMT reversal [20].
Chemo-resistance is frequently accompanied by metastasis [27]. Previous studies have shown that acquisition of an EMT phenotype in CRC cells increases migration and invasion abilities [28]. Our data indicated that OXA-resistance CC cells with an EMT phenotype exhibited had a significantly greater metastasis ability, which could be reversed by ZEB1 silencing. Taken together, our findings suggest that ZEB1 overexpression would augment OXA resistance in CC cells by triggering EMT along with development of anti-apoptosis, invasion and migration characteristics. These processes are reflected at the molecular level by the activation of anti-apoptosis pathways involving Bcl-2 overexpression and by ECM degradation involving up-regulation of MMP2 and MMP9 expression.
The present study found that ZEB1 to be overexpressed in OXA-resistant CC cells, as compared with their parent cells. The mechanisms of ZEB1 activation in malignant tumors are complex. Some studies have suggested that TGF-β/SMADs and Wnt/β-catenin signaling pathways directly influence the nuclei expression of ZEB1. TGF-β expression is high in the tumor micro-environment and associated with neoplasm angiogenesis, invasion, migration, proliferation and stemness [29-31]. A recent research revealed that using TGF-β treated glioblastoma (U87 cells) induced a positive expression of SMAD2 and ZEB1, but an absence of epithelial markers [32]. TGF-β signaling results in trimeric SMAD complex (SMAD2-SMAD3-SMAD4) formation via two types of tetrameric complex (TβRI and TβRII); the trimeric SMAD complex translocates to the nucleus where it ZEB1 expression is activated [33]. Wnt/β-catenin signaling participates in EMT by triggering ZEB1 expression [34, 35]. The activated Wnt protein inhibits phosphorylation of β-catenin through regulation of APC-axin-GSK-3β compound; un-phosphorylated β-catenin translocates to the nucleus and induces activation of ZEB1 expression [36].
In summary, ZEB1 promotes EMT and plays an important role in the OXA-resistance of colon cancer cells. Exploring ZEB1's biological role may reveal a strategy for using ZEB1 as a prognostic biomarker of drug-resistance in tumors and/or a potential target gene for therapy.
Abbreviations
ZEB1: Zinc finger E-box binding homeobox 1;
EMT: Epithelial mesenchymal transition;
SiRNA: Small interfering RNA
CC: Colon cancer;
OS: Overall survival;
ECM: Extracellular matrix;
MMP: matrix metalloproteinase;
IF: Immunofluorescence;
EMT-TFs: EMT transcriptional factors
Acknowledgements
This study was supported by the grants from National Natural Science Foundation of China (No. 30770971, 81172470, 81070362 & 81372629), the Fundamental Research Funds for the Central Universities of Central South University (2017zzts847) and two key projects from the Nature Science Foundation of Hunan Province (No. 2015JC3021 & 2016JC2037).
Competing Interests
The authors have declared that no competing interest exists.
References
1. Zhang Y, Ma J, Zhang S, Deng G, Wu X, He J. et al. A prognostic analysis of 895 cases of stage III colon cancer in different colon subsites. International journal of colorectal disease. 2015;30:1173-83
2. Arredondo J, Baixauli J, Pastor C, Chopitea A, Sola J, González I. et al. Mid-term oncologic outcome of a novel approach for locally advanced colon cancer with neoadjuvant chemotherapy and surgery. Clinical and Translational Oncology. 2016;19:379-85
3. Holohan C, Van Schaeybroeck S, Longley DB, Johnston PG. Cancer drug resistance: an evolving paradigm. Nature Reviews Cancer. 2013;13:714-26
4. Elaskalani O, Razak NBA, Falasca M, Metharom P. Epithelial-mesenchymal transition as a therapeutic target for overcoming chemoresistance in pancreatic cancer. World J Gastrointest Oncol. 2017;9:37-41
5. Lazarova D, Bordonaro M. ZEB1 Mediates Drug Resistance and EMT in p300-Deficient CRC. J Cancer. 2017;8:1453-1459
6. Zhang Y, Zeng S, Ma J, Deng G, Qu Y, Guo C. et al. Nestin overexpression in hepatocellular carcinoma associates with epithelial-mesenchymal transition and chemoresistance. Journal of Experimental & Clinical Cancer Research. 2016;35:111
7. li Ma J, Zeng S, Zhang Y, lu Deng G, Shen H. Epithelial-mesenchymal transition plays a critical role in drug resistance of hepatocellular carcinoma cells to oxaliplatin. Tumor Biology. 2016;37:6177-84
8. Kan J Y, Yen M C, Wang J Y. et al. Nesfatin-1/Nucleobindin-2 enhances cell migration, invasion, and epithelial-mesenchymal transition via LKB1/AMPK/TORC1/ZEB1 pathways in colon cancer. Oncotarget. 2016;7:31336-31349
9. Quail DF, Joyce JA. Microenvironmental regulation of tumor progression and metastasis. Nature medicine. 2013;19:1423-37
10. Fabregat I, Malfettone A, Soukupova J. New Insights into the Crossroads between EMT and Stemness in the Context of Cancer. Journal of clinical medicine. 2016;5:37
11. Yun C-O, Bhargava P, Na Y, Lee J-S, Ryu J, Kaul SC. et al. Relevance of mortalin to cancer cell stemness and cancer therapy. Scientific Reports. 2017;7:42016
12. Lu P, Weaver VM, Werb Z. The extracellular matrix: a dynamic niche in cancer progression. J Cell Biol. 2012;196:395-406
13. De Craene B, Berx G. Regulatory networks defining EMT during cancer initiation and progression. Nature Reviews Cancer. 2013;13:97-110
14. Lee J-Y, Kong G. Roles and epigenetic regulation of epithelial-mesenchymal transition and its transcription factors in cancer initiation and progression. Cellular and Molecular Life Sciences. 2016;73:4643-60
15. Sánchez-Tilló E, Liu Y, de Barrios O, Siles L, Fanlo L, Cuatrecasas M. et al. EMT-activating transcription factors in cancer: beyond EMT and tumor invasiveness. Cellular and molecular life sciences. 2012;69:3429-56
16. Graham TR, Zhau HE, Odero-Marah VA, Osunkoya AO, Kimbro KS, Tighiouart M. et al. Insulin-like growth factor-I-dependent up-regulation of ZEB1 drives epithelial-to-mesenchymal transition in human prostate cancer cells. Cancer research. 2008;68:2479-88
17. Zhang P, Sun Y, Ma L. ZEB1: at the crossroads of epithelial-mesenchymal transition, metastasis and therapy resistance. Cell cycle. 2015;14:481-7
18. Tao YM, Huang JL, Zeng S, Zhang S, Fan XG, Wang ZM, Yang HX, Yuan XH, Wang P, Wu F. et al. BTB/POZ domain-containing protein 7: epithelial-mesenchymal transition promoter and prognostic biomarker of hepatocellular carcinoma. Hepatology. 2013;6:2326-2337
19. Hugo HJ, Pereira L, Suryadinata R. et al. Direct repression of MYB by ZEB1 suppresses proliferation and epithelial gene expression during epithelial-to-mesenchymal transition of breast cancer cells. Breast Cancer Res. 2013;6:R113
20. Richard G, Dalle S, Monet MA, Ligier M, Boespflug A, Pommier RM. et al. ZEB1-mediated melanoma cell plasticity enhances resistance to MAPK inhibitors. EMBO Molecular Medicine. 2016;8:1143-61
21. Zhang P, Sun Y, Ma L. ZEB1: At the crossroads of epithelial-mesenchymal transition, metastasis and therapy resistance. Cell Cycle. 2015;4:481-487
22. Zhang G-J, Zhou T, Tian H-P, Liu Z-L, Xia S-S. High expression of ZEB1 correlates with liver metastasis and poor prognosis in colorectal cancer. Oncology letters. 2013;5:564-8
23. Maier HJ, Schmidt-Straßburger U, Huber MA, Wiedemann EM, Beug H, Wirth T. NF-κB promotes epithelial-mesenchymal transition, migration and invasion of pancreatic carcinoma cells. Cancer letters. 2010;295:214-28
24. Savagner P. The epithelial-mesenchymal transition (EMT) phenomenon. Annals of Oncology. 2010;21:vii89-vii92
25. Schlegel NC, Planta A, Widmer DS, Dummer R, Christofori G. PI3K signalling is required for a TGFβ-induced epithelial-mesenchymal-like transition (EMT-like) in human melanoma cells. Experimental dermatology. 2015;24:22-8
26. Takeyama Y, Sato M, Horio M, Hase T, Yoshida K, Yokoyama T. et al. Knockdown of ZEB1, a master epithelial-to-mesenchymal transition (EMT) gene, suppresses anchorage-independent cell growth of lung cancer cells. Cancer letters. 2010;296:216-24
27. Jung H-Y, Fattet L, Yang J. Molecular pathways: linking tumor microenvironment to epithelial-mesenchymal transition in metastasis. Clinical Cancer Research. 2015;21:962-8
28. Shen H, Ma J-L, Zhang Y, Deng G-L, Qu Y-L, Wu X-L. et al. Integrin-linked kinase overexpression promotes epithelial-mesenchymal transition via nuclear factor-κB signaling in colorectal cancer cells. World journal of gastroenterology. 2016;22:3969
29. Sundqvist A, ten Dijke P, van Dam H. Key signaling nodes in mammary gland development and cancer: Smad signal integration in epithelial cell plasticity. Breast Cancer Research. 2012;14:204
30. Wang J, Zhang B, Wu H, Cai J, Sui X, Wang Y. et al. CD51 correlates with the TGF-beta pathway and is a functional marker for colorectal cancer stem cells. Oncogene. 2017;36:1351-63
31. Xiao J, Xiang Q, Xiao Y-C, Su Z-J, Huang Z-F, Zhang Q-H. et al. The effect of transforming growth factor-β1 on nasopharyngeal carcinoma cells: insensitive to cell growth but functional to TGF-β/Smad pathway. Journal of Experimental & Clinical Cancer Research. 2010;29:35
32. Joseph J, Conroy S, Tomar T, Eggens-Meijer E, Bhat K, Copray S. et al. TGF-β is an inducer of ZEB1-dependent mesenchymal transdifferentiation in glioblastoma that is associated with tumor invasion. Cell death & disease. 2014;5:e1443
33. Lamouille S, Xu J, Derynck R. Molecular mechanisms of epithelial-mesenchymal transition. Nature reviews Molecular cell biology. 2014;15:178-96
34. Arend RC, Londoño-Joshi AI, Straughn JM, Buchsbaum DJ. The Wnt/β-catenin pathway in ovarian cancer: a review. Gynecologic oncology. 2013;131:772-9
35. Xu Y, Chen Y-Z, Liu F, Ma S-P. Pleomorphic adenoma gene like-2 induces epithelial-mesenchymal transition via Wnt/β-catenin signaling pathway in human colorectal adenocarcinoma. Oncology Reports. 2017;37:1961-70
36. Herzig M, Savarese F, Novatchkova M, Semb H, Christofori G. Tumor progression induced by the loss of E-cadherin independent of β-catenin/Tcf-mediated Wnt signaling. Oncogene. 2007;26:2290-8
Author contact
![]() Corresponding author: Dr. Shan Zeng, Department of Oncology, Xiangya Hospital, Central South University, Changsha, Hunan, China 410008. Tel: (86) 731-8975-3034, E-mail: zengshan2000edu.cn
Corresponding author: Dr. Shan Zeng, Department of Oncology, Xiangya Hospital, Central South University, Changsha, Hunan, China 410008. Tel: (86) 731-8975-3034, E-mail: zengshan2000edu.cn