Impact Factor ISSN: 1837-9664

 Global reach, higher impact
J Cancer 2017; 8(16):3198-3211. doi:10.7150/jca.20456 This issue Cite
Research Paper
Association between 8q24 Gene Polymorphisms and the Risk of Prostate Cancer: A Systematic Review and Meta-Analysis
Ran Li1, Zhiqiang Qin1, Jingyuan Tang1, Peng Han1, Qianwei Xing1, 2, Feng Wang3, Shuhui Si4, Xiaolu Wu5, Min Tang1, Wei Wang1 ![]() , Wei Zhang1
, Wei Zhang1 ![]()
1. Department of Urology, The First Affiliated Hospital of Nanjing Medical University, Nanjing, 210029, China;
2. Department of Urology, Affiliated Hospital of Nantong University, Nantong, 226001, China;
3. Department of Radiation Oncology, The First Affiliated Hospital of Nanjing Medical University, Nanjing, 210029, China;
4. Research Division of Clinical Pharmacology, The First Affiliated Hospital of Nanjing Medical University, Nanjing, 210029, China;
5. Department of Pediatrics, The First Affiliated Hospital of Nanjing Medical University, Nanjing, 210029, China.
Ran Li, Zhiqiang Qin and Jingyuan Tang contributed equally to this work.
Received 2017-4-7; Accepted 2017-8-7; Published 2017-9-15
Abstract
Though numerous studies have been conducted to investigate the associations between five 8q24 polymorphisms (rs6983267 T>G, rs1447295 C>A, rs16901979 C>A, rs6983561 A>C and rs10090154 C>T) and prostate cancer (PCa) risk, the available results remained contradictory. Therefore, we performed a comprehensive meta-analysis to derive a precise estimation of such associations. We searched electronic databases PubMed, EMBASE, Web of Science and Wan Fang for the relevant available studies up to February 1st, 2017, and 39 articles were ultimately adopted in this meta-analysis. All data were extracted independently by two investigators and recorded in a unified form. The strength of association between 8q24 polymorphisms and PCa susceptibility was evaluated by the pooled odds ratios (ORs) with 95% confidence intervals (CIs). Subgroup analysis was conducted based on ethnicity, source of controls and genotypic method. Overall, a total of 39 articles containing 80 studies were adopted in this meta-analysis. The results of this meta-analysis indicated that five 8q24 polymorphisms above were all related to PCa susceptibility. Besides, in the subgroup analysis by ethnicity, all selected 8q24 polymorphisms were significantly associated with PCa risk in Asian population. In addition, stratification analysis by source of controls showed that significant results were mostly concentrated in the studies' controls from general population. Moreover, when stratified by genotypic method, significant increased PCa risks were found by TaqMan method. Therefore, this meta-analysis demonstrated that 8q24 polymorphisms (rs6983267 T>G, rs1447295 C>A, rs16901979 C>A, rs6983561 A>C and rs10090154 C>T) were associated with the susceptibility to PCa, which held the potential biomarkers for PCa risk.
Keywords: 8q24, Polymorphisms, Prostate cancer, Meta-analysis.
Introduction
Prostate cancer (PCa) is one of the most common non-cutaneous malignancies among men in developed country, with an estimated 161,360 new cases and 26,730 deaths in the United States in 2017 [1]. Many influencing factors have been proved to be associated with the risk of PCa, including advancing age, ethnicity, smoking and alcohol consumption, endocrine system, and genetic factors. However, the underlying etiology of PCa is still confusing [2]. Recently, genetic predisposition of PCa have gradually attracted investigators' attention. Especially, it suggested that common genetic polymorphisms such as single nucleotide polymorphic variants (SNPs) might be associated with sporadic cases of PCa [3]. In addition, several studies have identified the 8q24 polymorphisms increased the risk of PCa [4-6]. Therefore, we plan to study the etiology of PCa from the aspect of genetic predisposition.
Chromosomal region 8q24 has been proved to be associated with a wide spectrum of cancers, including cancers of the breast, prostate, bladder, colon, lung, ovaries and pancreas among different ethnicities [7-13]. A region on chromosome 8q24 was originally shown to confer PCa risk in a genome-wide linkage scan of 871 Icelandic men in 2006 [14]. In addition, 8q24 was considered as a gene-free region, flanked by the FAM84B and MYC genes on the centromeric and telomeric ends respectively [15]. Physical nearness might indicate the association between 8q24 and MYC proto-oncogene. As a highly conserved genomic region, three 8q24 regions (region 1: 128.54-128.62 Mb; region 2: 128.12-128.28 Mb; region 3: 128.47-128.54 Mb) have been identified to contain variants independently associated with PCa susceptibility [16]. Subsequently, multiple independent studies have been performed to extensively explore the roles of 8q24 SNPs in the risk of PCa. Thus, it was hypothesized that the genetic variations in the 8q24 region were likely to take effect in prostate carcinogenesis.
Genome-wide association studies (GWAS) have identified more than 100 common SNPs that were associated with the susceptibility of PCa. A large number of studies have explored the associations between these polymorphisms and the risk of PCa [17]. In previous studies, five 8q24 polymorphisms (rs6983267 T>G, rs1447295 C>A, rs16901979 C>A, rs6983561 A>C and rs10090154 C>T) among these SNPs might have strong associations with PCa susceptibility. Nevertheless, the results of these studies were inconsistent and inconclusive [4,18-20]. Hence, we conducted an updated meta-analysis including all eligible case-control studies to investigate the association between 8q24 gene polymorphisms and the risk of PCa.
Materials and Methods
We searched PubMed, EMBASE, Web of Science and Wan Fang databases comprehensively to obtain relevant studies published up to February 1st, 2017. The following searching keywords were utilized: “8q24”, “polymorphisms” or “mutations” or “variants”, and “prostate cancer” or “prostatic neoplasms”. Potential eligible articles were manually collected by searching from the reference lists of relevant literature and reviews. In addition, overlapping data from different articles were removed.
Then, all eligible articles were collected according the following inclusive criteria: (1) Independent case-control or cohort studies; (2) Possessing at least one of 8q24 polymorphisms (rs6983267 T>G, rs1447295 C>A, rs16901979 C>A, rs6983561 A>C and rs10090154 C>T); (3) Availability of genotype data of both cases and controls; (4) Enrolled patients with PCa confirmed by histopathological examination, and controls with no history of neoplasms. Meanwhile, the exclusive criteria were as follows: (1) No case-control study; (2) Duplicate or unavailable data; (3) Studies not related to 8q24 or prostate cancer.
Data extraction
All available data from the eligible studies identified were extracted independently by two investigators (Li R and Qin ZQ). If any disagreement appeared, a third investigator (Tang JY) would join in and make a better decision. All the extracted data were recorded in a unified form and the following items were collected: first author' name, publication year, ethnicity, source of controls, genotypic method, the number of cases and controls, the number of 8q24 polymorphisms carriers and non-carriers respectively and the results of the Hardy-Weinberg equilibrium (HWE) test.
Statistical analysis
The Pearson's goodness-of-fit chi-square test was adopted to access HWE in the control groups. Besides, P value was more than 0.05, which was regarded as significant equilibrium. The strength of associations between 8q24 polymorphisms and susceptibility to PCa were evaluated by the pooled odds ratios (ORs) with 95% confidence intervals (CIs) using five genetic comparison models: allele model, homozygous model, heterozygous model, dominant model and recessive model. Fixed effect model (a Mantel-Haenszel method) and random effect model (a DerSimonian-Laird method), as two common statistical models, were selected according to Cochrane Q test and Higgins I2 statistic. If the heterogeneity is acceptable (I2 < 50% suggested no obvious heterogeneity), the fixed effect model will be adopted; Otherwise, the random effect model will be performed to calculate the pooled ORs. Besides, the random effect model is a kind of method for disposing heterogeneous data, but it cannot replace the reason analysis of the source of heterogeneity. Normally, several reasons might induce the heterogeneity, including design scheme, measuring method, age, ethnicity and so on. In addition, subgroup analysis according to ethnicity, source of controls and genotypic method was further used to explore the source of heterogeneity. To examine the stability and reliability of the results in this meta-analysis, sensitive analysis was adopted to recalculate the pooled ORs following the sequential exclusion of a single study at a time. Moreover, Begg's funnel plots and Egger's linear regression test were used to check out the publication bias between all included studies, and P values were considered as a significantly selective bias when less than 0.05. STATA 12.0 software (State Corporation, College Station, TX, USA) was utilized to dispose all above statistical analyses.
Results
Studies characteristics
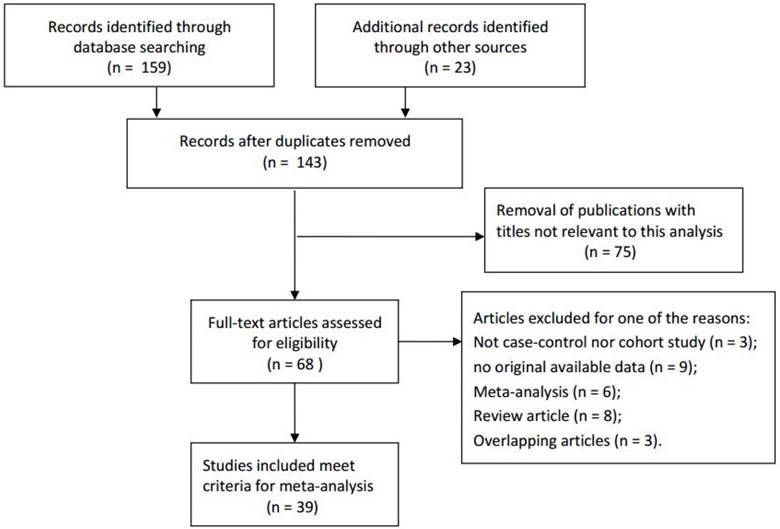
Based on the retrieve strategy above, a total of related 182 articles were initially collected by a primary search of databases and reference lists. According to the inclusive criteria, 39 articles consisting of 80 studies were ultimately adopted in the present meta-analysis for a further evaluation, which had been accrued between March 2007 and January 2015 [4-6, 18-53]. The details of the literature search and screening process were shown in Figure 1. Among the eligible 80 studies, the distribution of genotypes in the controls was consistent with HWE, except three studies. In this meta-analysis, all of the baseline characteristics of the studies associated with the risk of PCa were listed in Table 1. These studies were conducted in Caucasians, Asians, Africans and Mixed. Furthermore, in order to distinguish between different sources of control group, investigators divided them into population-based group or hospital-based group in all studies. Besides, six genotypic methods were applied in these studies, such as Taqman, PCR-RFLP, iPLEX and so on.
The flowchart of literature search and selection procedure.
Characteristics of individual studies included in the meta-analysis.
| rs6983267(T>G) | Case (n) | Control(n) | |||||||||||
| Year | Surname | Ethnicity | SOC | Genotypic | Case | Control | TT | TG | GG | TT | TG | GG | HWE |
| 2014 | Oskina | Caucasian | PB | TaqMan | 389 | 341 | 89 | 186 | 114 | 77 | 177 | 87 | Y |
| 2014 | Zhang | Asian | PB | PCR-RFLP | 124 | 138 | 42 | 54 | 28 | 45 | 67 | 26 | Y |
| 2014 | Francisco | Caucasian | HB | TaqMan | 82 | 21 | 19 | 33 | 30 | 5 | 13 | 3 | Y |
| 2013 | Chan | Asian | HB | Illumina 1M chip | 288 | 144 | 89 | 136 | 63 | 47 | 74 | 23 | Y |
| 2013 | Brankovie | Caucasian | HB | PCR-RFLP | 150 | 100 | 53 | 80 | 17 | 25 | 49 | 26 | Y |
| 2013 | Zhao | Asian | PB | PCR-RFLP | 282 | 282 | 77 | 149 | 56 | 94 | 137 | 51 | Y |
| 2012 | Ho | Caucasian | PB | PCR-RFLP | 216 | 248 | 70 | 104 | 42 | 66 | 136 | 46 | Y |
| 2012 | Joung | Asian | HB | iPLEX | 194 | 168 | 56 | 92 | 46 | 51 | 86 | 31 | Y |
| 2012 | Liu | Asian | PB | PCR-RFLP | 260 | 282 | 70 | 137 | 53 | 94 | 137 | 51 | Y |
| 2011 | Okobia | African | HB | TaqMan | 343 | 426 | 2 | 34 | 307 | 1 | 52 | 373 | Y |
| 2011 | Papanikolopoulou | Caucasian | HB | TaqMan | 86 | 99 | 16 | 46 | 24 | 39 | 47 | 13 | Y |
| 2011 | Liu | Asian | PB | GWAS | 792 | 1325 | 231 | 405 | 156 | 426 | 647 | 252 | Y |
| 2011 | Liu | Asian | PB | PCR-RFLP | 40 | 40 | 12 | 23 | 5 | 7 | 17 | 16 | Y |
| 2010 | Zheng | Asian | PB | iPLEX | 282 | 152 | 86 | 134 | 62 | 51 | 72 | 29 | Y |
| 2009 | Liu | Asian | HB | TaqMan | 391 | 323 | 151 | 181 | 59 | 147 | 151 | 25 | Y |
| 2009 | Penney | Caucasian | PB | iPLEX | 1305 | 1402 | 400 | 644 | 261 | 372 | 707 | 323 | Y |
| 2009 | Penney | Caucasian | PB | iPLEX | 3772 | 249 | 1184 | 1776 | 812 | 69 | 134 | 46 | Y |
| 2009 | Beuten | Caucasian | PB | Illumina 1M chip | 597 | 838 | 107 | 297 | 193 | 218 | 423 | 197 | Y |
| 2008 | Terada | Asian | HB | PCR-RFLP | 507 | 511 | 211 | 219 | 77 | 206 | 225 | 80 | Y |
| 2008 | Salinas | Caucasian | PB | PCR-RFLP | 1258 | 1238 | 242 | 652 | 364 | 308 | 617 | 313 | Y |
| 2008 | Cheng | Caucasian | HB | TaqMan | 417 | 417 | 76 | 215 | 126 | 106 | 206 | 105 | Y |
| 2008 | Cheng | African | HB | TaqMan | 89 | 89 | 1 | 14 | 74 | 4 | 11 | 74 | N |
| 2008 | Wokolorczyk | Caucasian | PB | PCR-RFLP | 1885 | 1910 | 385 | 942 | 558 | 513 | 977 | 420 | Y |
| 2007 | Zheng | Caucasian | HB | iPLEX | 1551 | 573 | 285 | 771 | 495 | 132 | 299 | 142 | Y |
| 2007 | Yeager | Mixed | PB | GWAS | 4296 | 4299 | 838 | 2104 | 1354 | 1072 | 2130 | 1097 | Y |
| 2007 | Haiman | Caucasian | PB | TaqMan | 1047 | 857 | 207 | 543 | 297 | 208 | 417 | 232 | Y |
| 2007 | Haiman | Mixed | PB | TaqMan | 708 | 718 | 290 | 310 | 108 | 335 | 300 | 83 | Y |
| rs1447295C>A | Case (n) | Control(n) | |||||||||||
| Year | Surname | Ethnicity | SOC | Genotypic | Case | Control | CC | AC | AA | CC | AC | AA | HWE |
| 2014 | Zhang | Asian | PB | PCR-RFLP | 123 | 137 | 74 | 45 | 4 | 91 | 44 | 2 | Y |
| 2014 | Oskina | Caucasian | PB | TaqMan | 392 | 343 | 291 | 93 | 8 | 292 | 50 | 1 | Y |
| 2014 | Cheryl | African | PB | iPLEX | 515 | 507 | 223 | 224 | 68 | 226 | 215 | 66 | Y |
| 2014 | Francisco | Caucasian | HB | TaqMan | 83 | 21 | 56 | 23 | 4 | 16 | 4 | 1 | Y |
| 2013 | Chan | Asian | HB | Illumina 1M chip | 289 | 143 | 180 | 92 | 17 | 94 | 44 | 5 | Y |
| 2013 | Brankovie | Caucasian | HB | PCR-RFLP | 150 | 100 | 86 | 61 | 3 | 11 | 82 | 7 | N |
| 2013 | Zhao | Asian | PB | PCR-RFLP | 277 | 287 | 161 | 108 | 8 | 197 | 86 | 4 | Y |
| 2012 | Joung | Asian | HB | iPLEX | 193 | 168 | 114 | 67 | 12 | 127 | 38 | 3 | Y |
| 2012 | Liu | Asian | PB | PCR-RFLP | 260 | 287 | 150 | 102 | 8 | 197 | 86 | 4 | Y |
| 2011 | Okobia | African | HB | TaqMan | 354 | 438 | 156 | 162 | 36 | 173 | 207 | 58 | Y |
| 2011 | Zeegers | Caucasian | PB | TaqMan | 281 | 267 | 224 | 53 | 4 | 196 | 64 | 7 | Y |
| 2011 | Liu | Asian | PB | PCR-RFLP | 40 | 40 | 11 | 7 | 22 | 5 | 15 | 20 | Y |
| 2010 | Benford | African | HB | TaqMan | 189 | 523 | 86 | 77 | 26 | 237 | 221 | 65 | Y |
| 2010 | Wokolorczyk | Caucasian | HB | PCR-RFLP | 690 | 602 | 515 | 156 | 19 | 484 | 115 | 3 | Y |
| 2010 | Zheng | Asian | PB | iPLEX | 284 | 151 | 173 | 96 | 15 | 110 | 35 | 6 | Y |
| 2010 | Xie | Asian | PB | PCR-RFLP | 120 | 120 | 74 | 41 | 5 | 90 | 26 | 4 | Y |
| 2009 | Liu | Asian | HB | TaqMan | 391 | 323 | 217 | 149 | 25 | 218 | 89 | 16 | Y |
| 2009 | Chen | Asian | PB | TaqMan | 340 | 337 | 215 | 119 | 6 | 253 | 75 | 9 | Y |
| 2008 | Terada | Asian | HB | PCR-RFLP | 507 | 387 | 310 | 172 | 25 | 254 | 122 | 11 | Y |
| 2008 | Salinas | Caucasian | PB | TaqMan | 1252 | 1233 | 937 | 288 | 27 | 994 | 225 | 14 | Y |
| 2008 | Cheng | Caucasian | HB | TaqMan | 417 | 417 | 318 | 97 | 2 | 344 | 69 | 4 | Y |
| 2008 | Cheng | African | HB | TaqMan | 89 | 89 | 39 | 44 | 6 | 43 | 35 | 11 | Y |
| 2007 | Schumacher | Caucasian | PB | TaqMan | 11466 | 12988 | 8462 | 2736 | 268 | 10344 | 2472 | 172 | Y |
| 2007 | Zheng | Caucasian | HB | iPLEX | 1546 | 571 | 1169 | 346 | 31 | 485 | 82 | 4 | Y |
| 2007 | Suurinirmi | Caucasian | PB | TaqMan | 582 | 538 | 435 | 136 | 11 | 427 | 107 | 4 | Y |
| 2007 | Severi | Caucasian | PB | TaqMan | 821 | 732 | 595 | 212 | 14 | 586 | 135 | 11 | Y |
| 2007 | Wang | Caucasian | PB | TaqMan | 491 | 545 | 383 | 99 | 9 | 439 | 101 | 5 | Y |
| rs16901979(C>A) | Case (n) | Control(n) | |||||||||||
| Year | Surname | Ethnicity | SOC | Genotypic | Case | Control | CC | AC | AA | CC | AC | AA | HWE |
| 2015 | Geraldine | African | PB | TaqMan | 489 | 534 | 143 | 239 | 107 | 192 | 253 | 89 | Y |
| 2014 | Cheryl | African | PB | iPLEX | 520 | 510 | 123 | 270 | 127 | 154 | 236 | 120 | Y |
| 2013 | Chan | Asian | HB | Illumina 1Mchip | 289 | 144 | 139 | 119 | 31 | 64 | 68 | 12 | Y |
| 2012 | Joung | Asian | HB | iPLEX | 194 | 169 | 99 | 81 | 14 | 100 | 57 | 12 | Y |
| 2011 | Okobia | African | HB | TaqMan | 338 | 426 | 81 | 158 | 99 | 131 | 193 | 102 | Y |
| 2010 | Chen | Asian | HB | TaqMan | 331 | 335 | 148 | 148 | 35 | 173 | 138 | 24 | Y |
| 2010 | Benford | African | HB | TaqMan | 192 | 512 | 45 | 97 | 50 | 188 | 237 | 87 | Y |
| 2010 | Xie | Asian | PB | PCR-RFLP | 120 | 120 | 54 | 56 | 10 | 58 | 54 | 8 | Y |
| 2010 | Zheng | Asian | PB | iPLEX | 283 | 145 | 110 | 139 | 34 | 85 | 52 | 8 | Y |
| 2008 | Cheng | Caucasian | HB | TaqMan | 417 | 416 | 375 | 41 | 1 | 393 | 22 | 1 | Y |
| 2008 | Cheng | African | HB | TaqMan | 89 | 88 | 23 | 43 | 23 | 27 | 50 | 11 | Y |
| rs6983561A>C | Case (n) | Control(n) | |||||||||||
| Year | Surname | Ethnicity | SOC | Genotypic | Case | Control | AA | AC | CC | AA | AC | CC | HWE |
| 2014 | Hui | Asian | HB | PCR-HRM | 276 | 283 | 139 | 108 | 29 | 156 | 110 | 17 | Y |
| 2012 | Zhang | Asian | PB | PCR-HRM | 212 | 231 | 110 | 80 | 22 | 130 | 87 | 14 | Y |
| 2010 | Benford | African | HB | TaqMan | 186 | 508 | 48 | 88 | 50 | 171 | 232 | 105 | Y |
| 2010 | Chen | Asian | PB | TaqMan | 324 | 336 | 135 | 152 | 37 | 175 | 136 | 25 | Y |
| 2010 | Xie | Asian | PB | PCR-RFLP | 120 | 120 | 56 | 53 | 11 | 62 | 50 | 8 | Y |
| 2010 | Zheng | Asian | PB | iPLEX | 284 | 141 | 109 | 141 | 34 | 80 | 53 | 8 | Y |
| 2008 | Salinas | Caucasian | PB | PCR-RFLP | 1264 | 1236 | 1124 | 135 | 5 | 1156 | 78 | 2 | Y |
| rs10090154C>T | Case (n) | Control(n) | |||||||||||
| Year | Surname | Ethnicity | SOC | Genotypic | Case | Control | CC | CT | TT | CC | CT | TT | HWE |
| 2014 | Oskina | Caucasian | PB | TaqMan | 368 | 314 | 289 | 73 | 6 | 280 | 33 | 1 | Y |
| 2014 | Zhang | Asian | PB | PCR-RFLP | 123 | 131 | 74 | 48 | 1 | 90 | 39 | 2 | Y |
| 2013 | Zhao | Asian | PB | PCR-RFLP | 279 | 280 | 168 | 106 | 5 | 203 | 73 | 4 | Y |
| 2011 | Pu | Asian | PB | PCR-HRM | 123 | 96 | 74 | 48 | 1 | 63 | 32 | 1 | Y |
| 2010 | Benford | African | HB | TaqMan | 189 | 505 | 124 | 59 | 6 | 357 | 131 | 17 | Y |
| 2010 | Zheng | Asian | PB | iPLEX | 282 | 148 | 170 | 98 | 14 | 112 | 30 | 6 | N |
| 2008 | Cheng | Caucasian | PB | TaqMan | 417 | 414 | 315 | 101 | 1 | 342 | 68 | 4 | Y |
| 2008 | Cheng | African | PB | TaqMan | 89 | 88 | 52 | 36 | 1 | 61 | 24 | 3 | Y |
SOC: Source of controls; PB: Population-based controls; HB: Hospital-based controls.
Quantitative synthesis results
In general, the pooled ORs and 95% CIs were utilized to evaluate the strength of the association between 8q24 polymorphisms and PCa risk based on five genetic comparison models. Results of the association between 8q24 polymorphisms and PCa susceptibility were listed in Table 2. To explore the heterogeneity of these studies, stratification analysis by ethnicity, source of controls and genotypic method was conducted. Meanwhile, subgroups with less than three studies were excluded from further analysis to avoid the possible false associations.
Meta-analysis results for the included studies of the association between 8q24 polymorphisms (rs6983267 T>G, rs1447295 C>A, rs16901979 C>A, rs6983561 A>C and rs10090154 C>T) and risk of prostate cancer.
| Variables | No. of studies | Allele model | Dominant model | Heterozygous model | Homozygous model | Recessive model | |||||||||||
|---|---|---|---|---|---|---|---|---|---|---|---|---|---|---|---|---|---|
| OR (95% CI) | P values | I-squared (%) | OR (95% CI) | P values | I-squared (%) | OR (95% CI) | P values | I-squared (%) | OR (95% CI) | P values | I-squared (%) | OR (95% CI) | P values | I-squared (%) | |||
| rs6983267 T>G | G vs T | (TG+GG) vs TT | TG vs TT | GG vs TT | GG vs (TG+TT) | ||||||||||||
| All | 27 | 1.14 (1.06, 1.22) | <0.001 | 73.7 | 1.18 (1.06, 1.30) | <0.001 | 66.4 | 1.13 (1.03, 1.23) | 0.002 | 49.9 | 1.31 (1.13, 1.51) | <0.001 | 73.9 | 1.21 (1.10, 1.34) | <0.001 | 64.4 | |
| Ethnicity | |||||||||||||||||
| Caucasian | 13 | 1.14 (1.01, 1.28) | <0.001 | 83.9 | 1.17 (0.98, 1.39) | <0.001 | 80.1 | 1.11 (0.96, 1.30) | <0.001 | 70.5 | 1.31 (1.03, 1.65) | <0.001 | 83.7 | 1.21 (1.03, 1.42) | <0.001 | 76.1 | |
| Asian | 10 | 1.11 (1.00, 1.22) | 0.091 | 39.9 | 1.13 (1.02, 1.26) | 0.566 | <0.1 | 1.10 (0.99, 1.23) | 0.829 | <0.1 | 1.24 (1.00, 1.54) | 0.063 | 44.4 | 1.17 (0.96, 1.43) | 0.041 | 48.7 | |
| African | 2 | 1.17 (0.81, 1.68) | 0.910 | <0.1 | 1.35 (0.14, 13.32) | 0.161 | 49.0 | 1.32 (0.09, 19.48) | 0.111 | 60.7 | 1.35 (0.15, 12.50) | 0.173 | 46.2 | 1.16 (0.78, 1.71) | 0.677 | <0.1 | |
| Mixed | 2 | 1.25 (1.19, 1.33) | 0.789 | <0.1 | 1.35 (1.23, 1.48) | 0.482 | <0.1 | 1.25 (1.13, 1.38) | 0.653 | <0.1 | 1.57 (1.40, 1.76) | 0.782 | <0.1 | 1.35 (1.23, 1.47) | 0.880 | <0.1 | |
| Source of control | |||||||||||||||||
| PB | 16 | 1.12 (1.03, 1.21) | <0.001 | 78.3 | 1.16 (1.03, 1.31) | <0.001 | 73.3 | 1.13 (1.02, 1.25) | 0.001 | 60.2 | 1.27 (1.08, 1.49) | <0.001 | 77.2 | 1.18 (1.06, 1.32) | <0.001 | 66.8 | |
| HB | 11 | 1.18 (1.02, 1.37) | 0.001 | 66.1 | 1.20 (0.99, 1.47) | 0.021 | 52.3 | 1.12 (0.95, 1.32) | 0.179 | 27.9 | 1.44 (1.02, 2.03) | <0.001 | 70.1 | 1.29 (1.02, 1.64) | 0.002 | 63.2 | |
| Method of genotype | |||||||||||||||||
| TaqMan | 9 | 1.24 (1.12, 1.36) | 0.193 | 28.3 | 1.32 (1.13, 1.53) | 0.215 | 25.8 | 1.23 (1.05, 1.45) | 0.209 | 26.4 | 1.61 (1.26, 2.05) | 0.076 | 43.7 | 1.34 (1.12, 1.59) | 0.099 | 40.2 | |
| PCR-RFLP | 9 | 1.02 (0.88, 1.19) | <0.001 | 79.1 | 1.09 (0.90, 1.32) | 0.001 | 68.7 | 1.11 (0.95, 1.30) | 0.060 | 46.5 | 1.05 (0.78, 1.43) | <0.001 | 78.8 | 1.02 (0.81, 1.29) | <0.001 | 74.2 | |
| Illumina 1M chip | 2 | 1.34 (1.14, 1.57) | 0.262 | 20.7 | 1.37 (0.94, 2.01) | 0.121 | 58.3 | 1.23 (0.85, 1.78) | 0.151 | 51.5 | 1.87 (1.42, 2.45) | 0.345 | <0.1 | 1.54 (1.24, 1.91) | 0.855 | <0.1 | |
| iPLEX | 5 | 1.06 (0.89, 1.27) | <0.001 | 80.1 | 1.01 (0.80, 1.27) | 0.012 | 69.0 | 0.95 (0.79, 1.13) | 0.130 | 43.8 | 1.14 (0.80, 1.63) | 0.001 | 79.5 | 1.16 (0.89, 1.52) | 0.004 | 73.5 | |
| GWAS | 2 | 1.18 (1.01, 1.37) | 0.028 | 79.2 | 1.28 (1.08, 1.51) | 0.115 | 59.8 | 1.24 (1.13, 1.36) | 0.441 | <0.1 | 1.37 (1.00, 1.88) | 0.025 | 80.2 | 1.21 (0.95, 1.54) | 0.041 | 76.0 | |
| rs1447295 c>A | A vs C | (AC+AA) vs CC | AC vs CC | AA vs CC | AA vs (AC+CC) | ||||||||||||
| All | 27 | 1.25 (1.13, 1.39) | <0.001 | 78.6 | 1.29 (1.14, 1.45) | <0.001 | 77.5 | 1.27 (1.13, 1.43) | <0.001 | 75.9 | 1.40 (1.07, 1.82) | <0.001 | 62.1 | 1.36 (1.09, 1.69) | 0.005 | 46.5 | |
| Ethnicity | |||||||||||||||||
| Asian | 11 | 1.42 (1.29, 1.57) | 0.464 | <0.1 | 1.52 (1.32, 1.76) | 0.163 | 29.7 | 1.49 (1.26, 1.76) | 0.058 | 43.9 | 1.64 (1.21, 2.23) | 0.510 | <0.1 | 1.51 (1.12, 2.03) | 0.817 | <0.1 | |
| Caucasian | 12 | 1.23 (1.03, 1.46) | <0.001 | 86.0 | 1.22 (1.01, 1.49) | <0.001 | 85.9 | 1.20 (0.99, 1.46) | <0.001 | 84.8 | 1.52 (0.92, 2.50) | <0.001 | 69.3 | 1.61 (1.10, 2.36) | 0.036 | 47.0 | |
| African | 4 | 0.97 (0.86, 1.08) | 0.508 | <0.1 | 0.97 (0.83, 1.14) | 0.549 | <0.1 | 0.99 (0.84, 1.17) | 0.545 | <0.1 | 0.91 (0.71, 1.17) | 0.401 | <0.1 | 0.92 (0.72, 1.17) | 0.383 | 1.9 | |
| Source of control | |||||||||||||||||
| PB | 15 | 1.32 (1.20, 1.45) | 0.005 | 55.3 | 1.37 (1.23, 1.54) | 0.004 | 55.8 | 1.36 (1.21, 1.52) | 0.004 | 56.1 | 1.52 (1.16, 1.99) | 0.083 | 35.8 | 1.46 (1.17, 1.83) | 0.211 | 21.8 | |
| HB | 12 | 1.16 (0.91, 1.47) | <0.001 | 86.7 | 1.13 (0.85, 1.51) | <0.001 | 86.5 | 1.12 (0.84, 1.49) | <0.001 | 85.1 | 1.25 (0.74, 2.08) | <0.001 | 73.1 | 1.27 (0.85, 1.90) | 0.006 | 57.8 | |
| Method of genotype | |||||||||||||||||
| PCR-RFLP | 8 | 1.11 (0.79, 1.56) | <0.001 | 87.5 | 0.98 (0.63, 1.53) | <0.001 | 88.9 | 0.93 (0.59, 1.46) | <0.001 | 88.7 | 1.33 (0.55, 3.18) | <0.001 | 75.9 | 1.63 (0.97, 2.75) | 0.112 | 40.1 | |
| TaqMan | 14 | 1.25 (1.11, 1.40) | <0.001 | 70.7 | 1.31 (1.16, 1.48) | <0.001 | 64.4 | 1.31 (1.17, 1.48) | 0.002 | 59.4 | 1.27 (0.92, 1.75) | 0.003 | 58.4 | 1.20 (0.89, 1.62) | 0.006 | 55.3 | |
| iPLEX | 4 | 1.52 (1.08, 2.14) | <0.001 | 83.5 | 1.59 (1.13, 2.24) | 0.005 | 76.6 | 1.54 (1.13, 2.10) | 0.021 | 69.3 | 1.89 (0.94, 3.79) | 0.052 | 61.2 | 1.64 (0.88, 3.06) | 0.092 | 53.4 | |
| Illumina 1M chip | 1 | 1.20 (0.84, 1.71) | - | - | 1.16 (0.76, 1.77) | - | - | 1.09 (0.71, 1.69) | - | - | 1.78 (0.64, 4.96) | - | - | 1.73 (0.62, 4.77) | - | - | |
| rs16901979 C>A | A vs C | (AC+AA) vs CC | AC vs CC | AA vs CC | AA vs (AC+CC) | ||||||||||||
| All | 11 | 1.30 (1.20, 1.40) | 0.117 | 35.3 | 1.42 (1.27, 1.58) | 0.125 | 34.2 | 1.36 (1.21, 1.52) | 0.147 | 31.5 | 1.64 (1.39, 1.92) | 0.519 | <0.1 | 1.36 (1.18, 1.57) | 0.514 | <0.1 | |
| Ethnicity | |||||||||||||||||
| African | 5 | 1.29 (1.17, 1.42) | 0.351 | 9.7 | 1.45 (1.25, 1.68) | 0.661 | <0.1 | 1.37 (1.17, 1.60) | 0.674 | <0.1 | 1.64 (1.36, 1.97 ) | 0.314 | 15.8 | 1.33 (1.14, 1.56) | 0.158 | 39.4 | |
| Asian | 5 | 1.27 (1.11, 1.46) | 0.057 | 56.3 | 1.33 (1.12, 1.58) | 0.027 | 63.6 | 1.28 (1.06, 1.53) | 0.040 | 60.2 | 1.65 (1.19, 2.29) | 0.367 | 7.0 | 1.48 (1.07, 2.03) | 0.679 | <0.1 | |
| Caucasian | 1 | 1.83 (1.10, 3.04) | - | - | 1.91 (1.13, 3.24) | - | - | 1.95 (1.14, 3.34) | - | - | 1.05 (0.07, 16.82) | - | - | 1.00 (0.06, 16.00) | - | - | |
| Source of control | |||||||||||||||||
| PB | 1.28 (1.14, 1.42) | 0.066 | 58.3 | 1.46 (1.24, 1.72) | 0.144 | 44.5 | 1.41 (1.19, 1.68) | 0.220 | 32.1 | 1.57 (1.25, 1.97) | 0.245 | 27.8 | 1.26 (1.03, 1.54) | 0.230 | 30.3 | ||
| HB | 1.31 (1.18, 1.46) | 0.232 | 25.8 | 1.39 (1.20, 1.61) | 0.144 | 37.3 | 1.31 (1.12, 1.53) | 0.136 | 38.4 | 1.71 (1.36, 2.15) | 0.595 | <0.1 | 1.47 (1.20, 1.80) | 0.726 | <0.1 | ||
| Method of genotype | |||||||||||||||||
| TaqMan | 6 | 1.35 (1.22, 1.49) | 0.551 | <0.1 | 1.46 (1.27, 1.69) | 0.585 | <0.1 | 1.37 (1.17, 1.59) | 0.518 | <0.1 | 1.77 (1.44, 2.18) | 0.724 | <0.1 | 1.49 (1.24, 1.78) | 0.729 | <0.1 | |
| iPLEX | 3 | 1.29 (1.12, 1.48) | 0.033 | 70.6 | 1.56 (1.28, 1.91) | 0.146 | 48.0 | 1.57 (1.27, 1.94) | 0.346 | 5.9 | 1.50 (1.12, 2.01) | 0.114 | 53.9 | 1.15 (0.90, 1.48) | 0.172 | 43.2 | |
| Illumina 1M chip | 1 | 0.97 (0.72, 1.32) | - | - | 0.86 (0.58, 1.29) | - | - | 0.81 (0.53, 1.23) | - | - | 1.19 (0.57, 2.47) | - | - | 1.32 (0.66, 2.66) | - | - | |
| PCR-RFLP | 1 | 1.13 (0.76, 1.66) | - | - | 1.14 (0.69, 1.90) | - | - | 1.11 (0.66, 1.89) | - | - | 1.34 (0.49, 3.65) | - | - | 1.27 (0.48, 3.34) | - | - | |
| rs6983561 A>C | C vs A | (AC+CC) vs AA | AC vs AA | CC vs AA | CC vs (AC+AA) | ||||||||||||
| All | 7 | 1.41 (1.27, 1.57) | 0.311 | 15.6 | 1.50 (1.31, 1.71) | 0.248 | 23.7 | 1.42 (1.23, 1.63) | 0.186 | 31.7 | 1.93 (1.50, 2.49) | 0.923 | <0.1 | 1.64 (1.30, 2.08) | 0.943 | <0.1 | |
| Ethnicity | |||||||||||||||||
| Asian | 5 | 1.37 (1.21, 1.56) | 0.406 | <0.1 | 1.41 (1.20, 1.67) | 0.216 | 30.9 | 1.32 (1.11, 1.57) | 0.225 | 29.5 | 2.02 (1.48, 2.76) | 0.826 | <0.1 | 1.77 (1.30, 2.39) | 0.948 | <0.1 | |
| African | 1 | 1.33 (1.05, 1.68) | - | - | 1.46 (1.00, 2.13) | - | - | 1.35 (0.90, 2.02) | - | - | 1.70 (1.07, 2.70) | - | - | 1.41 (0.96, 2.08) | - | - | |
| Caucasian | 1 | 1.77 (1.34, 2.34) | - | - | 1.80 (1.35, 2.40) | - | - | 1.78 (1.33, 2.38) | - | - | 2.57 (0.50, 13.28) | - | - | 2.45 (0.47, 12.65) | - | - | |
| Source of control | |||||||||||||||||
| PB | 5 | 1.48 (1.30, 1.69) | 0.227 | 29.3 | 1.58 (1.35, 1.85) | 0.208 | 32.0 | 1.51 (1.28, 1.78) | 0.184 | 35.6 | 2.07 (1.46, 2.94) | 0.816 | <0.1 | 1.77 (1.26, 2.49) | 0.930 | <0.1 | |
| HB | 2 | 1.30 (1.09, 1.55) | 0.776 | <0.1 | 1.32 (1.03, 1.69) | 0.467 | <0.1 | 1.20 (0.92, 2.57) | 0.454 | <0.1 | 1.77 (1.22, 2.58) | 0.765 | <0.1 | 1.53 (1.10, 2.12) | 0.481 | <0.1 | |
| Method of genotype | |||||||||||||||||
| PCR-HRM | 2 | 1.25 (1.03, 1.53) | 0.959 | <0.1 | 1.20 (0.94, 1.54) | 0.955 | <0.1 | 1.10 (0.84, 1.42) | 0.959 | <0.1 | 1.89 (1.17, 3.05) | 0.951 | <0.1 | 1.82 (1.14, 2.89) | 0.961 | <0.1 | |
| TaqMan | 2 | 1.36 (1.15, 1.61) | 0.755 | <0.1 | 1.50 (1.18, 1.90) | 0.865 | <0.1 | 1.41 (1.10, 1.81) | 0.791 | <0.1 | 1.79 (1.25, 2.55) | 0.739 | <0.1 | 1.48 (1.08, 2.02) | 0.703 | <0.1 | |
| PCR-RFLP | 2 | 1.56 (1.25, 1.96) | 0.110 | 60.8 | 1.64 (1.28, 2.11) | 0.192 | 41.2 | 1.62 (1.26, 2.09) | 0.176 | 45.4 | 1.76 (0.77, 4.07) | 0.591 | <0.1 | 1.64 (0.73, 3.70) | 0.569 | <0.1 | |
| iPLEX | 1 | 1.80 (1.30, 2.48) | - | - | 2.11 (1.40, 3.17) | - | - | 1.95 (1.27, 2.99) | - | - | 3.12 (1.37, 7.10) | - | - | 2.26 (1.02, 5.02) | - | - | |
| rs10090154 C>T | T vs C | (CT+TT) vs CC | CT vs CC | TT vs CC | TT vs (CT+CC) | ||||||||||||
| All | 8 | 1.46 (1.28, 1.67) | 0.342 | 11.4 | 1.62 (1.40, 1.88) | 0.502 | <0.1 | 1.66 (1.42, 1.93) | 0.624 | <0.1 | 1.18 (0.72, 1.93) | 0.585 | <0.1 | 1.02 (0.62, 1.66) | 0.607 | <0.1 | |
| Ethnicity | |||||||||||||||||
| Caucasian | 2 | 1.67 (1.30, 2.13) | 0.079 | 67.6 | 1.78 (1.37, 2.33) | 0.175 | 45.7 | 1.80 (1.37, 2.36) | 0.320 | <0.1 | 1.43 (0.45, 4.57) | 0.049 | 74.2 | 1.28 (0.40, 4.11) | 0.050 | 73.9 | |
| Asian | 4 | 1.48 (1.22, 1.80) | 0.592 | <0.1 | 1.67 (1.34, 2.09) | 0.549 | <0.1 | 1.70 (1.35, 2.13) | 0.529 | <0.1 | 1.35 (0.66, 2.76) | 0.893 | <0.1 | 1.11 (0.55, 2.27) | 0.917 | <0.1 | |
| African | 2 | 1.22 (0.93, 1.59) | 0.728 | <0.1 | 1.34 (0.99, 1.83) | 0.510 | <0.1 | 1.40 (1.02, 1.93) | 0.415 | <0.1 | 0.87 (0.36, 2.08) | 0.450 | <0.1 | 0.79 (0.33, 1.88) | 0.394 | <0.1 | |
| Source of control | |||||||||||||||||
| PB | 7 | 1.53 (1.32, 1.78) | 0.449 | <0.1 | 1.71 (1.45, 2.01) | 0.660 | <0.1 | 1.74 (1.47, 2.06) | 0.769 | <0.1 | 1.24 (0.70, 2.22) | 0.480 | <0.1 | 1.05 (0.59, 1.87) | 0.492 | <0.1 | |
| HB | 1 | 1.18 (0.87, 1.61) | - | - | 1.26 (0.89, 1.81) | - | - | 1.30 (0.90, 1.88) | - | - | 1.02 (0.39, 2.63) | - | - | 0.94 (0.37, 2.42) | - | - | |
| Method of genotype | |||||||||||||||||
| TaqMan | 4 | 1.45 (1.21, 1.73) | 0.115 | 49.4 | 1.59 (1.30, 1.94) | 0.252 | 26.6 | 1.63 (1.32, 2.00) | 0.391 | <0.1 | 1.04 (0.52, 2.06) | 0.199 | 35.6 | 0.93 (0.47, 1.86) | 0.190 | 37.0 | |
| PCR-RFLP | 2 | 1.47 (1.13, 1.89) | 0.525 | <0.1 | 1.64 (1.23, 2.20) | 0.572 | <0.1 | 1.67 (1.24, 2.24) | 0.624 | <0.1 | 1.21 (0.38, 3.80) | 0.518 | <0.1 | 1.02 (0.33, 3.19) | 0.537 | <0.1 | |
| PCR-HRM | 1 | 1.19 (0.73, 1.92) | - | - | 1.26 (0.73, 2.20) | - | - | 1.28 (0.73, 2.23) | - | - | 0.85 (0.05, 13.89) | - | - | 0.78 (0.05, 12.61) | - | - | |
| iPLEX | 1 | 1.74 (1.19, 2.55) | - | - | 2.05 (1.31, 3.20) | - | - | 2.15 (1.34, 3.46) | - | - | 1.54 (0.57, 4.12) | - | - | 1.24 (0.47, 3.29) | - | - | |
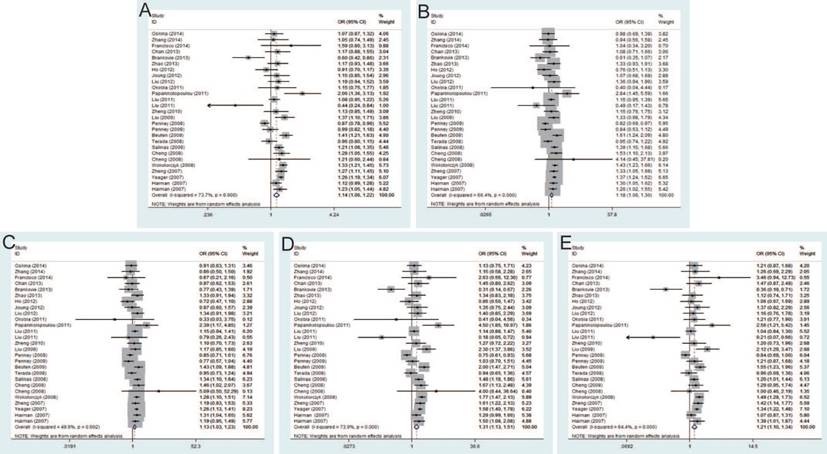
Rs6983267 T>G and PCa risk
Twenty-seven studies that met the inclusion criteria were retrieved, including 21,351 PCa cases and 17,190 controls. The pooled risk estimates indicated the significant association between rs6983267 T>G and PCa susceptibility under allele model (OR=1.14, 95% CI=1.06-1.22), dominant model (OR=1.18, 95% CI=1.06-1.30), heterozygous model (OR=1.13, 95% CI=1.03-1.23), homozygous model (OR=1.31, 95% CI=1.13-1.51) and recessive model (OR=1.21, 95% CI=1.10-1.34) (Figure 2). Furthermore, when stratified by ethnicity, the results were significant in both Caucasians and Asians. In the subgroup by source of control, the results were significant in both population-based controls and hospital-based controls. In addition, stratification analysis by genotypic method showed the significant association with PCa risk only in TaqMan under all genetic models, while no significant association was found using PCR-RFLP and iPLEX method.
Forest plot of the association between the rs6983267 T>G and prostate cancer risk. A: allele model; B: dominant model; C: heterozygote model; D: homozygote model; E: recessive model.
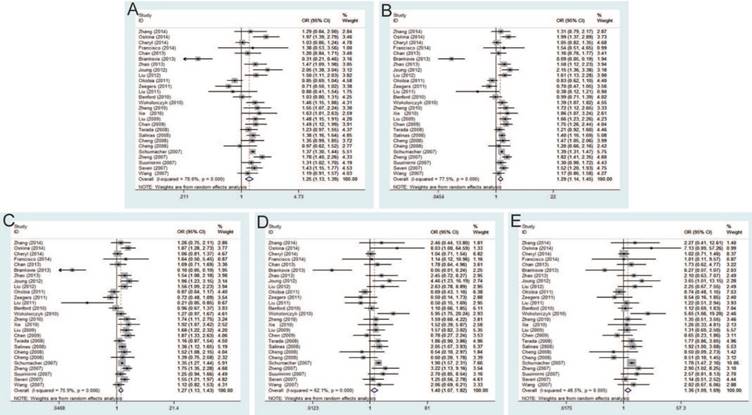
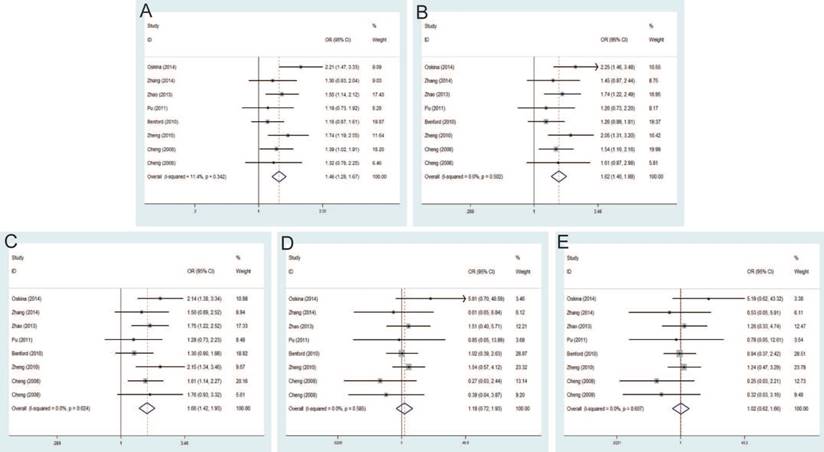
Rs1447295 C>A and PCa risk
The current meta-analysis includes 22,142 PCa cases and 22,294 controls from a total of twenty-seven case-control studies on rs1447295 C>A polymorphism and PCa risk. The pooled ORs of these studies were 1.25 (95% CI: 1.13-1.39) for allele model, 1.29 (95% CI: 1.14-1.45) for dominant model, 1.27 (95% CI: 1.13-1.43) for homozygote model, 1.40 (95% CI: 1.07-1.82) for heterozygote model and 1.36 (95% CI: 1.09-1.69) for recessive model, which indicated a strong association between rs1447295 mutation and the susceptibility to PCa (Figure 3). Moreover, in the subgroup by ethnicity, significant associations were observed in Asian population and Caucasian population. For the subgroup by source of control, the result was significant only in population-based controls under all genetic models, while no significant result was found in hospital-based controls. The significant association was more prominent among these studies using iPLEX than TaqMan under most of genetic models (e.g. iPLEX with allele model (OR=1.52, 95% CI=1.08-2.14); dominant model (OR=1.59, 95% CI=1.13-2.24); and heterogeneity model (OR=1.54, 95% CI=1.13-2.10) vs. TaqMan with allele model (OR=1.25, 95% CI=1.11-1.40); dominant model (OR=1.31, 95% CI=1.16-1.48); and heterogeneity model (OR=1.31, 95% CI=1.17-1.48).
Forest plot of the association between the rs1447295 C>A and prostate cancer risk. A: allele model; B: dominant model; C: heterozygote model; D: homozygote model; E: recessive model.
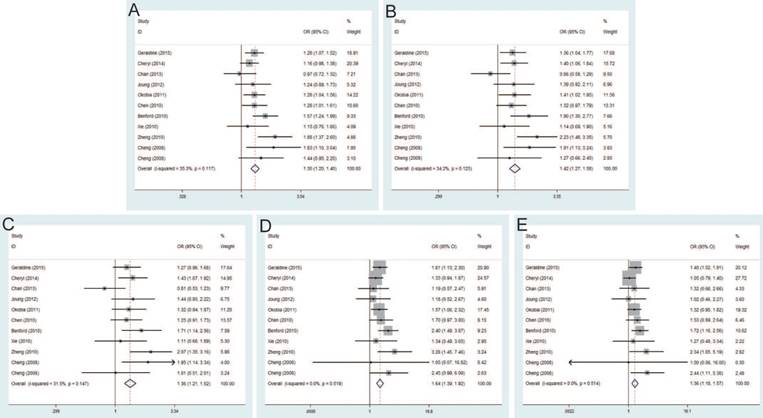
Rs16901979 C>A and PCa risk
Significant differences were found between rs16901979 C>A polymorphism and susceptibility of PCa under allele model (OR=1.30, 95% CI=1.20-1.40), dominant model (OR=1.42, 95% CI=1.27-1.58), heterozygous model (OR=1.36, 95% CI=1.21-1.52), homozygous model (OR=1.64, 95% CI=1.39-1.92), recessive model (OR=1.36, 95% CI=1.18-1.57) (Figure 4). In the stratification analysis by ethnicity, the significant PCa risk effects were observed in African, Asian, Caucasian population under all genetic models. Besides, when stratified by source of control, the positive results were detected in population-based controls and hospital-based controls. In addition, in the subgroup analysis by genotypic method, the results of studies were significant in TaqMan and iPLEX rather than Illumina 1M chip and PCR-RFLP.
Forest plot of the association between the rs16901979 C>A and prostate cancer risk. A: allele model; B: dominant model; C: heterozygote model; D: homozygote model; E: recessive model.
Rs6983561 A>C and PCa risk
Seven studies that met the inclusion criteria were retrieved, including 2,666 PCa cases and 2,855 controls. Significant association between rs6983561 A>C and PCa risk was observed by the pooled risk estimates under allele model (OR=1.41, 95% CI=1.27-1.57), dominant model (OR=1.50, 95% CI=1.31-1.71), heterozygous model (OR=1.42, 95% CI=1.23-1.63), homozygous model (OR=1.93, 95% CI=1.50-2.49) and recessive model (OR=1.64, 95% CI=1.30-2.08) (Figure 5). For subgroups by ethnicity, the results of these studies in Asians indicated the significant association with PCa risk under all genetic models. Similarly, stratified analysis by source of control detected a significant association in both population-based controls and hospital-based controls. Moreover, since all of the study number less than three for genotypic method, further analysis is not necessary.
Forest plot of the association between the rs6983561 A>C and prostate cancer risk. A: allele model; B: dominant model; C: heterozygote model; D: homozygote model; E: recessive model.
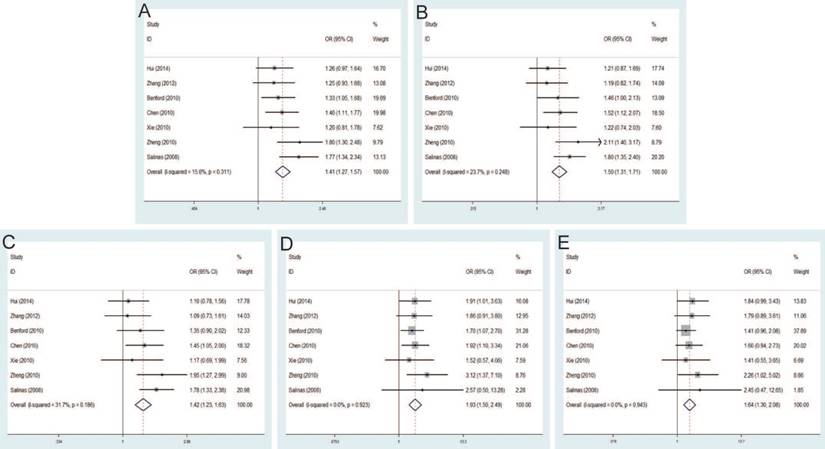
Rs10090154 C>T and PCa risk
The pooled risk estimates indicated the significant association between rs10090154 C>T and the risk of PCa under allele model (OR=1.46, 95% CI=1.28-1.67), dominant model (OR=1.62, 95% CI=1.40-1.88), heterozygous model (OR=1.66, 95% CI=1.42-1.93). However, no significant association was found under homozygous model (OR=1.18, 95% CI=0.72-1.93), recessive model (OR=1.02, 95% CI=0.62-1.66) (Figure 6). Stratification analyses by ethnicity also detected that rs10090154 polymorphism increased PCa risk in Asians and Caucasians. Besides, increased PCa susceptibility associated with rs10090154 was observed only in population-based studies. Stratification analyses by genotypic method found that the meta-analysis results were significant in TaqMan, PCR-RFLP and iPLEX method, instead of PCR-HRM.
Forest plot of the association between the rs10090154 C>T and prostate cancer risk. A: allele model; B: dominant model; C: heterozygote model; D: homozygote model; E: recessive model.
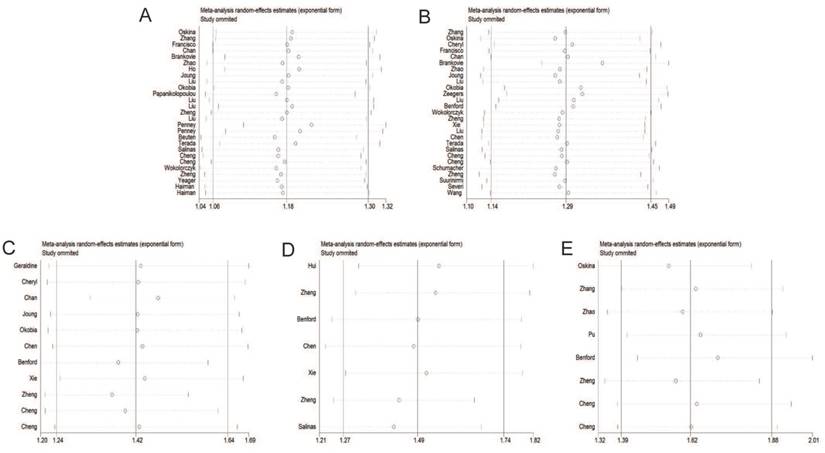
Sensitivity analysis
Individual studies were consecutively omitted in the sensitivity analysis to detect the influence of each study on the pooled OR. The sensitivity analysis for the results of 8q24 genetic polymorphisms and PCa risk demonstrated that the obtained results were statistically robust and no individual study affected the pooled OR significantly (Figure 7).
Sensitivity analysis under the dominant model. A: rs6983267 T>G; B: rs1447295 C>A; C: rs16901979 C>A; D: rs6983561 A>C; E: rs10090154 C>T.
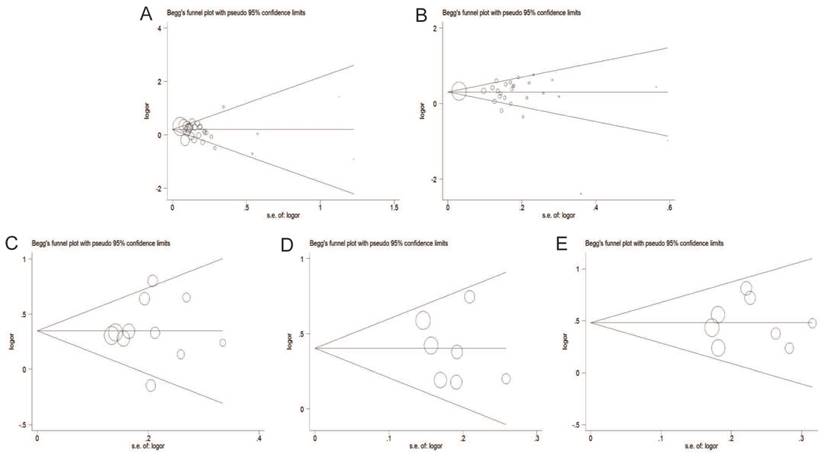
Publication bias
The Begg's funnel plot and Egger's test were adopted to evaluate the publication bias of articles in this meta-analysis. As illustrated in Figure 8, the shapes of funnel plot were symmetric, suggesting that there was no evidence of publication bias under dominant model in this meta-analysis. Therefore, our results were reliable according to the included articles.
Begg's funnel plot of publication bias test under the dominant model. A: rs6983267 T>G; B: rs1447295 C>A; C: rs16901979 C>A; D: rs6983561 A>C; E: rs10090154 C>T.
Discussion
Chromosomal region 8q24 is a risk locus for a wide spectrum of cancers, and it is a risk region for PCa which has been investigated extensively. On the basis of racial differences and the fine-mapping study, 8q24 region contains at least three independent risk regions for PCa. Region 1 (126.54-128.62 Mb) was initially identified through a study of Icelandic families, which indicated that this region might confer risk of PCa and contribute to a higher incidence of PCa in Africa-American men than men of European ancestry [14]. Region 2 (128.14-128.28 Mb) contains a 14-SNP haplotype that efficiently tags a relatively uncommon (2-4%) susceptibility variant in individuals of European descent, which happens to be very common (42%) in Africa-American [54]. And region 3 (128.47-128.54 Mb) is defined as a recombination hot-spot among European Americans [47, 55]. Moreover, 8q24 is considered as a gene-free region, flanked by the FAM84B and MYC genes on the centromeric and telomeric ends respectively [55]. Though its biological significance in PCa is still unclear, some evidence in vitro and vivo experiments indicated that risk loci at 8q24 might be tissue-specific enhancers of MYC [15]. Especially, rs6983267 represents Region 1/Block 4 at 8q24 could be associated with MYC expression and CARLo-5, one of the long noncoding RNAs (CARLos) in the 8q24 region, is significantly related to the rs6983267 allele associated with increased cancer susceptibility [56]. However, their association with MYC expression in PCa is not conclusive and others failed to find clear association between rs6983267 genotype and MYC expression. Hence, more significant studies should be conducted to explore the function of these risk loci in the development of PCa.
Although previous meta-analysis has explored the associations between these 8q24 polymorphisms and PCa risk, we conducted a more detailed analysis with a larger sample size that included the most up-to-date research. To the best of our knowledge, this is the largest meta-analysis containing 80 studies to investigate associations between the selected 8q24 polymorphisms and PCa risk. During the past few years, many case-control studies have demonstrated the strong associations of 8q24 polymorphisms with the susceptibility to PCa. Nevertheless, the findings were controversial [2,4-6]. For example, no significant association between rs6983267 polymorphism at 8q24 and PCa risk was found reported by Ren et al. [57]. However, Li et al. suggested that there is a significant PCa risk associated with the rs6983267 polymorphism at 8q24 [16]. As a powerful tool, meta-analysis was performed to provide a more comprehensive understanding of such associations compared to a single study, especially in analyzing unexplained studies. We took advantages of meta-analysis to prove the associations between 8q24 polymorphisms with PCa. According to quantitative synthesis results, all selected 8q24 polymorphisms (rs6983267 T>G, rs1447295 C>A, rs16901979 C>A, rs6983561 A>C and rs10090154 C>T) were found significant associations with PCa risk under the most assumed genetic models in this meta-analysis.
When stratified by ethnicity, significant association was found between all selected risk loci and PCa risk in Asians. Studies in Caucasians found significant association between rs6983267 T>G and rs1447295 C>A polymorphisms and PCa risk. Meanwhile, significant association between the rs16901979 C>A polymorphism and PCa risk was found in Africans, but as for rs1447295 C>A, the result is contrary, which is consistent with the results as reported by Okobia et al. [58]. The ethnic-specific findings indicated that racial differences might have a relationship with the association between 8q24 polymorphisms and the susceptibility of PCa [59]. Though the exact mechanism was unclear, it was likely that different ethnic groups with various genetic backgrounds might have different gene polymorphisms risk in the development of PCa. The observation of highly variable PCa rates by ethnicities provided benefits to disease gene detection [60]. However, the related articles to explain these genetic differences were still scarce. More studies should be undertaken to investigate evolutionary and population genetics relationships across ethnicities.
In the subgroup analysis by source of controls, rs1447295 C>A polymorphism showed significant association with PCa risk in the population-based control studies under all genetic models. While, no significant results were found in the hospital-based control studies under all genetic models. The possible reason might be that hospital-based controls might not have the similar representativeness of general populations. Meanwhile, when we selected the controls from hospitals, inherent selection biases might happen inevitably. Especially, the risk factors of PCa susceptibility were complex. Some ignored risk factors might interfere the results of this meta-analysis.
After stratified analysis by method of genotype, the significant results were observed in these studies using TaqMan method for all selected risk loci, while no significant results were found in these studies by PCR-RFLP method for rs6983267 T>G, rs1447295 C>A and rs16901979 C>A polymorphisms. One possible reason for these discrepancies was that different genotypic methods had their own benefits in diverse aspects, which might lead to different statistical results. PCR-RFLP, as a traditional detecting technology of genetic polymorphisms, can only detect part of the SNP, which makes sequencing time-consuming and laborious. Besides, the two-level structure of DNA chain is also likely to cause artificial false and sequencing result deviation [61, 62]. However, the advantages of TaqMan are that since the reaction is carried out in the PCR process, the separation and elution process is not needed, thus reducing the possibility of PCR pollution [62]. Accordingly, only applying the same appropriate genotypic method would make the results more significant and reliable in the detection of the selected genetic polymorphisms.
To a certain extent, several limitations of this meta-analysis should be considered. (1) Some published studies involved in the 8q24 polymorphisms are not accord with the HWE, resulting in potential bias during control selection or genotypic errors; (2) The number of included studies in the stratified analyses was relatively small. Though we did not make further discussion in the subgroups with less than three studies to avoid the false associations, it might potentially also limit the enough statistical power to explore the real relationship; (3) Adjusted estimates could not be conducted in this meta-analysis. Due to inadequate information, we failed to adjust estimates by other covariates, such as age, obesity, smoking, lifestyle and so on; (4) PCa is a multifactorial disease and complex interactions between genetic and environment factors, which may affect the occurrence and development of PCa. The investigation of single gene region cannot interpret the association of PCa risk comprehensively. Therefore, more attention should be paid to interactions of SNP-SNP, gene-gene, and gene-environment in future large multicentric studies.
Conclusion
In summary, the results of this meta-analysis suggested that five 8q24 polymorphisms (rs6983267 T>G, rs1447295 C>A, rs16901979 C>A, rs6983561 A>C and rs10090154 C>T) had strong associations with the susceptibility to PCa. Therefore, the 8q24 polymorphisms might be considered the ideal markers in PCa diagnosis and therapy, which is worthy to exploring extensively in the subsequent studies. In addition, more high-quality and multicentric studies with larger sample sizes are needed to confirm these real associations.
Acknowledgements
This work is supported by the grant from National Natural Science Foundation of China (81370781, 81670608, 81600514).
Competing Interests
The authors have declared that no competing interest exists.
References
1. Siegel RL, Miller KD, Jemal A. Cancer Statistics, 2017. CA Cancer J Clin. 2017;67:7-30
2. Bashir MN. Epidemiology of Prostate Cancer. Asian Pac J Cancer Prev. 2015;16:5137-5141
3. Perdana NR, Mochtar CA, Umbas R, Hamid AR. The Risk Factors of Prostate Cancer and Its Prevention: A Literature Review. Acta Med Indones. 2016;48:228-238
4. Oskina NA, Boyarskikh UA, Lazarev AF, Petrova VD, Ganov DI, Tonacheva OG. et al. A replication study examining association of rs6983267, rs10090154, and rs1447295 common single nucleotide polymorphisms in 8q24 region with prostate cancer in Siberians. Urol Oncol. 2014;32:37
5. Cropp CD, Robbins CM, Sheng X, Hennis AJ, Carpten JD, Waterman L. et al. 8q24 risk alleles and prostate cancer in African-Barbadian men. PROSTATE. 2014;74:1579-1588
6. Cancel-Tassin G, Romana M, Gaffory C, Blanchet P, Cussenot O, Multigner L. Region 2 of 8q24 is associated with the risk of aggressive prostate cancer in Caribbean men of African descent from Guadeloupe (French West Indies). ASIAN J ANDROL. 2015;17:117-119
7. Shi J, Zhang Y, Zheng W, Michailidou K, Ghoussaini M, Bolla MK. et al. Fine-scale mapping of 8q24 locus identifies multiple independent risk variants for breast cancer. INT J CANCER. 2016;139:1303-1317
8. Teerlink CC, Leongamornlert D, Dadaev T, Thomas A, Farnham J, Stephenson RA. et al. Genome-wide association of familial prostate cancer cases identifies evidence for a rare segregating haplotype at 8q24.21. HUM GENET. 2016;135:923-938
9. Wang M, Chu H, Lv Q, Wang L, Yuan L, Fu G. et al. Cumulative effect of genome-wide association study-identified genetic variants for bladder cancer. INT J CANCER. 2014;135:2653-2660
10. Jiang K, Sun Y, Wang C, Ji J, Li Y, Ye Y. et al. Genome-wide association study identifies two new susceptibility loci for colorectal cancer at 5q23.3 and 17q12 in Han Chinese. ONCOTARGET. 2015;6:40327-40336
11. Iwakawa R, Takenaka M, Kohno T, Shimada Y, Totoki Y, Shibata T. et al. Genome-wide identification of genes with amplification and/or fusion in small cell lung cancer. Genes Chromosomes Cancer. 2013;52:802-816
12. Earp M, Winham SJ, Larson N, Permuth JB, Sicotte H, Chien J. et al. A targeted genetic association study of epithelial ovarian cancer susceptibility. ONCOTARGET. 2016;7:7381-7389
13. Zhang M, Wang Z, Obazee O, Jia J, Childs EJ, Hoskins J. et al. Three new pancreatic cancer susceptibility signals identified on chromosomes 1q32.1, 5p15.33 and 8q24.21. ONCOTARGET. 2016;7:66328-66343
14. Amundadottir LT, Sulem P, Gudmundsson J, Helgason A, Baker A, Agnarsson BA. et al. A common variant associated with prostate cancer in European and African populations. NAT GENET. 2006;38:652-658
15. Grampp S, Platt JL, Lauer V, Salama R, Kranz F, Neumann VK. et al. Genetic variation at the 8q24.21 renal cancer susceptibility locus affects HIF binding to a MYC enhancer. NAT COMMUN. 2016;7:13183
16. Li Q, Liu X, Hua RX, Wang F, An H, Zhang W. et al. Association of three 8q24 polymorphisms with prostate cancer susceptibility: evidence from a meta-analysis with 50,854 subjects. Sci Rep. 2015;5:12069
17. Du M, Tillmans L, Gao J, Gao P, Yuan T, Dittmar RL. et al. Chromatin interactions and candidate genes at ten prostate cancer risk loci. Sci Rep. 2016;6:23202
18. Zheng SL, Hsing AW, Sun J, Chu LW, Yu K, Li G. et al. Association of 17 prostate cancer susceptibility loci with prostate cancer risk in Chinese men. PROSTATE. 2010;70:425-432
19. Cheng I, Plummer SJ, Jorgenson E, Liu X, Rybicki BA, Casey G. et al. 8q24 and prostate cancer: association with advanced disease and meta-analysis. EUR J HUM GENET. 2008;16:496-505
20. Salinas CA, Kwon E, Carlson CS, Koopmeiners JS, Feng Z, Karyadi DM. et al. Multiple independent genetic variants in the 8q24 region are associated with prostate cancer risk. Cancer Epidemiol Biomarkers Prev. 2008;17:1203-1213
21. Zhang Z, Wang JY, Wei D, Shi L, Wang XM, Zhang YG. et al. Association study of 4 single nucleotide polymorphisms in 8q24 region and prostate cancer. Journal of Ningxia Medical University. 2014;36:608-614
22. San FI, Rojas PA, Torres-Estay V, Smalley S, Cerda-Infante J, Montecinos VP. et al. Association of RNASEL and 8q24 variants with the presence and aggressiveness of hereditary and sporadic prostate cancer in a Hispanic population. J CELL MOL MED. 2014;18:125-133
23. Hui J, Xu Y, Yang K, Liu M, Wei D, Wei D. et al. Study of genetic variants of 8q21 and 8q24 associated with prostate cancer in Jing-Jin residents in northern China. CLIN LAB. 2014;60:645-652
24. Brankovic AS, Brajuskovic GN, Mircetic JD, Nikolic ZZ, Kalaba PB, Vukotic VD. et al. Common variants at 8q24 are associated with prostate cancer risk in Serbian population. PATHOL ONCOL RES. 2013;19:559-569
25. Chan JY, Li H, Singh O, Mahajan A, Ramasamy S, Subramaniyan K. et al. 8q24 and 17q prostate cancer susceptibility loci in a multiethnic Asian cohort. Urol Oncol. 2013;31:1553-1560
26. Zhao CX, Liu M, Wang JY, Xu Y, Wei D, Yang K. et al. Association of 8 loci on chromosome 8q24 with prostate carcinoma risk in northern Chinese men. Asian Pac J Cancer Prev. 2013;14:6733-6738
27. Ho CK, Halley L, Wei J, Habib FK. Analysis of prostate cancer association with four single-nucleotide polymorphisms from genome-wide studies and serum phyto-estrogen concentrations. Prostate Cancer Prostatic Dis. 2012;15:365-368
28. Liu M, Wang J, Xu Y, Wei D, Shi X, Yang Z. Risk loci on chromosome 8q24 are associated with prostate cancer in northern Chinese men. J Urol. 2012;187:315-321
29. Joung JY, Park S, Yoon H, Lee SJ, Park WS, Seo HK. et al. Association of common variations of 8q24 with the risk of prostate cancer in Koreans and a review of the Asian population. BJU INT. 2012;110:E318-E325
30. Zhang YR, Wang JY, Shi XH, Liu M, Yang Z, Huo ZH. The association between EEFSEC, 8q24 and prostate cancer risk in Chinese Han Populations. Journal of Ningxia Medical University. 2012;34:981-985
31. Papanikolopoulou A, Landt O, Ntoumas K, Bolomitis S, Tyritzis SI, Constantinides C. et al. The multi-cancer marker, rs6983267, located at region 3 of chromosome 8q24, is associated with prostate cancer in Greek patients but does not contribute to the aggressiveness of the disease. CLIN CHEM LAB MED. 2011;50:379-385
32. Liu F, Hsing AW, Wang X, Shao Q, Qi J, Ye Y. et al. Systematic confirmation study of reported prostate cancer risk-associated single nucleotide polymorphisms in Chinese men. CANCER SCI. 2011;102:1916-1920
33. Zeegers MP, Khan HS, Schouten LJ, van Dijk BA, Goldbohm RA, Schalken J. et al. Genetic marker polymorphisms on chromosome 8q24 and prostate cancer in the Dutch population: DG8S737 may not be the causative variant. EUR J HUM GENET. 2011;19:118-120
34. Liu Y. et al. A study of relevance between single nucleotide polymorphism on 8q24 with prostate cancer risk in Chinese Tianjin Population. Master's dissertation. Tianjin Medical University. 2011
35. Okobia MN, Zmuda JM, Ferrell RE, Patrick AL, Bunker CH. Chromosome 8q24 variants are associated with prostate cancer risk in a high risk population of African ancestry. PROSTATE. 2011;71:1054-1063
36. Pu LM, Wei D, Liu M, Yang YG, Zhou L, Huang J. et al. The association between two single nucleotide polymorphisms and risk of prostate cancer in the northern Chinese population. China Oncology. 2011;21:688-695
37. Wokolorczyk D, Gliniewicz B, Stojewski M, Sikorski A, Zlowocka E, Debniak T. et al. The rs1447295 and DG8S737 markers on chromosome 8q24 and cancer risk in the Polish population. EUR J CANCER PREV. 2010;19:167-171
38. Chen M, Huang YC, Yang S, Hsu JM, Chang YH, Huang WJ. et al. Common variants at 8q24 are associated with prostate cancer risk in Taiwanese men. PROSTATE. 2010;70:502-507
39. Xie HJ. Association study between single nucleotide polymorphisms on 8q24 with prostate cancer risk in Chinese Han Population. Master's dissertation. Tianjin Medical University. 2010
40. Benford ML, VanCleave TT, Lavender NA, Kittles RA, Kidd LR. 8q24 sequence variants in relation to prostate cancer risk among men of African descent: a case-control study. BMC CANCER. 2010;10:334
41. Penney KL, Salinas CA, Pomerantz M, Schumacher FR, Beckwith CA, Lee GS. et al. Evaluation of 8q24 and 17q risk loci and prostate cancer mortality. CLIN CANCER RES. 2009;15:3223-3230
42. Beuten J, Gelfond JA, Martinez-Fierro ML, Weldon KS, Crandall AC, Rojas-Martinez A. et al. Association of chromosome 8q variants with prostate cancer risk in Caucasian and Hispanic men. CARCINOGENESIS. 2009;30:1372-1379
43. Liu M, Kurosaki T, Suzuki M, Enomoto Y, Nishimatsu H, Arai T. et al. Significance of common variants on human chromosome 8q24 in relation to the risk of prostate cancer in native Japanese men. BMC GENET. 2009;10:37
44. Chen M, Huang YC, Ko IL, Yang S, Chang YH, Huang WJ. et al. The rs1447295 at 8q24 is a risk variant for prostate cancer in Taiwanese men. UROLOGY. 2009;74:698-701
45. Terada N, Tsuchiya N, Ma Z, Shimizu Y, Kobayashi T, Nakamura E. et al. Association of genetic polymorphisms at 8q24 with the risk of prostate cancer in a Japanese population. PROSTATE. 2008;68:1689-1695
46. Wokolorczyk D, Gliniewicz B, Sikorski A, Zlowocka E, Masojc B, Debniak T. et al. A range of cancers is associated with the rs6983267 marker on chromosome 8. CANCER RES. 2008;68:9982-9986
47. Yeager M, Orr N, Hayes RB, Jacobs KB, Kraft P, Wacholder S. et al. Genome-wide association study of prostate cancer identifies a second risk locus at 8q24. NAT GENET. 2007;39:645-649
48. Haiman CA, Patterson N, Freedman ML, Myers SR, Pike MC, Waliszewska A. et al. Multiple regions within 8q24 independently affect risk for prostate cancer. NAT GENET. 2007;39:638-644
49. Schumacher FR, Feigelson HS, Cox DG, Haiman CA, Albanes D, Buring J. et al. A common 8q24 variant in prostate and breast cancer from a large nested case-control study. CANCER RES. 2007;67:2951-2956
50. Zheng SL, Sun J, Cheng Y, Li G, Hsu FC, Zhu Y. et al. Association between two unlinked loci at 8q24 and prostate cancer risk among European Americans. J Natl Cancer Inst. 2007;99:1525-1533
51. Suuriniemi M, Agalliu I, Schaid DJ, Johanneson B, McDonnell SK, Iwasaki L. et al. Confirmation of a positive association between prostate cancer risk and a locus at chromosome 8q24. Cancer Epidemiol Biomarkers Prev. 2007;16:809-814
52. Severi G, Hayes VM, Padilla EJ, English DR, Southey MC, Sutherland RL. et al. The common variant rs1447295 on chromosome 8q24 and prostate cancer risk: results from an Australian population-based case-control study. Cancer Epidemiol Biomarkers Prev. 2007;16:610-612
53. Wang L, McDonnell SK, Slusser JP, Hebbring SJ, Cunningham JM, Jacobsen SJ. et al. Two common chromosome 8q24 variants are associated with increased risk for prostate cancer. CANCER RES. 2007;67:2944-2950
54. Gudmundsson J, Sulem P, Manolescu A, Amundadottir LT, Gudbjartsson D, Helgason A. et al. Genome-wide association study identifies a second prostate cancer susceptibility variant at 8q24. NAT GENET. 2007;39:631-637
55. Ghoussaini M, Song H, Koessler T, Al OA, Kote-Jarai Z, Driver KE. et al. Multiple loci with different cancer specificities within the 8q24 gene desert. J Natl Cancer Inst. 2008;100:962-966
56. Kim T, Cui R, Jeon YJ, Lee JH, Lee JH, Sim H. et al. Long-range interaction and correlation between MYC enhancer and oncogenic long noncoding RNA CARLo-5. Proc Natl Acad Sci U S A. 2014;111:4173-4178
57. Ren XQ, Zhang JG, Xin SY, Cheng T, Li L, Ren WH. Variants on 8q24 and prostate cancer risk in Chinese population: a meta-analysis. INT J CLIN EXP MED. 2015;8:8561-8570
58. Okobia MN, Zmuda JM, Ferrell RE, Patrick AL, Bunker CH. Chromosome 8q24 variants are associated with prostate cancer risk in a high risk population of African ancestry. PROSTATE. 2011;71:1054-1063
59. Rebbeck TR. Prostate Cancer Genetics: Variation by Race, Ethnicity, and Geography. SEMIN RADIAT ONCOL. 2017;27:3-10
60. Brown R, Pasaniuc B. Enhanced methods for local ancestry assignment in sequenced admixed individuals. PLOS COMPUT BIOL. 2014;10:e1003555
61. McGall G, Labadie J, Brock P, Wallraff G, Nguyen T, Hinsberg W. Light-directed synthesis of high-density oligonucleotide arrays using semiconductor photoresists. Proc Natl Acad Sci U S A. 1996;93:13555-13560
62. Brentani RR, Carraro DM, Verjovski-Almeida S, Reis EM, Neves EJ, de Souza SJ. et al. Gene expression arrays in cancer research: methods and applications. Crit Rev Oncol Hematol. 2005;54:95-105
Author contact
![]() Corresponding authors: Wei Zhang, Department of Urology, The First Affiliated Hospital of Nanjing Medical University, No. 300 Guangzhou Road, Nanjing, 210029, China. E-mail: zhangweiedu.cn TEL: +08613901595401 Wei Wang, Department of Urology, The First Affiliated Hospital of Nanjing Medical University, No. 300 Guangzhou Road, Nanjing, 210029, China. E-mail: 13675132117com TEL: +08613675132117
Corresponding authors: Wei Zhang, Department of Urology, The First Affiliated Hospital of Nanjing Medical University, No. 300 Guangzhou Road, Nanjing, 210029, China. E-mail: zhangweiedu.cn TEL: +08613901595401 Wei Wang, Department of Urology, The First Affiliated Hospital of Nanjing Medical University, No. 300 Guangzhou Road, Nanjing, 210029, China. E-mail: 13675132117com TEL: +08613675132117