Impact Factor ISSN: 1837-9664

 Global reach, higher impact
J Cancer 2017; 8(15):2892-2898. doi:10.7150/jca.20077 This issue Cite
Research Paper
18F-FDG PET/CT as an Indicator of Survival in Ewing Sarcoma of Bone
Usama Salem1 ![]() , Behrang Amini1, Hubert H. Chuang2, Najat C. Daw3, Wei Wei4, Tamara Miner Haygood1, John E. Madewell1, Colleen M. Costelloe1
, Behrang Amini1, Hubert H. Chuang2, Najat C. Daw3, Wei Wei4, Tamara Miner Haygood1, John E. Madewell1, Colleen M. Costelloe1
1. Department of Diagnostic Radiology, The University of Texas MD Anderson Cancer Center, Houston, TX;
2. Department of Nuclear Medicine, The University of Texas MD Anderson Cancer Center, Houston, TX;
3. Department of Pediatrics, The University of Texas MD Anderson Cancer Center, Houston, TX;
4. Department of Biostatistics, The University of Texas MD Anderson Cancer Center, Houston, TX;
Received 2017-3-14; Accepted 2017-6-30; Published 2017-8-25
Abstract
Objective: The existing literature of 18 F-FDG PET/CT in Ewing sarcoma investigates mixed populations of patients with both soft tissue and bone primary tumors. The aim of our study was to evaluate whether the maximum standardized uptake value (SUVmax) obtained with 18F-FDG PET/CT before and after induction chemotherapy can be used as an indicator of survival in patients with Ewing sarcoma originating exclusively in the skeleton.
Materials and Methods: A retrospective database search from 2004-2011 identified 28 patients who underwent 18 F-FDG PET/CT before (SUV1, n= 28) and after (SUV2, n=23) induction chemotherapy. Mean follow up was 3.3 years and median follow up for survivors was 6.3 years (range: 2.6-9.8 years). Multivariate and univariate Cox proportional hazard model was used to assess for correlation of SUV1, SUV2, and the change in SUVmax with overall survival (OS) and progression-free survival (PFS).
Results: Mean SUVmax was 10.74 before (SUV1) and after 4.11 (SUV2) induction chemotherapy. High SUV1 (HR = 1.05, 95% CI: 1.0-1.1, P = 0.01) and SUV2 (HR =1.2, 95% CI: 1.0-1.4, P = 0.01) were associated with worse OS. A cut off point of 11.6 was identified for SUV1. SUV1 higher than 11.6 had significantly worse OS (HR = 5.71, 95% CI: 1.85 - 17.61, P = 0.003) and PFS (HR = 3.16, 95% CI: 1.13 - 8.79, P = 0.03, P < 0.05 is significant).
Conclusion: 18F-FDG PET/CT can be used as a prognostic indicator for survival in primary Ewing sarcoma of bone.
Keywords: Ewing sarcoma, FDG PET/CT, SUV, Overall survival, Progression free survival.
Introduction
Ewing sarcoma (ES) represents 2% of cancers in children and the adolescent population, being the second most common bone malignancy after osteosarcoma [1, 2]. It accounts for 6-8% of all primary malignant bone tumors in the general population [3, 4]. About 225 new cases are reported annually in the United States [5]. Ewing sarcoma has a predilection for males with a male to female ratio of 6:4 [3, 6]. The incidence of Ewing sarcoma shows distinct racial variation affecting Caucasians 9 times more commonly than African Americans [6, 7]. Several prognostic factors that adversely affect patient survival have been reported such as the presence of metastases at presentation, large size of the primary tumor (volume larger than 100 ml [8], and 150 ml [9]), and poor response to chemotherapy [8-10]. Tumor response to chemotherapy is widely considered an important prognostic factor, which correlates with both local tumor recurrence and patient survival [9-11]. However, chemotherapeutic response cannot be always easily assessed, especially in tumors arising from bone. A common method used to evaluate the response is the histo-pathological analysis of the degree of tumor necrosis after surgical resection of the primary tumor. However, this cannot be assessed in patients managed without surgery. A way to evaluate response before or in the absence of surgery is by assessing tumor metabolism using 18F-FDG PET/CT (18 F-FDG PET/CT will be referred to as PET/CT) [10]. Although PET/CT has an established role in the staging of malignancies in general and ES in particular [12-17], few reports have investigated for a relationship between FDG uptake and patient survival in ES [18-22]. The majority of prior investigators have studied mixed populations of patients with tumors arising in both soft tissue and bone. The aim of our study was to evaluate whether PET/CT using the maximum standardized uptake value (SUVmax) before (SUV1) and after (SUV2) induction chemotherapy can be used as an indicator of survival in a population of patients with ES originating in bone and not in soft tissue.
Materials and Methods
Patient population
After obtaining IRB approval, a retrospective database search was performed from 2004 - 2011 for patients with primary ES of bone. Patients with soft tissue primary tumors were excluded. In addition, we excluded all the patients who did not have histologic confirmation of ES, had PET/CT performed at a different institution, were alive with < 2.5 years of follow-up, or received any treatment before the initial PET/CT scan.
Patient age, gender, the tumor location, and disease stage were recorded. We analyzed the pre- and post-induction chemotherapy PET/CT and measured the SUVmax, and percent change. The measurements were calculated separately by 2 physicians with 6 and 9 years of experience in PET/CT interpretation. No consensus readings were performed. In case of discrepancy between the 2 readers, a musculoskeletal radiologist with 8 years of experience in PET/CT interpretation was used as a tie breaker. Discrepancy was defined by ≥ 1 unit difference in SUVmax between reader 1 and 2.
The starting date of induction chemotherapy, the dates of radiation therapy, and the date of surgery (when applicable) were recorded in addition to the date and site of any disease relapse or progression (local or distant disease). The date of the last available follow up for all patients was recorded. If the patient died, we investigated whether it was cancer-related and recorded the date of death. SUV1, SUV2 and percent change were assessed for a relationship with overall survival (OS) and progression free survival (PFS).
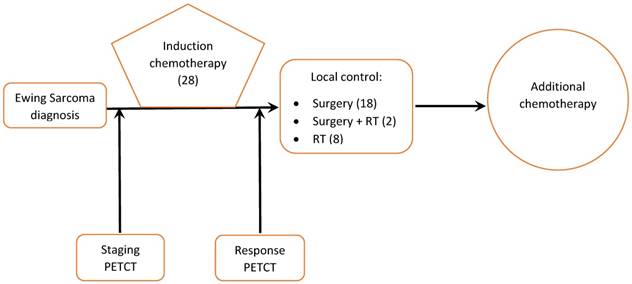
Treatment consisted of cycles of multi-agent chemotherapy given prior to local tumor treatment (induction phase) followed by additional cycles of chemotherapy, surgery, radiation, or both for local tumor control (Figure 1).
Management of Ewing sarcoma patients at our institution (number of patients in brackets)
PET/CT
The initial PET/CT was performed on chemotherapy-naïve patients prior to the start of therapy. A second PET/CT was performed after the completion of the induction chemotherapy and prior to local tumor control. Integrated PET/CT systems were utilized to acquire imaging data (Discovery ST, STe, or RX, General Electric Medical Systems, Milwaukee, WI). Whole-body examinations were performed from the level of the vertex of the skull or orbits through the upper thighs or lower legs/toes depending on the location of the primary tumor. All patients were fasted for a minimum of 6 hours prior to study, with fasting blood glucose less than 150 mg/dl prior to intravenous administration of FDG. PET scans were obtained in either 2D or 3D mode, with 15 -20 mCi FDG administered for 2D scans and 7-12 mCi for 3D scans in adults (a dose of 0.1 mCi/kg was used for children up to 100kg), and images were obtained approximately 60 minutes after radiopharmaceutical administration. Unenhanced CT was used for attenuation correction and diagnosis and included 3.75 mm axial slice placement, 140 kV, 120 mA at 13.5 mm table speed.
Statistical analyses
Univariate Cox proportional hazard model was used to assess effects of SUV1, SUV2, and the change of SUVmax on overall survival (OS) and progression-free survival (PFS). Survival was calculated from the induction chemotherapy start date (for SUV1 analyses) or post-induction chemotherapy PET/CT date (for SUV2 and SUVmax change analyses) to the date of death from any cause or the date of last patient contact for survivors. PFS was defined as the time interval from the induction chemotherapy start date to date of disease relapse/progression or death or to the date of the last patient contact for patients without events. SUVmax were modeled in both continuous and dichotomized form. Recursive partitioning analysis (RPA) was used to identify the optimal cutoff points of SUVs for survival endpoints. Recursive partitioning is used for multivariable analysis where a decision tree classifies members of the population by splitting it into more homogenous sub-populations based on several dichotomous independent variables. Each sub-population may be split an indefinite number of times (recursive) until the splitting process terminates after a particular stopping criterion is reached [23]. A backwards elimination procedure was used to identify multivariate Cox proportional hazard models for OS and PFS. The Shrout and Fleiss method was used to calculate intraclass correlation coefficient (ICC) between the two radiologists who independently measured the SUV values of each patient [24, 25]. All tests were two-sided and p-values of 0.05 or less were considered statistically significant. Statistical analysis was carried out using SAS version 9 (SAS Institute, Cary, NC).
Results
Twenty-eight patients met our inclusion criteria. Mean follow up was 3.3 years and median follow up for survivors was 6.3 years (range: 2.6-9.8 years). Nine patients had metastatic disease at presentation. Pre-induction chemotherapy PET/CT was available for all patients. Post-induction chemotherapy PET/CT was available for 23 patients. The remaining 5 patients underwent surgery without undergoing post treatment PET/CT. Ten patients received adjuvant radiation to the primary tumor, either at the end of chemotherapy (8 patients) or before surgery (2 patients). No patient received radiation therapy before chemotherapy and all radiation therapy was administered after the second PET/CT scan. Surgical resection of the primary tumor was performed in 20 patients (Figure 1).
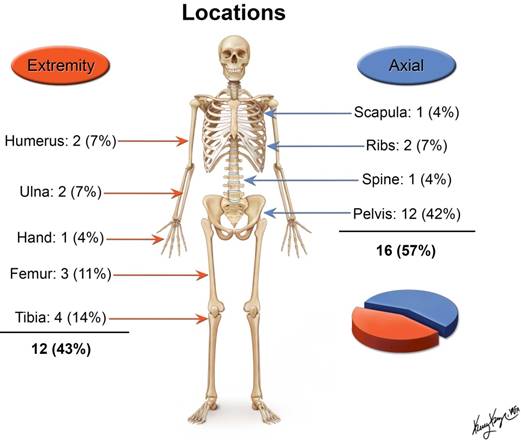
The age of patients at the time of presentation ranged between 4 and 28 years with a mean of 17.4 years and median of 18 years. There were 19 male and 9 female patients. The majority of the tumors originated in the pelvis (Figure 2).
Locations of the primary tumor
Thirteen of the 28 patients (46%) remained disease-free. The remaining 15 patients had disease relapse or progression (Table 1). Of the 15 patients who had disease relapse or progression, 13 patients died: 12 patients died of disease, and 1 succumbed to treatment-related acute myeloid leukemia.
Clinical outcome of 28 patients with Ewing sarcoma of bone
| Variable | No. of Patients (%) |
|---|---|
| Disease free | 13 (46) |
| Relapse/Progression | 15 (54) |
| Local | 3 (11) |
| Nodal | 1 (4) |
| Local + bone | 1 (4) |
| Distant | 10 (36) |
| Life status at last follow up | |
| Alive | 15 (54) |
| Dead | 13 (46) |
| Alive with disease progression | 2 (7) |
| Cause of death | |
| ES* | 12 (92) |
| Treatment related | 1 (8) |
*ES: Ewing sarcoma
We found a significant relationship between the SUVmax and patient survival as a continuous variable (Tables 2 and 3). The higher the SUV1 and SUV2, the worse the prognosis. A high SUV1 was associated with worse OS (1 unit increase HR = 1.05, 95% CI: 1.0-1.1, P = 0.01) and a high SUV2 was associated with worse OS (1 unit increase HR =1.2, 95% CI: 1.0-1.4, P = 0.01). The change in SUVmax values after receiving induction chemotherapy was not significantly associated with OS. No correlation to PFS was initially found.
Summary of SUVmax
| N | Mean | Min | Median | Max | |
|---|---|---|---|---|---|
| SUV1* | 28 | 10.74 | 2.20 | 8.95 | 63.90 |
| SUV2^ | 23 | 4.11 | 1.60 | 3.20 | 16.60 |
| SUV Change (%) = 100 x (SUV2 -SUV1)/ SUV1 | 23 | -60.33 | -80.37 | -61.98 | -9.09 |
*SUV1: Standard uptake value before induction chemotherapy; ^SUV2: Standard uptake value after induction chemotherapy
Summary of univariate Cox proportional hazard model for overall survival (OS)
| Variable* | Hazard Ratio^ | 95% Hazard Ratio Confidence Limits | P-value | Sample Size | |
|---|---|---|---|---|---|
| SUV1 | 1.05 | 1.01 | 1.09 | 0.01 | 28 |
| SUV2 | 1.21 | 1.05 | 1.41 | 0.01 | 23 |
| Change in SUVmax | 0.98 | 0.95 | 1.02 | 0.43 | 23 |
*SUV values were modeled as continuous variables
^Hazard ratio higher than 1 means worse prognosis
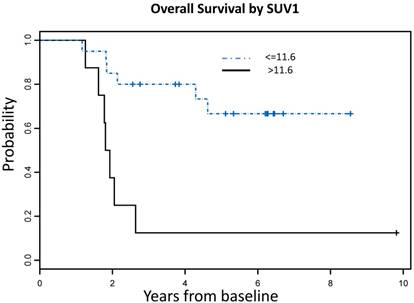
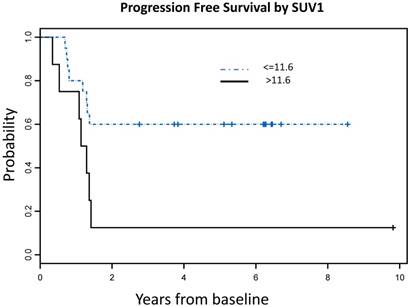
Using recursive partitioning analysis (RPA), we identified an optimal SUV1 cutoff value of 11.6, which correlated with both OS and PFS. Patients with SUV1 higher than 11.6 had significantly worse OS (HR = 5.71, 95% CI: 1.85 - 17.61, P = 0.003) and PFS (HR = 3.16, 95% CI: 1.13 - 8.79, P = 0.03) compared to those with lower SUV1 (Figure 3). No significant SUV2 cutoff value was identified.
SUVmax cutoff values associated with OS and PFS A: Overall Survival Probability: Patients with SUVmax >11.6 had significantly worse OS [7 events (deaths) in total number of 8 patients] compared to those with lower SUVmax [6 events (deaths) in total number of 20 patients], (HR = 5.71, 95% CI: 1.85 - 17.61, P = 0.003) B: Progression Free Survival Probability: Patients with SUVmax >11.6 had significantly worse PFS [7 events (deaths or progression) in a total number of 8 patients] compared to those with lower SUVmax [8 events (deaths or progression) in a total number of 20 patients], (HR = 3.16, 95% CI: 1.13 - 8.79, P = 0.03)
No correlation was found between gender, age, tumor location and survival (Table 4). When the same factors were analyzed with SUV1, we found that patients who had SUV1 higher than 11.6 were significantly older than those with lower SUV1 (P = 0.008). Multivariate analysis showed that high SUV1 was significantly associated with worse OS after adjusting for age effect (P=0.02).
Summary of univariate Cox proportional hazard model results by endpoint. Patients with baseline SUVmax higher than 11.55 had significantly worse OS compared to those with lower SUVmax (HR = 5.71, 95% CI: 1.85 - 17.61, P = 0.003). No significant cut-off value was identified for SUV2.
| Endpoint | Factor | Comparison | Hazard Ratio | 95% LCL | 95% UCL | P-value | # Events | # Censored | # Total |
|---|---|---|---|---|---|---|---|---|---|
| OS | Gender | Female vs. Male | 0.63 | 0.17 | 2.28 | 0.48 | 13 | 15 | 28 |
| Mets | No vs. Yes | 0.45 | 0.15 | 1.35 | 0.15 | 13 | 15 | 28 | |
| SUV1 | >11.55 vs. <=11.55 | 5.71 | 1.85 | 17.61 | 0.003 | 13 | 15 | 28 | |
| SUV2 | >3.35 vs. <=3.35 | 2.90 | 0.84 | 9.94 | 0.09 | 11 | 12 | 23 | |
| SUVmax %change | >-60.45 vs. <=-60.45 | 0.49 | 0.13 | 1.85 | 0.29 | 11 | 12 | 23 | |
| Tumor necrosis | >=90% vs. <90% | 1.00 | 0.19 | 5.21 | >0.99 | 7 | 13 | 20 | |
| Age | 1 year increase | 1.08 | 0.98 | 1.19 | 0.14 | 13 | 15 | 28 | |
| Location | Axial vs Extremity | 2.96 | 0.81 | 10.77 | 0.10 | 13 | 15 | 28 | |
| PFS | Gender | Female vs. Male | 0.62 | 0.20 | 1.96 | 0.42 | 15 | 13 | 28 |
| Mets | No vs. Yes | 0.71 | 0.25 | 2.00 | 0.51 | 15 | 13 | 28 | |
| SUV1 | >11.55 vs. <=11.55 | 3.16 | 1.13 | 8.79 | 0.03 | 15 | 13 | 28 | |
| SUV2 | >3.35 vs. <=3.35 | 3.06 | 0.89 | 10.55 | 0.08 | 11 | 12 | 23 | |
| SUVmax %change | >-60.45 vs. <=-60.45 | 0.50 | 0.13 | 1.87 | 0.30 | 11 | 12 | 23 | |
| Tumor necrosis | >=90% vs. <90% | 1.39 | 0.15 | 12.43 | 0.77 | 5 | 12 | 17 | |
| Age | 1 year increase | 1.04 | 0.96 | 1.14 | 0.34 | 15 | 13 | 28 | |
| Location | Axial vs Extremity | 2.77 | 0.76 | 10.09 | 0.12 | 13 | 15 | 28 |
Discussion
Our results indicate that PET/CT, using the SUVmax value before and after induction chemotherapy, can be used to predict survival in patients with ES of bone. High SUV1 was associated with worse OS (P = 0.01), and high SUV2 was also associated with worse OS (P = 0.01). Using a cut-point of 11.6, a strong correlation was found between SUV1 and OS (P = 0.003). The correlation to PFS was not as strong but was also significant (P = 0.03). No correlation to PFS was initially found, suggesting that PET/CT may be more effective at predicting OS than PFS in ES of bone.
Newly diagnosed patients with ES may undergo PET/CT for initial staging and assessment of tumor burden. After induction chemotherapy, the patient may undergo a subsequent PET/CT to assess for response [26]. PET/CT has been used to evaluate chemotherapeutic response for many tumors such as gastrointestinal stromal tumor (GIST), esophageal cancer, breast cancer and soft tissue sarcomas [15, 27-29]. Studies have also showed its utility for assessing response to radiation therapy in patients with head and neck cancers [30], lung [31] and rectal cancers [32]. Furthermore, it has been used to predict survival, such as in patients with lymphoma and osteosarcoma [33-36].
Few publications address the role of PET/CT to evaluate chemotherapeutic response [16, 17, 37-40] or predict survival in patients with ES [18-22]. This is one of the first and largest studies to evaluate a population of patients with ES originating exclusively in the skeleton. In the literature, most previous investigators have evaluated small heterogeneous cohorts of patients with the “Ewing sarcoma family of tumors” arising in skeletal and extraskeletal sites (Table 5). A prior study of a mixed population of soft tissue and bone primary ES by Hawkins et al. [18], found a significant correlation between SUV2 and outcome, showing improved PFS with SUV2 < 2.5. A more recent mixed population study by Raciborska et al. [19], found similar results between SUV2 and improved OS. A study of primary skeletal tumors by Palmerini et al. [22], found a significant correlation between SUV1 < 6 and improved PFS in ES, which also supports our results. A summary of the published studies with survival analysis is presented in Table 5. These studies variously demonstrate that PET/CT performed before or after therapy correlates with patient survival.
Summary of the published reports investigating PET and/or PETCT in ES and/or ES family if tumors (ESFT) and survival.
| Reference | Modality | Tumor site | Single or multi-institution | No. Of patients | Study aim | Results |
|---|---|---|---|---|---|---|
| Hawkins et al. 2005 [18] | PET | Bone and soft tissue | Single | 36 | Determine the prognostic value of PET response for outcome | 1. SUV2** < 2.5 correlated with improved PFS¤ (P=0.01) 2. SUV2:1 was not predictive of PFS¤ |
| Hyun et al. 2016 [21] | PET | Bone and soft tissue | Multi | 115 | Determine the prognostic value of PET for monitoring specific therapy (monoclonal antibody to IGF-1Rα antibody) using SUV corrected for lean body mass (SUL). | 1. Progressive metabolic disease on SUV2** correlated with ↑ risk of death. 2. %SULpeakβ decrease ˂10.5% (by 9 d after therapy) showed shorter OS§ (median, 5.5 m; 95% CI^, 4.2-6.8 m) than patients with a decrease ≥10.5% (median, 11.7 m; 95% CI, 8.9-18.1 m). P˂0.001 |
| Raciborska et al. 2016 [19] | PET/CT | ES (not reported if bone only) | Multi | 50 | Determine the value of PET/CT to predict response to chemotherapy | 1. SUV1 was lower in patients with good histological response (3.8 vs 7.2), P = 0.02 2. SUV2 was higher in patients with disease progression (2.3 vs 1.5), P = 0.04 3. SUV2 ≤ 2.5 was associated with improved OS, P = 0.0004 and PFS P = 0.005 (univariate analysis). |
| Hwang et al. 2016 [20] | PET/CT | ESε (bone and soft tissue) | Not reported | 34 | Determine the prognostic value of pre-therapeutic PET/CT. | SUV1* ≤ 5.8 correlated with longer OS§, P = 0.002 2. Higher SUV1 (P = 0.003), older age (P = 0.023), and higher stage (P = 0.03) were associated with worse OS§. |
| Palmerini et al. 2016 [22] | PET/CT | ESε and OSTδ of bone | Single | 45 ESε and 32 OSTδ | Determine the prognostic role of pre-therapeutic PET/CT | 1. Tumor necrosis ≥ 90% was 30 % in patients with high (≥ 6) SUV1 and 72 % with low (< 6) SUV1 (p = 0.0004). 2. The 3-year EFSγ was 37 % with high SUV1 and 75 % with low SUV1 (P = 0.004). |
¤PFS: Progression free survival; §OS: Overall Survival; αIGF-1R: Insulin-like growth factor 1 receptor; βSUL: Standardized uptake value (SUV) normalized by lean body mass; *SUV1: Standard uptake value before induction chemotherapy; **SUV2: Standard uptake value after induction chemotherapy; ^CI: Confidence interval; εES: Ewing sarcoma; δOST: Osteosarcoma; γEFS: Event free survival
In our study, we found a significant correlation between SUV1, SUV2 and OS. However, the reduction in SUVmax between the 2 scans was not significantly associated with OS or PFS, which is similar to the results of prior reports [18, 19]. Of the 12 patients who had disease relapse or progression, 8 patients had a marked reduction in SUVmax, ranging from 61% to 80%. In addition, 6 patients had a reduction of SUV2 close to the background muscle activity, ranging from 1.6-3.5, and still had disease relapse/progression.
Our cutoff point for SUV1 was 11.6. We did not find a cutoff point for SUV2 that significantly separated patients with respect to survival, possibly due to the continuum effect of SUV2 on survival. In addition, the lack SUV2 data on 5 patients, who underwent surgery without undergoing post treatment PET/CT, decreased the SUV2 data available for analysis, which may have also contributed to our inability to find a significant correlation between SUV2 and PFS. Our results suggest that the metabolic state of the tumor before treatment may be more indicative of outcome than the post-therapeutic SUV value in patients with primary ES of bone.
Our study has several advantages when compared to prior reports. This is one of the first studies of a population of ES arising exclusively in the skeleton to correlate metabolic uptake on PET/CT with survival. We focused only on ES of bone, excluding extra-skeletal Ewing and primitive neuroectodermal tumors. All of our examinations were performed with dual modality PET/CT scanners, not PET only or separate parallel PET and CT scanners. PET/CT has been shown to have significant advantages when compared to PET alone [41]. PET/CT showed better lesion detection and improved tumor localization than PET-only scans, as is reflected in its superior sensitivity, specificity, accuracy, positive predictive value, and negative predictive value in a study of 53 patients with ES [12].
Limitations of our study include small sample size, lack of SUV2 data on 5 patients and a referral bias toward more severe and advanced cases. Furthermore, our study is retrospective and contains a combined population of pediatric and adult patients who received varied therapeutic regimens. Although a known prognostic factor, we did not find a significant correlation between the presence or absence of metastases at presentation and survival. This lack of significance is likely due to our small sample size, and the unequal number of patients presenting with metastases versus without metastases (9 metastatic versus 19 non-metastatic). Our results verify those of other investigators with respect to older patient age and worse outcome [5, 20]. Future work is needed to assess for a difference in the relationship between FDG uptake and prognosis in pediatric and adult patients with Ewing sarcoma.
Conclusion
Our study indicates that a high SUVmax on pre-therapeutic and post-therapeutic FDG PET/CT scans correlates with OS, and that a pre-therapeutic SUVmax > 11.6 is associated with worse OS and PFS in patients with ES originating in bone. Future prospective studies including larger numbers of patients are needed to confirm these results.
Abbreviations
ES: Ewing sarcoma; OS: overall survival; PFS: progression free survival
Informed consent
IRB Waiver of informed consent
Competing Interests
Our third co-author is a consultant for Sage Health Management Solutions.
References
1. Ludwig JA. Ewing sarcoma: historical perspectives, current state-of-the-art, and opportunities for targeted therapy in the future. Current opinion in oncology. 2008;20:412-8
2. Herzog CE. Overview of sarcomas in the adolescent and young adult population. J Pediatr Hematol Oncol. 2005;27:215-8
3. Unni KK, Inwards CY. Ewing Tumor. Dahlin's Bone Tumors: General Aspects and Data on 10,165 Cases. Sixth ed: Wollters Kluwer Health/Lippincott Williams & Wilkins. 2010:211-24
4. Shinichiro Ushigome RM, Poul Sorensen. Ewing sarcoma / Primitive neuroectodermal tumour (PNET). In: (ed.) Christopher Fletcher KU, Fredrik Mertens. World Health Organization classification of tumours: pathology and genetics of tumours of soft tissue and bone. Lyon: IARCPress. 2002:298-300
5. Esiashvili N, Goodman M, Marcus RB Jr. Changes in incidence and survival of Ewing sarcoma patients over the past 3 decades: Surveillance Epidemiology and End Results data. J Pediatr Hematol Oncol. 2008;30:425-30
6. Jawad MU, Cheung MC, Min ES, Schneiderbauer MM, Koniaris LG, Scully SP. Ewing sarcoma demonstrates racial disparities in incidence-related and sex-related differences in outcome: an analysis of 1631 cases from the SEER database, 1973-2005. Cancer. 2009;115:3526-36
7. Parkin DM, Stiller CA, Nectoux J. International variations in the incidence of childhood bone tumours. Int J Cancer. 1993;53:371-6
8. Cotterill SJ, Ahrens S, Paulussen M, Jurgens HF, Voute PA, Gadner H. et al. Prognostic factors in Ewing's tumor of bone: analysis of 975 patients from the European Intergroup Cooperative Ewing's Sarcoma Study Group. J Clin Oncol. 2000;18:3108-14
9. Bacci G, Longhi A, Ferrari S, Mercuri M, Versari M, Bertoni F. Prognostic factors in non-metastatic Ewing's sarcoma tumor of bone: an analysis of 579 patients treated at a single institution with adjuvant or neoadjuvant chemotherapy between 1972 and 1998. Acta Oncol. 2006;45:469-75
10. Lin PP, Jaffe N, Herzog CE, Costelloe CM, Deavers MT, Kelly JS. et al. Chemotherapy response is an important predictor of local recurrence in Ewing sarcoma. Cancer. 2007;109:603-11
11. Grier HE, Krailo MD, Tarbell NJ, Link MP, Fryer CJ, Pritchard DJ. et al. Addition of ifosfamide and etoposide to standard chemotherapy for Ewing's sarcoma and primitive neuroectodermal tumor of bone. N Engl J Med. 2003;348:694-701
12. Gerth HU, Juergens KU, Dirksen U, Gerss J, Schober O, Franzius C. Significant benefit of multimodal imaging: PET/CT compared with PET alone in staging and follow-up of patients with Ewing tumors. J Nucl Med. 2007;48:1932-9
13. Gyorke T, Zajic T, Lange A, Schafer O, Moser E, Mako E. et al. Impact of FDG PET for staging of Ewing sarcomas and primitive neuroectodermal tumours. Nucl Med Commun. 2006;27:17-24
14. Furth C, Amthauer H, Denecke T, Ruf J, Henze G, Gutberlet M. Impact of whole-body MRI and FDG-PET on staging and assessment of therapy response in a patient with Ewing sarcoma. Pediatr Blood Cancer. 2006;47:607-11
15. Benz MR, Czernin J, Allen-Auerbach MS, Tap WD, Dry SM, Elashoff D. et al. FDG-PET/CT imaging predicts histopathologic treatment responses after the initial cycle of neoadjuvant chemotherapy in high-grade soft-tissue sarcomas. Clinical cancer research. 2009;15:2856-63
16. Hawkins DS, Rajendran JG, Conrad EU 3rd, Bruckner JD, Eary JF. Evaluation of chemotherapy response in pediatric bone sarcomas by [F-18]-fluorodeoxy-D-glucose positron emission tomography. Cancer. 2002;94:3277-84
17. Gaston LL, Di Bella C, Slavin J, Hicks RJ, Choong PF. 18F-FDG PET response to neoadjuvant chemotherapy for Ewing sarcoma and osteosarcoma are different. Skeletal Radiol. 2011;40:1007-15
18. Hawkins DS, Schuetze SM, Butrynski JE, Rajendran JG, Vernon CB, Conrad EU 3rd. et al. [18F]Fluorodeoxyglucose positron emission tomography predicts outcome for Ewing sarcoma family of tumors. J Clin Oncol. 2005;23:8828-34
19. Raciborska A, Bilska K, Drabko K, Michalak E, Chaber R, Pogorzala M. et al. Response to chemotherapy estimates by FDG PET is an important prognostic factor in patients with Ewing sarcoma. Clin Transl Oncol. 2016;18:189-95
20. Hwang JP, Lim I, Kong CB, Jeon DG, Byun BH, Kim BI. et al. Prognostic Value of SUVmax Measured by Pretreatment Fluorine-18 Fluorodeoxyglucose Positron Emission Tomography/Computed Tomography in Patients with Ewing Sarcoma. PloS one. 2016;11:e0153281
21. Hyun OJ, Luber BS, Leal JP, Wang H, Bolejack V, Schuetze SM. et al. Response to Early Treatment Evaluated with 18F-FDG PET and PERCIST 1.0 Predicts Survival in Patients with Ewing Sarcoma Family of Tumors Treated with a Monoclonal Antibody to the Insulinlike Growth Factor 1 Receptor. J Nucl Med. 2016;57:735-40
22. Palmerini E, Colangeli M, Nanni C, Fanti S, Marchesi E, Paioli A. et al. The role of FDG PET/CT in patients treated with neoadjuvant chemotherapy for localized bone sarcomas. Eur J Nucl Med Mol Imaging. 2016
23. Breiman L, Friedman JH, Olshen RA, Stone CJ. Classification and regression trees. Wadsworth & Brooks. Monterey, CA. 1984
24. Cicchetti DV. Guidelines, criteria, and rules of thumb for evaluating normed and standardized assessment instruments in psychology. Psychological assessment. 1994;6:284
25. Shrout PE, Fleiss JL. Intraclass correlations: uses in assessing rater reliability. Psychol Bull. 1979;86:420-8
26. Meyer JS, Nadel HR, Marina N, Womer RB, Brown KL, Eary JF. et al. Imaging guidelines for children with Ewing sarcoma and osteosarcoma: a report from the Children's Oncology Group Bone Tumor Committee. Pediatr Blood Cancer. 2008;51:163-70
27. Van den Abbeele AD, Badawi RD. Use of positron emission tomography in oncology and its potential role to assess response to imatinib mesylate therapy in gastrointestinal stromal tumors (GISTs). European Journal of Cancer. 2002;38:S60-S5
28. Lordick F, Ott K, Krause B-J, Weber WA, Becker K, Stein HJ. et al. PET to assess early metabolic response and to guide treatment of adenocarcinoma of the oesophagogastric junction: the MUNICON phase II trial. The lancet oncology. 2007;8:797-805
29. Kumar A, Kumar R, Seenu V, Gupta SD, Chawla M, Malhotra A. et al. The role of 18F-FDG PET/CT in evaluation of early response to neoadjuvant chemotherapy in patients with locally advanced breast cancer. European radiology. 2009;19:1347-57
30. Andrade RS, Heron DE, Degirmenci B, Pedro Filho A, Branstetter BF, Seethala RR. et al. Posttreatment assessment of response using FDG-PET/CT for patients treated with definitive radiation therapy for head and neck cancers. International Journal of Radiation Oncology* Biology* Physics. 2006;65:1315-22
31. Vaidya M, Creach KM, Frye J, Dehdashti F, Bradley JD, El Naqa I. Combined PET/CT image characteristics for radiotherapy tumor response in lung cancer. Radiotherapy and Oncology. 2012;102:239-45
32. Capirci C, Rampin L, Erba PA, Galeotti F, Crepaldi G, Banti E. et al. Sequential FDG-PET/CT reliably predicts response of locally advanced rectal cancer to neo-adjuvant chemo-radiation therapy. European journal of nuclear medicine and molecular imaging. 2007;34:1583-93
33. Hutchings M, Loft A, Hansen M, Pedersen LM, Buhl T, Jurlander J. et al. FDG-PET after two cycles of chemotherapy predicts treatment failure and progression-free survival in Hodgkin lymphoma. Blood. 2006;107:52-9
34. Mikhaeel N, Hutchings M, Fields P, O'Doherty M, Timothy A. FDG-PET after two to three cycles of chemotherapy predicts progression-free and overall survival in high-grade non-Hodgkin lymphoma. Annals of oncology. 2005;16:1514-23
35. Haioun C, Itti E, Rahmouni A, Brice P, Rain J-D, Belhadj K. et al. [18F] fluoro-2-deoxy-D-glucose positron emission tomography (FDG-PET) in aggressive lymphoma: an early prognostic tool for predicting patient outcome. Blood. 2005;106:1376-81
36. Costelloe CM, Macapinlac HA, Madewell JE, Fitzgerald NE, Mawlawi OR, Rohren EM. et al. 18F-FDG PET/CT as an indicator of progression-free and overall survival in osteosarcoma. J Nucl Med. 2009;50:340-7
37. Denecke T, Hundsdorfer P, Misch D, Steffen IG, Schonberger S, Furth C. et al. Assessment of histological response of paediatric bone sarcomas using FDG PET in comparison to morphological volume measurement and standardized MRI parameters. Eur J Nucl Med Mol Imaging. 2010;37:1842-53
38. Franzius C, Sciuk J, Brinkschmidt C, Jurgens H, Schober O. Evaluation of chemotherapy response in primary bone tumors with F-18 FDG positron emission tomography compared with histologically assessed tumor necrosis. Clin Nucl Med. 2000;25:874-81
39. Gupta K, Pawaskar A, Basu S, Rajan MG, Asopa RV, Arora B. et al. Potential role of FDG PET imaging in predicting metastatic potential and assessment of therapeutic response to neoadjuvant chemotherapy in Ewing sarcoma family of tumors. Clin Nucl Med. 2011;36:973-7
40. Kim DH, Kim SY, Lee HJ, Song BS, Kim DH, Cho JB. et al. Assessment of Chemotherapy Response Using FDG-PET in Pediatric Bone Tumors: A Single Institution Experience. Cancer Res Treat. 2011;43:170-5
41. Treglia G, Salsano M, Stefanelli A, Mattoli MV, Giordano A, Bonomo L. Diagnostic accuracy of (1)(8)F-FDG-PET and PET/CT in patients with Ewing sarcoma family tumours: a systematic review and a meta-analysis. Skeletal Radiol. 2012;41:249-56
Author contact
![]() Corresponding author: Usama Salem, M.D., Department of Diagnostic Radiology-Unit 1476, The University of Texas MD Anderson Cancer Center, 1515 Holcombe Blvd. Houston, TX 77030 Telephone: 713-792-8182 Fax: 713-745-1151 Email: usalemorg
Corresponding author: Usama Salem, M.D., Department of Diagnostic Radiology-Unit 1476, The University of Texas MD Anderson Cancer Center, 1515 Holcombe Blvd. Houston, TX 77030 Telephone: 713-792-8182 Fax: 713-745-1151 Email: usalemorg